Bitcoin call from March comes into fruition, Almost to the day!Not looking to toot horn but, did we state anything about buying CRYPTOCAP:BTC or CRYPTOCAP:ETH until recently? NO! (pls see our profile for more info on that)
We have been analyzing Bitcoin & Ethereum and posting suggestions. But until recently we did not state any buy recommendations.
In fact, om March 25th we stated that there would be a big move coming by mid April!
We then changed our stance on #Bitcoin. We noticed, far to frequent anomaly using
@tradingview charts, trendlines MOVE on their own, that the move COULD be until the 8th of May! HOWEVER, less than 2 weeks ago, we stated that A MOVE was coming before then. It has happened almost to the T!!!
ETF

SOL - Longs on the Horizon!Hello TradingView Family / Fellow Traders. This is Richard, also known as theSignalyst.
📈 Medium-Term : SOL has been overall bearish and it is currently trading within the flat wedge pattern marked in red.
📍 As it retests the lower bound of the wedge — which perfectly intersects with the $100 round number — I’ll be looking for short-term longs.
🚀 In parallel, for the bulls to take over in the long term and kick off the next bullish phase, a breakout above the $147 previous daily high is needed.
Which scenario do you think will happen first — and why?
📚 Always follow your trading plan regarding entry, risk management, and trade management.
Good luck!
All Strategies Are Good; If Managed Properly!
~Rich

XRP/USDT:BUY LIMITHello friends
Due to the price drop, we have reached a good support area, which you can see is supported by good buyers.
Now we can buy in stages and with capital management in the specified areas and move to the specified targets.
Always buy in fear and sell in greed.
*Trade safely with us*

The Dump & Hold Strategy ($70.94 SOON?)URGENT INSIGHTS:
According to my charts, we're either heading into a crappy 20-year downturn... or a 11,000% increase to $70.94 upside depending on your position!
It is now simultaneously optimal to short while going long and/or sell pre-buy, unless of course you're bullish, in which case ensure your purchase precedes your liquidation, but only if your gains are already post-realized prior to any re-entry in either direction, but be sure to hedge.
JUST REMEMBER:
No matter how long the struggle, there’s always relief.
I'm not a financial advisor.

TRUMPHello friends
Due to the price drop, we reached a good support area where good buyers supported the price.
Now we can buy in steps and with capital management in the specified support areas and move to the specified targets.
Always buy in fear and sell in greed.
*Trade safely with us*

Flow Traders: A Deep Dive into a Volatility PlayFlow Traders has long been recognized as one of the leading market makers in Exchange Traded Products (ETPs), holding a dominant position in Europe and steadily expanding its global footprint. The firm’s success is driven by its technological prowess—its ultra-low latency trading systems and proprietary algorithms enable it to provide liquidity across thousands of listings. When compared with major competitors such as Virtu Financial, Citadel Securities, Jane Street, and Optiver, Flow Traders stands out for its high profit margins and robust returns during volatile periods. However, its earnings can swing dramatically: record profits during periods of market turbulence contrast with more compressed margins in quieter times.
Historically, Flow Traders followed a dividend policy with an intended payout ratio of at least 50% of net profits. In FY23, for example, the company paid a total dividend of €0.45 per share (an interim dividend of €0.30 per share plus a final dividend of €0.15 per share). However, in its recent 2Q24 results and AGM communications, Flow Traders announced a revised dividend policy that suspends regular dividend payments until further notice. The Board has made this decision to accelerate the expansion of its trading capital base—a move the management believes will deliver greater long-term value for shareholders through reinvestment in technology and market expansion rather than immediate income distribution.
Technologically, Flow Traders continues to push the boundaries by investing in co-located servers, low-latency networks, and even exploring cloud-based systems with microsecond-level synchronization. These initiatives ensure that the firm maintains a competitive edge, even as peers like Virtu and Citadel invest heavily in their own technological infrastructure. While Flow’s niche focus—especially in European ETF market making—provides a strong competitive moat, the firm is also expanding into fixed income and digital assets.
For valuation purposes, I used a blended approach incorporating a Discounted Cash Flow (DCF) model and industry comparables, augmented by a scenario analysis that reflects the inherent cyclicality of its earnings. In my model, three scenarios were considered over a five-year period. Under the best-case scenario, where global market volatility surges and Flow capitalizes on its technological advantages to boost market share, the five-year target price could reach around €80 per share. In a base-case scenario, reflecting a more normalized yet steadily growing trading environment, the target price might be closer to €40 per share. In the worst-case scenario—if markets remain persistently calm and competitive pressures intensify—the target could drop to about €15 per share.
Given the current market environment, the probabilities are 30% for the best-case, 60% for the base-case, and 10% for the worst-case. Additionally, the discount rate in the DCF 6%, reflecting today’s economic landscape risk premium. With these assumptions, discounting the future target prices at 6% yields present values of approximately €60, €30, and €11 for the best, base, and worst scenarios respectively. Weighting these figures accordingly results in an expected intrinsic value of around €37 per share today.
So, what does this mean for investors? At current trading levels in the mid-€20s, Flow Traders appears to be undervalued relative to its long-term potential. Although the firm is currently not paying dividends—opting instead to reinvest its profits to grow its trading capital—the strategic focus on reinvestment may unlock greater growth opportunities. In essence, Flow Traders represents an intriguing volatility play: it can generate outsized returns in turbulent times while offering a balanced risk/reward profile in more normalized markets.
Ultimately, Flow Traders’ strategic decision to suspend dividends underscores its commitment to long-term growth. Investors are essentially buying into the firm’s reinvestment strategy, which has historically delivered strong returns on trading capital. As market volatility and technological advancements continue to drive the industry, Flow Traders is well-positioned to capitalize on emerging opportunities and create shareholder value over the long run.
Speculation: With Trump’s tariffs continuing to rock global markets and trigger bouts of heightened volatility reminiscent of past trade wars, there’s reason to speculate that Flow Traders could find itself in a particularly advantageous position. As tariffs fuel uncertainty and market swings—further rattling investor confidence and prompting rapid shifts in liquidity—Flow Traders’ expertise in market making, especially in ETPs, could allow it to capture significant trading opportunities. The elevated volatility may widen bid-ask spreads and boost trading volumes, directly benefiting firms like Flow that thrive on rapid, high-frequency trades. While these are merely speculative thoughts, given the unpredictable nature of tariff-driven market disruptions, Flow’s focus on liquid, exchange-traded products might well make this turbulent period a silver lining for the company.

Post-Liberation Day Sell-Off – Crash or Correction?Liberation Day has turned into a dramatic "blow the markets back out" day for the SPY , with a significant daily drop of nearly 6%, slicing decisively below the critical 200-day moving average at $574.46. Historically, breaking below the 200-day MA is a strong bearish signal, indicating potential further downside momentum.
The previously identified key bearish pivot, the "Best Price Short" at $565.16, served as a crucial resistance level from which sellers aggressively stepped in, intensifying today's sell-off. Given the current bearish sentiment, the next immediate downside targets without a significant bounce (dead-cat bounce) include:
Half 1 Short (Momentum target): $505.28 (already tested)
High Vol Momentum Target 1a: $497.66
Half 2 Short (secondary bearish momentum): $486.41
Extended Momentum Target (HH Vol Momo Target 2a): $475.16
For traders who missed the initial move, look to re-enter shorts if there's a modest retracement toward the previously broken "Weeks High Short" at $520.16, maintaining tight risk control with stops ideally set just above the "Best Price Short" ($565.16).
Critical levels summary:
Ideal Short Re-entry Zone: $520.16
Profit Targets: $497.66, $486.41, and ultimate $475.16
Stop Loss Area: Slightly above $565.16
Major Broken Support (Resistance now): 200-day MA at $574.46
Today's significant volume spike further reinforces bearish conviction. RSI is deeply oversold at 23.24, suggesting caution for potential short-term bounce, but any bounce is likely to be short-lived unless there's a substantial political or economic pivot soon.
These levels are algorithmically defined, designed to remove emotions from trading. Trade responsibly, adhere to your strategy, and protect your capital.


DOGE/USDT:BUY...Hello dear friends
Given the price drop we had in the specified support range, considering the price growth indicates the entry of buyers.
Now, given the good support of buyers for the price, we can buy in steps with capital and risk management and move towards the specified goals.
*Trade safely with us*

What Is the Difference Between ETFs and Index Funds?What Is the Difference Between ETFs and Index Funds?
ETFs and index funds are designed to provide access to diversified portfolios of assets, often tracking the performance of a specific market index. But while they may appear similar at first glance, they have distinct characteristics that cater to different types of investors and strategies. This article breaks down the key differences between ETFs vs index funds, explores how they work, and explains why traders and investors might choose one over the other.
What Are ETFs?
Exchange-traded funds (ETFs) are investment vehicles that trade on stock exchanges, much like individual shares. They’re structured to replicate the performance of a particular benchmark, sector, commodity, or a combination of asset classes.
What sets ETFs apart is their flexibility. Traders and investors buy and sell ETFs throughout the trading day at market prices. This makes them particularly appealing to active traders who value liquidity and the ability to react quickly to price movements.
Another key advantage is their typically low cost. Most ETFs are passively managed, meaning they aim to replicate a benchmark rather than beat it. This reduces management fees, making ETFs a cost-effective choice compared to actively managed offerings.
ETFs also offer diversification in a single transaction. By trading one ETF, investors can gain exposure to hundreds or even thousands of underlying securities. This makes them a popular choice for spreading risk across multiple assets.
What Are Index Funds?
Index funds are investment vehicles designed to mirror the performance of a specific index, like the FTSE 100 or the S&P 500. An index fund provides broad exposure by holding a portfolio of assets that closely matches the composition of the benchmark it tracks. An index vehicle tracking the S&P 500 would invest in the 500 largest companies in the US, in the same proportions as the index. This passive strategy keeps costs low, as there’s no need for active management or frequent trading decisions.
So, how is an index fund different from an exchange-traded fund? The index fund can take the form of either an ETF or a mutual fund; for instance, the SPDR S&P 500 ETF, or SPY, is an index fund.
Mutual fund versions of index funds are traded at the end-of-day net asset value (NAV), while ETF versions are bought and sold throughout the trading day like individual shares. This distinction is important for traders considering factors like liquidity and pricing flexibility.
Low-cost index funds are popular for their relative simplicity compared to some other financial instruments, cost efficiency, and diversification. By investing in a single product, investors can gain exposure to an entire market, reducing the need for extensive research or active management.
Is an ETF an index fund? Not necessarily. An ETF can be an index fund if it tracks an index, but ETFs can also track different sectors, assets, or geographies without being one.
Differences Between ETFs and Index Funds
ETFs and index funds share a common purpose: to track the performance of an underlying benchmark. However, the debate of ETFs vs mutual funds vs index funds often comes down to trading mechanisms and investment strategies, which can influence their suitability for different types of traders and investors.
Trading Mechanism
One of the most noticeable differences between ETFs vs index funds is how they’re traded. ETFs trade on stock exchanges, allowing them to be bought and sold throughout the trading day at market prices. This means their value fluctuates based on demand, similar to individual shares. In contrast, mutual fund indices are priced and traded only once a day, at the net asset value (NAV) calculated after markets close.
Variety
ETFs encompass diverse assets like stocks, bonds, and commodities, covering sectors, regions, or mixed asset classes. Index funds, on the other hand, only track a specific market index, like the S&P 500, FTSE 100, or Nasdaq 100.
Cost Structure
Both ETFs and mutual fund indices are known for low fees, but there are nuances. ETFs typically have slightly lower expense ratios, as they incur fewer administrative costs. However, trading ETFs may involve brokerage fees or bid-ask spreads, which can add up for frequent traders. Mutual fund vehicles often require no trading fees but may impose a minimum investment amount.
Tax Efficiency
ETFs tend to be more tax-efficient than mutual fund indices. This is due to how they handle capital gains. ETFs generally use an “in-kind” redemption process, which minimises taxable events. Mutual fund index funds, on the other hand, may trigger taxable capital gains distributions, even if you haven’t sold your shares.
Liquidity and Accessibility
ETFs can be bought in small quantities, often for the price of a single share, making them more accessible to retail investors. Mutual fund vehicles may require higher minimum investments, which could limit access for some investors. Additionally, ETFs offer instant trade execution, while mutual vehicles require you to wait until the end of the trading day to complete transactions.
ETF CFD Trading
ETF CFD (Contract for Difference) trading is a versatile way to speculate on the price movements of ETFs without actually owning the underlying assets. When trading ETF CFDs, you’re entering into an agreement with a broker to exchange the price difference of an ETF between the time the position is opened and closed. Unlike traditional ETF investing, where you purchase shares on an exchange, CFD trading allows you to take positions on price movements—whether upwards or downwards.
Leverage and Lower Capital Requirements
One major advantage of ETF CFD trading is leverage. With CFDs, you only need to put down a fraction of the trade’s total value as margin, allowing you to control larger positions with less capital. However, leverage amplifies both potential gains and losses, so careful risk management is essential.
Potential Short-Term Opportunities
ETF CFDs add a layer of flexibility for traders exploring the difference between ETFs, mutual funds, and index funds by focusing on short-term speculation rather than long-term holding. Traders can react quickly to news, economic events, or trends without the constraints of traditional ETF investing, such as settlement times or the need to meet minimum investment requirements. Since ETF CFDs can be traded with intraday precision, they allow traders to capitalise on smaller price movements.
A Complement to Long-Term Investing
For those who already invest in traditional ETFs or indices, ETF CFD trading can serve as a complementary strategy. While long-term investments focus on gradual wealth-building, CFDs enable active traders to seize potential short-term opportunities, hedge against risks, or diversify their trading activities.
Flexibility Across Markets
With ETF CFDs, traders gain access to a wide range of markets, from equity indices to commodities and sectors. This diversity allows for tailored trading strategies that align with market conditions or specific interests, such as tech or energy ETFs.
Uses for ETFs and Index Funds
The differences between index funds and ETFs mean they play distinct but complementary roles in financial markets, offering tools for various investment and trading strategies. Whether focusing on long-term goals or seeking potential short-term opportunities, these products provide flexibility and diversification.
Portfolio Diversification
Both are popular for spreading risk across a broad range of assets. For example, instead of buying shares in individual companies, a single investment in an ETF tracking the S&P 500 provides exposure to hundreds of large US firms. This diversification may help reduce the impact of poor performance of any single asset.
Cost-Effective Market Exposure
Both types offer relatively low-cost access to markets. Passive management strategies mean lower fees compared to actively managed products, making them efficient choices for building portfolios or gaining exposure to specific sectors, regions, or asset classes.
Tactical Market Moves
ETFs, with their intraday trading capability, are particularly suited to tactical adjustments. For instance, a trader looking to quickly increase exposure to the tech sector might buy a technology-focused ETF, while potentially reducing risk by selling it as conditions change.
Long-Term Wealth Building
Index funds, particularly in their mutual fund format, are designed for patient investors. By tracking broad indices with minimal turnover, they offer a way to potentially accumulate wealth over time, making them popular instruments for retirement savings or other long-term objectives.
How to Choose Between Index Funds vs ETFs
Choosing between an index fund vs ETF depends on your trading style, investment goals, and how you plan to engage with the markets. While both offer relatively cost-effective access to diverse portfolios, your choice will hinge on a few key factors.
- Trading Flexibility: ETFs are popular among active traders looking for potential intraday opportunities. Their ability to trade throughout the day allows for precision and quick responses to market changes. Index funds, whether ETFs or mutual products, are usually chosen by long-term investors who are less concerned about daily price movements.
- Fees and Costs: While both options are low-cost, ETFs often have slightly lower expense ratios but may incur trading fees or bid-ask spreads. Mutual fund products typically skip trading fees but may have higher management costs or minimum investment requirements.
- Tax Considerations: ETFs often provide better tax efficiency due to their structure, particularly when compared to mutual fund indices. For investors concerned about capital gains distributions, this could be a deciding factor.
- Strategy: If you’re targeting specific themes, sectors, or commodities, ETFs that aren’t tied to an index can provide unique exposure. For broad, passive market tracking, index funds—whether ETFs or mutual funds—offer simplicity and consistency.
The Bottom Line
ETFs and index funds are powerful instruments for traders and investors, each with unique strengths suited to different strategies. Whether you’re focused on long-term growth or short-term price moves, understanding their differences is key. For those looking to trade ETFs with flexibility, ETF CFDs offer a dynamic option. Open an FXOpen account today to access a range of ETF CFDs and start exploring potential trading opportunities with competitive costs and four advanced trading platforms.
FAQ
What Is an Index Fund?
An index fund is an investment vehicle designed to replicate the performance of a specific market index, such as the S&P 500 or FTSE 100. It achieves this by holding the same securities as the index in similar proportions. These vehicles can be either mutual funds or ETFs, offering investors broad market exposure and low costs through passive management.
What Is the Difference Between an ETF and an Index Fund?
An ETF trades like a stock on an exchange throughout the day, with prices fluctuating based on market demand. They track various assets across different sectors, markets, and asset classes. Index funds track indices, like the S&P 500 or FTSE 100, and can be traded as an ETF or mutual fund.
What Is Better, an S&P 500 ETF or Mutual Fund?
The choice depends on your needs. ETFs offer intraday trading, lower fees, and no minimum investment, making them popular among those who look for flexibility. Mutual funds often waive trading costs and are chosen by long-term investors comfortable with end-of-day pricing.
Are ETFs as Safe as Index Funds?
ETFs and index funds carry similar risks since both track market performance. So-called safety depends on the underlying assets, overall conditions, and your investment strategy, not the type itself.
What Is the Difference Between a Mutual Fund and an Index Fund?
A mutual fund is a broad investment vehicle managed actively or passively, while an index fund is a type of mutual fund or ETF specifically designed to replicate an index.
What Are Index Funds vs Equity Funds?
Index funds are designed to track the performance of an index. Equity funds, on the other hand, focus on stocks and can be actively or passively managed. While all index funds are equity funds, not all equity funds track indices.
This article represents the opinion of the Companies operating under the FXOpen brand only. It is not to be construed as an offer, solicitation, or recommendation with respect to products and services provided by the Companies operating under the FXOpen brand, nor is it to be considered financial advice.

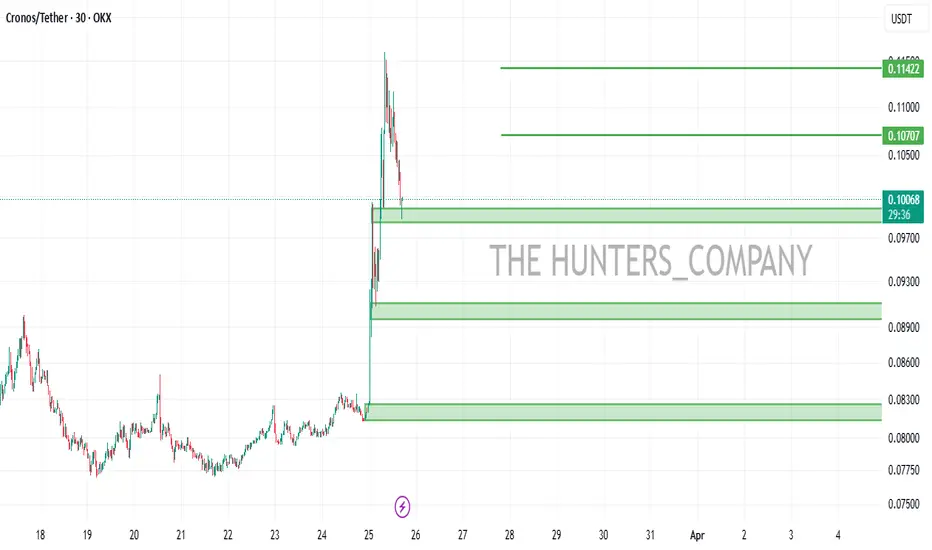
CRO/USDT : BUY LIMITHello friends
Given the good price growth, now in its correction, we can buy in steps with risk and capital management and move with it to the specified targets.
*Trade safely with us*
TRUMP/USDT:BUY LIMITHello friends
Given the price growth, now that the price is correcting, you can buy in steps and be careful to ensure that capital management is followed.
*Trade safely with us*

SPY Technical Outlook - Will Buyers Step In?AMEX:SPY is experiencing a corrective move after rejecting the upper boundary of the ascending channel. This rejection led to increased selling pressure, bringing price back to the lower boundary of the channel, where buyers may step in to defend the trendline support.
If the price holds at this dynamic support level, a bullish reaction could send AMEX:SPY toward the midline of the channel, with the next target around 607.00. Holding above this level would reinforce the bullish trend structure and increase the probability of continuation toward the upper boundary of the channel.
However, a breakdown below the trendline support would weaken the bullish outlook and open the door for further downside. Monitoring price action, volume, and confirmation signals will be crucial in determining the next move.

ETFs vs Mutual Funds: Differences and Advantages ETFs vs Mutual Funds: Differences and Advantages
Exchange-traded funds (ETFs) and mutual funds are two of the most popular investment options, each offering unique features and advantages. While both provide access to diversified portfolios, their differences in structure, management, and trading make them suitable for different strategies. This article breaks down the key distinctions between exchange-traded funds vs mutual funds and how to choose between them.
What Are ETFs?
Exchange-traded funds, or ETFs, are investment vehicles that allow traders to access a diverse range of assets through a single product. An ETF is essentially a basket of investments—such as stocks, bonds, or commodities—that typically tracks the performance of an index, sector, or specific theme. For example, SPDR S&P 500 ETF Trust (SPY) follows the S&P 500 index, providing exposure to the largest companies listed on US stock exchanges.
What sets ETFs apart is how they’re traded. Unlike mutual funds, which are only bought or sold at the end of the trading day, ETFs trade on stock exchanges throughout the day, just like individual shares. This means their prices fluctuate as demand and supply change, giving traders the flexibility to enter or exit positions at market prices.
ETFs are known for their cost-effectiveness, as most are passively managed to mirror the performance of an index rather than exceed it. This passive structure usually leads to lower management fees compared to actively managed funds. Additionally, ETFs are often transparent, with their holdings disclosed daily, so investors know exactly what they’re buying.
ETFs come in various types, from those focused on specific sectors, like technology or healthcare, to broader options covering entire economies or bond markets. This variety makes them a popular choice for traders and investors looking to diversify or target specific market opportunities.
What Are Mutual Funds?
Mutual funds are investment products that pool money from multiple investors to create a diversified portfolio, typically managed by a professional fund manager. These funds invest in a wide range of assets, including stocks, bonds, and other securities, depending on the fund’s objective. For instance, an equity mutual fund focuses on stocks, while a bond fund invests primarily in fixed-income securities.
One defining feature of mutual funds is their pricing. Unlike ETFs, mutual funds aren’t traded on stock exchanges. Instead, they are bought and sold at the fund’s net asset value (NAV), which is calculated at the end of each trading day. This makes them more suited to long-term investment strategies.
Mutual funds often appeal to investors looking for a hands-off approach. The fund manager handles the selection and management of assets, aiming to achieve the fund’s stated goals—whether that’s generating income, preserving capital, or achieving long-term growth.
However, this active management comes with higher fees compared to ETFs. These costs include management fees and sometimes additional charges like entry or exit loads, which can eat into returns over time.
Mutual funds also often require a minimum investment, making them less accessible for some investors. That said, they offer a wide variety of options, from sector-specific funds to diversified portfolios, providing flexibility for different investment goals and risk preferences.
Are There Differences Between an ETF and a Mutual Fund?
ETFs and mutual funds share similarities—they both allow investors to pool money into diversified portfolios. However, the differences between ETFs and mutual funds can significantly impact which one is better suited to an investor’s goals.
Trading and Pricing
ETFs are traded on stock exchanges continuously during market hours, similar to individual shares. Price fluctuations are based on market demand and supply. In contrast, mutual funds are priced only once per day after the market closes, based on the fund’s net asset value (NAV). This makes ETFs more appealing for those seeking flexibility and the ability to react to market movements, while mutual funds cater to long-term investors less concerned with intraday price changes.
Management Style
ETFs are mostly passively managed, designed to track the performance of a specific index, sector, or asset class. Mutual funds, on the other hand, often feature active management. This involves fund managers selecting assets to outperform the market, which can offer potential opportunities for higher returns but also comes with increased costs.
Fees and Costs
ETFs typically come with a lower expense ratio compared to mutual funds, making them more cost-efficient. This is due to their passive management approach and lower operational costs. Mutual funds may charge higher fees to cover active management and administrative expenses. Additionally, mutual funds may have extra costs like sales charges or redemption fees, whereas ETFs incur standard brokerage commissions.
Liquidity
When considering mutual funds versus ETFs, liquidity becomes a critical factor, as ETF prices change intraday, while mutual funds are limited to end-of-day pricing. This difference can influence how quickly you can access your funds.
Tax Efficiency
ETFs tend to be more tax-efficient because of their structure. When investors sell ETF shares, transactions occur directly between buyers and sellers on the exchange, limiting taxable events. In mutual funds, redemptions often require the fund manager to sell securities, which can result in capital gains distributed to all investors in the fund.
Minimum Investment
Mutual funds often require a minimum initial investment, which can range from a few hundred to thousands of dollars. ETFs, however, don’t have such requirements—traders can purchase as little as a single share, making them more accessible for those with smaller starting capital.
ETF CFD Trading
ETF CFD trading offers a flexible way for traders to speculate on the price movements of exchange-traded funds without the need to buy them on stock exchanges. CFDs, or Contracts for Difference, are derivative products that track the price of an ETF, allowing traders to take positions on whether the price will rise or fall. This approach is particularly appealing for short-term speculation, making it a useful complement to traditional long-term ETF or mutual fund investing.
Flexibility
One of the standout features of ETF CFDs is their flexibility. Unlike investing directly in ETFs, CFD trading enables you to capitalise on price fluctuations without owning ETF shares. Traders can go long if they anticipate a rise in the ETF’s value or short if they expect a decline. This ability to trade in both directions can potentially create opportunities in both bullish and bearish markets. Moreover, CFDs allow for trading over shorter timeframes like 1-minute or 5-minute charts, providing potential opportunities for scalpers and day traders.
Leverage
Leverage is another significant feature of ETF CFDs. With leverage, traders can gain larger exposure to an ETF’s price movements with smaller initial capital. For example, using 5:1 leverage, a $1,000 position would control $5,000 worth of ETF exposure. However, you should remember that while this magnifies potential returns, losses are also amplified, making risk management a critical component of trading CFD products.
Costs
Actively managed ETFs can charge expense ratios to cover management and operational costs. CFDs eliminate these fees, as traders don’t directly invest in the ETF’s assets. However, both ETF investing and ETF CFD trading include brokerage fees or spreads.
Wider Range of Markets
With CFDs, traders can access a variety of global ETF markets through a single platform. This reduces the need to open accounts in different jurisdictions, saving on administrative and currency conversion costs.
CFD trading is popular among traders who want to take advantage of short-term price movements, diversify their strategies, or access ETF markets straightforwardly. While traditional ETFs are often favoured for long-term growth, ETF CFDs provide an active, fast-paced alternative for traders looking to react quickly to market changes.
Use Cases for ETFs and Mutual Funds
In comparing ETFs vs mutual funds, it’s important to recognise their use cases based on an investor’s goals, strategies, and time horizons.
ETFs
ETFs are used by investors seeking flexibility and real-time market engagement. They are attractive for those who want to take advantage of price movements or actively manage their portfolios. For example, an investor might focus on sector-specific ETFs, like technology or energy, to capitalise on industry trends. ETFs also offer a lower-cost option for diversification, making them useful for those building broad exposure across markets without significant capital.
Additionally, ETFs may be effective for hedging. An investor with exposure to a specific market segment can use an ETF to potentially offset risks, especially in volatile markets. For instance, during an anticipated downturn in equities, an inverse ETF could be used to possibly mitigate losses.
Mutual Funds
Mutual funds are popular among long-term investors prioritising professional management. Their hands-off approach makes them appealing to individuals who prefer not to monitor markets daily. For instance, someone saving for retirement might opt for a diversified mutual fund that balances risk and growth over time.
Mutual funds are also advantageous for accessing specialised strategies, such as actively managed funds focusing on niche markets or themes. While they typically involve higher fees, the tailored management can align with specific financial objectives.
Factors for Choosing Between ETFs and Mutual Funds
Selecting between mutual funds vs ETF options depends on an investor’s financial goals, trading style, and the level of involvement they are comfortable with in managing their investments.
- Time Horizon: ETFs are popular among short- to medium-term investors and traders who prefer flexibility and the ability to follow intraday price movement. Mutual funds, on the other hand, are mostly used by long-term investors focused on gradual growth or income over time.
- Cost Sensitivity: ETFs generally have lower expense ratios and no minimum investment requirements, making them cost-efficient. Mutual funds often involve higher management fees and, in some cases, additional charges like entry or exit fees, which can add up over time.
- Active vs Passive Management: If you’re looking for a hands-off approach with professional oversight, actively managed mutual funds might be more appealing. However, if you prefer to track indices or specific sectors at a lower cost, ETFs might be more suitable.
- Liquidity Needs: Investors who need quick access to their capital often prefer ETFs because they can be traded throughout the day. Mutual funds lack this intraday liquidity, as transactions are only processed at the trading day’s end.
The Bottom Line
Understanding the differences between mutual funds vs exchange-traded funds is crucial for selecting the right investment approach. ETFs offer flexibility and cost-efficiency, while mutual funds are popular among long-term investors seeking professional management. For those interested in ETF CFD trading, which allows traders trade in rising and falling markets, opening an FXOpen account provides access to a diverse range of ETF markets alongside competitive trading conditions.
FAQ
What Is an ETF vs Mutual Fund?
An ETF is a fund traded on stock exchanges, offering intraday liquidity and lower fees, typically tracking an index or sector. A mutual fund pools investor money for professional management, priced once at the end of a trading day at its net asset value per share.
Mutual Funds and ETFs: Differences
ETFs trade like stocks, are generally more cost-efficient, and offer intraday liquidity. Mutual funds are actively managed, have higher fees, and are designed for long-term investing with end-of-day pricing.
Is the S&P 500 an ETF or a Mutual Fund?
The S&P 500 itself is an index, not a fund. However, it can be tracked by both ETFs (like SPDR S&P 500 ETF) and mutual funds, offering similar exposure but with differing management styles and fee structures.
This article represents the opinion of the Companies operating under the FXOpen brand only. It is not to be construed as an offer, solicitation, or recommendation with respect to products and services provided by the Companies operating under the FXOpen brand, nor is it to be considered financial advice.

AVAX/USDTHello friends
As you can see, the price has been well supported by buyers from the specified support area...
Now you can buy in steps with capital and risk management and move to the specified targets.
The red resistance area can also cause a price correction, so be careful and take profit.
*Trade safely with us*

BNB/USDT:BUY LIMITHello friends
You can see that after the price fell, buyers entered the specified support area and supported the price and created higher ceilings and floors.
Now we can buy at the specified levels with capital and risk management and move to the specified targets.
*Trade safely with us*

PEPE/USDT:BUY LIMITHi friends
You can see that after the price fell in the specified support area, buyers came in and supported the price and created higher ceilings and floors.
Now we can buy at the specified levels with capital and risk management and move with it to the specified targets.
*Trade safely with us*

TRUMP(UPDATE)Hello friends
Given the good price growth, now in the pullbacks that the price makes, we can buy in the specified support areas and move with it to the specified targets.
Of course, with capital and risk management...
*Trade safely with us*

Pi Network Bounce... The Pi Network's price has been experiencing significant fluctuations recently. After a sharp drop of over 20%, the price fell below $0.90, with resistance levels identified at $1.20 and $1.50-$1.80. If the price breaks below $0.80, it could decline further to $0.60.
However , some experts suggest that the Pi Network could rally back to $3, citing factors like potential exchange listings, merchant partnerships, and ecosystem advancements. The introduction of Pi-based domains and growing adoption might also contribute to its recovery.
The market sentiment remains mixed, with concerns about delays in the mainnet launch and exchange listings. If you're following Pi Network closely, it might be worth keeping an eye on these developments.
And one more thing, If Pi network will enter the ETF market...
If Pi Network were to enter the ETF market, it could potentially boost its price and credibility significantly. Analysts suggest that an ETF approval by the SEC could lead to increased inflows and validate Pi Network as a legitimate cryptocurrency. This move might also quell concerns about its legitimacy, as ETFs often attract institutional investors.
Pi Network's large market cap and liquidity make it a strong candidate for ETF consideration. However, no application for a Pi ETF has been made yet. If approved, it could lead to a surge in Pi's price, with some predictions suggesting it might even reach $100 in the long term.

XRP/USDT:BEST CHANCEhello friends
Due to the price correction, now is a good opportunity to buy in steps.
Note that the best way to buy a ladder is to not suffer a loss if the price changes.
We have specified price targets for you.
We have also specified an important resistance range for you, when the price reaches it, we will give you an update.
*Trade safely with us*

XRP...Hello friends
Given the good growth we had, we now have the opportunity to buy in the pullback...
You can buy in steps within the limits we have specified for you with capital management...
*Trade safely with us*

WIF/USDTHello friends
According to the market cycle, the price decline is ongoing and is expected to continue.
Now the only important support is the green area, which the price reaches there and we will see what reaction we get from the buyers.
Will they support the price or will the decline continue...
If you want to be with us in this alt season, send us a message.
*Trade safely with us*

SPY STRONG BREAKOUT|SHORT|
✅SPY made a bearish breakout
Of the key horizontal level
Of 568.00$ which is now
A resistance and the breakout
Is confirmed so we are bearish
Biased and we will be expecting
A further bearish move down
SHORT🔥
✅Like and subscribe to never miss a new idea!✅
