SPY opening close to flat. Intraday and weekly areas of interestThe spy is in a down trend on the weekly, and close to making new lows for the year. Looking to see if the previous support zone holds or if we break lower. Intraday levels of trade interest for me are in the video as well as weekly chart targets if price breaks lower.
ETF

S&P500 Local Long! Buy!
Hello,Traders!
S&P500 went down to retest
The horizontal support level
And despite my mid-term bearish bias
I think a local rebound is possible
Buy!
Like, comment and subscribe to boost your trading!
See other ideas below too!

SPY etf S&P 500 Price per Earnings still high: 18.66 ! If you haven`t bought puts ahead of the FOMC meeting:
Then you should know that the P/E Ratio of the S&P 500 even after last Friday's sell-off is 18.66.
Now considering that the median value is 14.90, i would say that a fair price for the S&P would the the pre-pandemic level of $3380, and respectively, for its etf SPY, $338.
We might see a technical bounce here, due to the fact that the S&P is oversold and usually at this level is a buy opportunity, but short lived, to the next resistance of $374.
Two months have delivered an average negative return for stocks since 1945: February and September, the latter being the worst.
Looking forward to read your opinion about it.

Gold (XAD1) ETF Trade UpdatesBuy when others are afraid ... Warren Buffett said.
I have always followed this phrase and have almost always had region, but I dare to say ALWAYS, speaking of ETFs and long-term portfolios.
We are in a year that will be remembered, certainly the first 6 worst months since the 70s.
I've been accumulating on all my ETFs since early January 2022 and I am sure the market will agree with me.
Now, let's talk about gold, because, unlike the other ETFs that I manage both actively and passively, I manage it ONLY in an active way, knowing its dynamics very well, as I do with oil.
We arrived on very important volumetric support, so on Friday, I went to buy on the ETF that replicates the futures, at 105.26.
The possible landing in area 100-101 marks the second entry level and, for those who do short-term trading, the target I recommend is 115.
The completely anomalous trend of this "refuge" asset continues, which from 2020 instead seems to follow the market.
This may be related to the bond trend, which is making a lot of money recently.
Anyway, I think the current prices are quite interesting, we are more than -20% from the highs.
I will not rebalance my portfolio percentage before I land on all-time highs.
Happy trading
Lazy Bull

SPY 9/11/22 Analysis Update (Part 3)SPY has finally arrived to the June 17th, 2022 lows to form that double bottom (Yellow Circle). At the close of day on 9/23/22, SPY formed a hammer candle on the daily timeframe right atop the demand zone . On the weekly, SPY hovers closely above the 200 day moving average. Also, I have noticed that SPY has a MACD crossunder on the weekly timeframe . In contrast, there is a possible bullish divergence forming on the weekly timeframe .
As far as Elliott Wave goes, we may have just completed wave 1 of Wave C of the overall (ABC) corrective wave that began at the beginning of the year.
As stated, this is a HHUUUGGEEE level to watch. With Friday, 9/23/22 closing with a hammer candle, I am watching for a bounce here to begin corrective wave 2 within Wave C of the overall (ABC) corrective wave that began at the beginning of the year.
Let's see what happens :)

SPX S&P500 The Bigger PictureThe FED Meeting on September 20-21 is expected to deliver 75bps hike.
The decision will be announced on September 21.
Some key data to consider:
The annual inflation rate in the US eased for a second straight month to 8.3% in August of 2022, from 8.5% in July, but above market forecasts of 8.1%.
Inflation rose for food (11.4%, the most since 1979), shelter (6.2%, the most since 1984), and used cars and trucks (7.8%).
Core CPI increased 6.3% on a year, the most since March, and up markedly from 5.9% hit in both June and July.
So there is a change to see even an 100bps hike next week!
Under those circumstances, the economic hurricane coming our way that Jamie Dimon was preaching, could become reality:
If we look at the S&P chart, we can easily presume a retracement to the $3714 support line, followed by, worst case scenario, a drop to $3100 if we are going to see more earnings revisions, like FDX did this week.
Looking forward to read your opinion about it.

GLD: Warm-up 👟GLD is warming up in the lower magenta-colored zone between $152.85 and $159.20, where it still has some room left to finish wave iii in magenta. Afterwards, it should jump up into the upper magenta-colored zone between $163.39 and $171.23 to complete wave iv in magenta, before sliding into the yellow zone between $150.72 and $140.40, where the overarching downwards movement should end. There is a 40% chance, though, that GLD could decide to rise earlier already and thus could directly climb above the resistance at $171.23.

STXRES Satrix Resources. Bear flag ? Satrix resource ETF is currently trading in a channel, but after a rejection at the SMMA 40 this could end up becoming a bear flag channel.
Watch out for a possible break of this channel.
Target area if this flag breaks is 5123-4736
Watching. No position.

SPY S&P 500 etf Head and Shoulders Chart PatternThe Head and Shoulders Bearish Chart Pattern on the SPY etf S&P 500 is more obvious on the 4h timeframe, that`s why i picked that and not the daily.
My Price Target for this week is $374, followed by a bounce from the support and oversold level that will be bought fast, a return to $385 and then a pullback to $362 where it will form a double bottom.
Looking forward to read your opinion about it.

GDXJ: Shilly-shally…GDXJ is still hesitant to finally complete wave ii in magenta and is turning downwards again. As it can, of course, use the whole magenta colored zone between $37.26 and $24.77 to finish the overarching downwards movement, we give the ETF some more time to get its work done. However, as soon as wave ii in magenta is through, GDXJ should veer to the north, crossing the resistance at $36.58 and heading for the next at $51.92 from there. A 40% chance remains, though, that GDXJ could break through the magenta colored zone and drop below the support at $19.52, thus triggering further descent.

TAN Solar Etf Breakout readyTAN Solar Etf Breakout ready. Since market is better perhaps we will see a nice breakout. Solar is Leading market group.

LABU 3X LEVERAGED BIOTECH ETF on support for LONGAMEX:LABU
LABU a 3x leveraged EFT in the biotechnology sector has diverse holdings.
My thesis is that biotechnology and healthcare are relatively unhinged from the broader general market.
On this 15 minute chart, consolidation at support is seen in July, Price then rapidly rose
into a triple top in mid-August followed by a descent into a double bottom at the support level.
This is a leveraged ETF with good volatility which can be traded.
The volume profile of July through mid-August sets a POC as 8,65. This is the best support level
within the zone. In the same fashion the volume profile of mid-August through the present sets
a POC at 12.45 which is the bottom of the resistance zone. The spread is approximately 40% upside
over perhaps two weeks of the expectant uptrend.
The zero-lag SMA / EMA oscillator is showing green at its most recent print with an uptrend noted.
I will take a trade in a call option with a strike 20 % higher than current price
given the potential immediate upside of 40%. I will select an expiration in 4-6 weeks and hope
for a 100-200% return.

Real Estate ETF ShortVanguard Real Estate ETF Head and Shoulders target hit on the DTF .
I can see a similarities on the WTF and MTF that could play out and It could happen anytime up until 2024-2025.
We are also in a ABC Corrective Wave and housing prices are becoming unaffordable for most of the population due to rising INFLATION.

Vanguard Real Estate ETFPeople say how do you short the Housing Market Bubble?
I say look at this VG Real Estate ETF.
Head and Shoulders Target hit on the DTF.
I can see a pattern on the WTF and MTF that could play out and cause a massive market crash.
History repeats itself and we have a system that is built on debt and getting worse.
Can you see the patterns on the HTF?
Safe Trading.

SPY S&P 500 September is historically the worst month for stocksTwo months have delivered an average negative return for stocks since 1945: February and September, the latter being the worst.
Economic context:
Russia will not restart gas supplies to Europe through a key pipeline until western sanctions are lifted.
OPEC+ unexpectedly decided to cut output in October by 100,000 barrels a day.
August 2022 CPI data are scheduled to be released on September 13, 2022.
Fed’s next scheduled monetary policy meeting takes place on September 20-21. Depending on how inflation is trending and how the jobs markets and overall economy is looking we expect a Fed Rate Decisions of 50bps or 75bps hike.
The crypto market context is not good either. Ethereum network’s security and performance could be negatively impacted by the upcoming Merge.
Taking into consideration the information above, my price target for the SPY ETF is $374.
Looking forward to read your opinion about it.

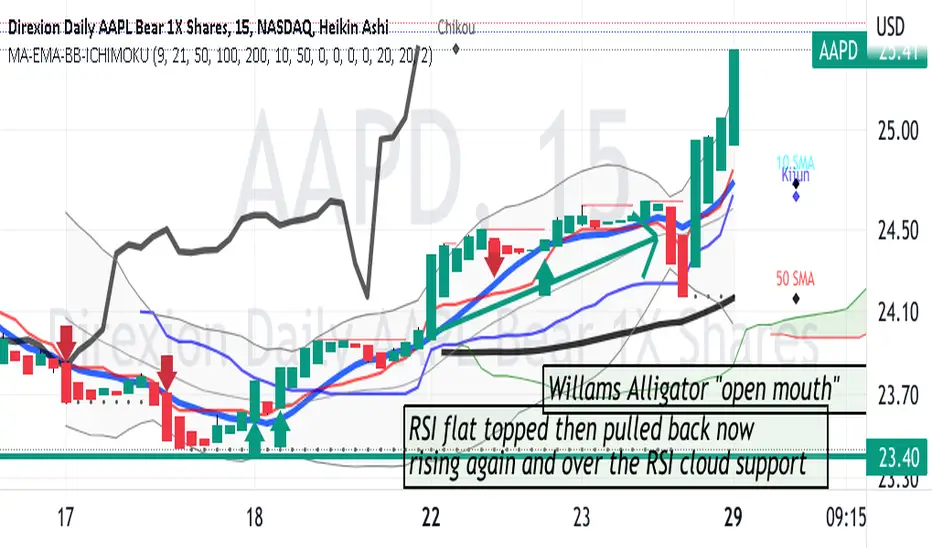
AAPD- an ETF to SHORT AAPLAAPD is now breaking out above the Ichimotu Cloud
providing a good entry for a long position in this bear
ETF inversing the price action of APPL/
$SPY make it or break itLet's see, a big decision time for SPY. Small bounce is plausible. Looks ugly.

Sygnia 4IR JSE:SYG4IR is struggling to break above the resistance level. The ETF itself can be shorted, but I prefer to short the underlying companies; more liquid than the ETF.

China A50 Index - STRONG BUYHi Guys,
2823.hk which is the A shares ETF of China listed in Hong Kong is currently at a major support which it has been holding since 2016.
Also, it tested its 0.8 fib, broke previous high and now retraced back to 0.8 of the smaller wave. Classic PA.
I am bullish on China A Shares and believe that price target should be north of $18.
Buy at 14.84.

SPX500- SPY ETF trading ideaHi Traders,
Market been bearish from Friday but we might see some reversal from here if SPY hold up 400 level.
SPY has tested 0.786 Fib level yesterday. Future running green at this stage, Market might gap up when open. watch out 400 level if market hold 400 level it can go up 404-405 level.
SPY just sitting at 50 SMA

BTC USD 1137 Final Target Hello Traders I have studies BTC for while and i remember my self saying from 2020 December Price will fail , BTC has Respected all Market structure and now we are in pre final fall 1rst target around 9960 then price will react and behing left FAIR VALUE GAP or FVG value of interest arount 35k price willBounce and Media will react news anywhere when touchet 35k they will sell again from new LL remmeber 35 expetced to be LH and price will break LL previews 9960 then price will colapse to 1337 for Final Destination , good luck new world , GSNARKS1

Vietnam ETFSouth East Asia Emerging market :Vietnam
Sign of uptrend holding
-Candlesticks moving above MA200. Challenged MA200 and continue moving above it (circled)
-Uptrend Line B 1:1 Fib extension of uptrend line A, similar magnitude within a shorter period of time(represented b the dotted line)
-Retracement R1 which from Higher Low (HL) : Retrace 0.618 fib of Line A.
-Retracement R2 which from Higher low (HL2): retrace 0.5fib of line B
-Challenging the ichimoku cloud soon
volume indicator fail to provide much information

SPX500- SPY ETF trading idea -day tradeHi Traders,
BIG sell off on Friday and future is also trading negative.
50 SMA support and FIB 0.786 level. Watch out 400 level
