CLOU - ETF FOR THE FUTUREAfter the big drop in tech stocks in recent months, this etf, that follows cloud companies, is a very good investment option for those who look to the future...
ETF

STAY LONGChinese stocks have been under a lot of pressure lately. This etf offers an opportunity for contrarian-investment by investing in China's largest stocks. These stocks are at oversold levels....

$STXFIN Satrix Fin. Ominous looking head and shoulders The fund invests in the 15 largest financial companies listed on the JSE, ranked by investable market cap.
Head and shoulders formed with the right should on top op the 200 day moving average support line
A break of this support could see a price target of 1239. A long way down.

Winter is Coming - Long UNLAs this terrible war grinds on, Europe and Asia are getting ready for winter by restocking inventories in the face of a supply squeeze caused by EU and US sanctions. Years of under investment in the sector due to political/ESG concerns combined with the sector's past corporate mismanagement making investors doubly wary has led to insufficient infrastructure in place to meet demand. Given the recent pullback from the recent highs and a positive testing of support, I feel now is the time to enter a position at this level with a timeframe of 9-10 months for my thesis to play out.
UNL is the vehicle to express my trade thesis because it avoids the risks of contango by using a 3 expiry framework instead of simple following the most current NG contract which can create contango risk at rollover.
Entry: $23.32 This is the avg of 3 tranches spread out from the $22.50 - 26.50 price levels. Today's price puke back down to support at $22.65 was the last fill. I am a swing trader and will be allowing this to run until spring. I will be selling covered calls throughout. I want to let this fish run with the line, so I may or may not sell parts of the position at major price levels. We are in market conditions where the price may not have much of an upper bound until demand eases in the spring.
I will update as this trade develops.
Good luck and god speed.

Oil and Gas at it again $FTXNThis ETF is the one a chose to play the new trend. I made a good profit from it and today is signaling another pivot buy. With today's breakout out of an ascending triangle the price may be posed to continue its trend up.
I'd be very cautios and start with small positions or go with a full position but taking profits quicker.
Remember to always use STOPS!

WEAT ETV To Play The Future Price of WheatWEAT's price, an ETV which trades wheat futures, is positioned to keep increasing as the horrible war in Ukraine rages on.
I accumulated this back at the $6.5 - $7 price level as a response to the decrease in fertilizer (thank you China for hoarding and mismanaging) and increases in crop disruption due to climate change related disasters. As you can see, it was chugging along nicely within the channel I drew back in Sept. I was expecting the continuation of nice returns as I've been playing the top and bottom of the channel. I had no idea that the #1 and #5 producers of wheat would go to war before spring planting and now we can expect the price of wheat and wheat futures to sky rocket. There is supply side destruction for at least one year that is being priced in right now but the decrease in fertilizer and climate disruption effecting the rest of the producers has not. Where the market hasn't yet priced something in, there is profit to be made.
Wheat and thus WEAT's price has open skies once it breaks through the $12.65 level and the broader cup, of the cup and handle formation it has been forming for years, will be put in at $24.65, then down to put in the handle, reset and then put in a big impulsive wave up.

QQQ Volatility 02 June 2022 QQQ Volatility 02 June 2022
The current percentile of QQQ is around 72.22%.
The current implied volatility is around 33.01 -> which translates into a daily movement of 2.08%
At the same time, this translates in an aproximate +-6.5$ movement
For this we can assume close to 85-90% probability of efficiency based on the last years data.
Based on this our channel for today is going to be, assuming the opening price is 306
TOP 306 + 6.5 ~= 312.5
BOT 306 - 6.5 ~= 299.5
This strategy is perfectly suited for an iron condor
At the same for those that are looking for entry points in case they want to go long call/put or a reverse iron condor,
instead of normal iron condor we can make use of next data:
Based on the last years, we can expect that the asset is going to move more than 0.53% which translates into a +- 1.6$ movements.
And this comes with a 75-80% probability based on the last years.
TOP 306 + 1.6 ~= 307.6 => as an entry point for long where we can use the opening price as a stop loss
BOT 306 - 1.6 ~= 304.4 => as an entry point for short where we can use the opening price as a stop loss

SPY Volatility 02 June 2022 SPY Volatility 02 June 2022
The current percentile of SPY is around 68.25%.
The current implied volatility is around 26.05 -> which translates into a daily movement of 1.64%
At the same time, this translates in an aproximate +-7$ movement
For this we can assume close to 90% probability of efficiency based on the last years data.
Based on this our channel for today is going to be, assuming the opening price is 410
TOP 410 + 7 ~= 417
BOT 410 - 7 ~= 403
This strategy is perfectly suited for an iron condor
At the same for those that are looking for entry points in case they want to go long call/put or a reverse iron condor,
instead of normal iron condor we can make use of next data:
Based on the last years, we can expect that the asset is going to move more than 0.43% which translates into a +- 2$ movements.
And this comes with a 70-80% probability based on the last years.
TOP 410 + 2 ~= 412 => as an entry point for long where we can use the opening price as a stop loss
BOT 410 - 2 ~= 408 => as an entry point for short where we can use the opening price as a stop loss

$DRV PTs 56-100 and higher 3X Bear Real Estate ETFThe fund invests in swap agreements, futures contracts, short positions or other financial instruments that, in combination, provide inverse or short leveraged exposure to the index equal to at least 80% of its net assets (plus borrowing for investment purposes). The index is provided by S&P Dow Jones Indices (the “index provider”) and includes securities of companies from the following industries: real estate management and development and REITs, excluding mortgage REITs. The fund is non-diversified.

Nice trade idea for SOXX! Semiconductor companies offer a lot of highly liquid securities that encourage risk-taking in all time frames, from intraday scalping to monthly market timing. The sector also supports various profit strategies, including momentum trading, basket allocations and short selling. It acts independently in many market phases, going its own way while major indices push higher or lower. This divergent behavior brings additional opportunities, even in difficult macro conditions. There are many ways to trade the semiconductor space, from identifying particular stocks to investing in the sector as a whole using exchange-traded funds (ETFs).

Daily US Volatility Forecast 25 May 22 SPY,SPX, QQQ, NDXSPX/ES/SPY 26 May 2022
The current volatility is expected with close to 85% chance to be below 1.85%
In this case, our channel for today is going to be
TOP 4045
BOT 3900
From fundamental point of view, today we are going to have US GDP release, which it may affect with a high probability
the price of this asset
Since the expected GDP is going to be negative/bearish compared to the previous values, I believe once we are close to 30k
we can enter in a short trade before the release of the data.
--------------------------------------------------------------------------------------------------------------------
NDX/NQ/QQQ 26 May 2022
The current volatility is expected with close to 85% chance to be below 2.28%
In this case, our channel for today is going to be
TOP 12150
BOT 11600
From fundamental point of view, today we are going to have US GDP release, which it may affect with a high probability
the price of this asset
Since the expected GDP is going to be negative/bearish compared to the previous values, I believe once we are close to 30k
we can enter in a short trade before the release of the data.
--------------------------------------------------------------------------------------------------------------------

$QQQ the ETF based on Nasdaq is creating a Bullish Hammer The popular QQQ ETF based on Nasdaq Top 100 shares is creating a Bullish Hammer in the chart. The ETF is almost at 52 Wk Low and much away from 50EMA. So, this could possibly be a swing trade opportunity if it reverses from here.
However, the market in general is still bearish and the fear is that, it would remain so for the next few weeks if not months.

QQQ will be going down up to 337$QQQ, please note like by following RSI and Stoch max values were quite good points for taking profit.

Stocks To Watch This WeekThe best setups this week. Etf edition. There are no certainties in the stock market. These names have shown good relative strength . This is an ETF based weekly charts that is designed to make money. This system is perfect for the person who works full time and still wants to follow trend and outperform the market.

Bear market?Bear market? Yes, an increasingly similar 2022, even worse, to 2018. This is already what we are experiencing on the financial markets.
Hard times for long traders, for swing traders, while golden opportunities for day traders, for those who know how to take advantage of moments of volatility. Volatility that hasn't been seen in a while, especially on the S&P500.
As for me, having a very very strict risk management, for swing or day trading operations, I prefer to focus on the long-term portfolio, accumulating and rebalancing my ETF portfolio which is my real "safe haven" in difficult times.
It is during the downturn that stocks pass from the hands of traders to those of investors. One of the most truthful phrases I've ever heard since doing this job.
Returning to trading, the expectation for June 15-16 is felt by the market; uncertainty has never brought anything good, paradoxically a further .50 point hike from the FED but with falling inflation it would be welcomed by the market. The level of inflation is the most important thermometer, and it has reached such high levels that it bothered some analysts to remember the Volcker maneuver.
I don't think so and I hope it will go that far. What is certain is that the Fed has waited too long to raise rates and international tension and the consequent increase in commodities has aggravated the situation.
It is no coincidence that the oil trade and my commodity ETF are the two biggest gains this year as far as I'm concerned.
I close by summarizing my recent activities:
Purchase (accumulation) on Apple (AAPL) close May 19
MSCI World ETF purchase (accumulation) 19 May close
Buy (accumulate) emerging markets ETFs May 19th close
Happy trading
Lazy bull
DISCLAIMER: I am not a financial advisor. These posts, videos, and any other contents are for educational and entertainment purposes only. Investing of any kind involves risk. While it is possible to minimize risk, your investments are solely your responsibility. It is imperative that you conduct your own research. I am merely sharing my opinion with no guarantee of gains or losses on investments.

$XOP Smells like distributionXOP to me needs to cool off after this monster up leg. Starting to smell like distribution with lower highs. A monster breakout is possible, but even being bullish I'd like a dip to $120 zone before the next up leg.
Daily - seeing some bearish divergence on the RSI
Weekly - top of channel rejection (so far) with Bearish MACD cross and momo turning down
Monthly - we're at the 2015 resistance line and an RSI approaching over bought territory
4HR - bearish divergence in MOMO and lower highs with MA turning down
I'm just not a buyer here, started a short position will add upon further confirmation JUN 130P
Cheers !

Volatility 19 May 22 S&P500 and Nasdaq Index and ETF's ES SP500 Future 19 May 2022
Based on the HV measures from the last year candles our expected volatility for today is around 1.97%
However, in order to increase our accuracy I am going to use a 1.25x multiplier => 2.46%
This is translated into a movement from the current opening point of 95.32
With this information our top and bottom , with close to 84% probability for today are going to be
TOP 4013
BOT 3820
SPY 19 May 2022
Based on the HV measures from the last year candles our expected volatility for today is around 1.68%
However, in order to increase our accuracy I am going to use a 1.25x multiplier => 2.11%
This is translated into a movement from the current opening point of 6.6
With this information our top and bottom , with close to 88% probability for today are going to be
The calculations are in general made with the open daily candle. Since we dont have one currently, you can wait for the open candle
and add or rest 6.6 points to that in order to get the top/bottom channel
SPY SP500 ETF 19 May 2022
Based on the HV measures from the last year candles our expected volatility for today is around 1.68%
However, in order to increase our accuracy I am going to use a 1.25x multiplier => 2.11%
This is translated into a movement from the current opening point of 82.61
With this information our top and bottom , with close to 86% probability for today are going to be
The calculations are in general made with the open daily candle. Since we dont have one currently, you can wait for the open candle
and add or rest 82.61 points to that in order to get the top/bottom channel
QQQ Nasdaq ETF 19 May 2022
The current 2022 Volatility for NDX/NQ/QQQ is much higher and abnormal than the previous years.
For that as a precation I am going to take the initial base as a 1.25x multiplier .
Based on the HV measures from the last year candles our expected volatility for today is around 2.67%
However, in order to increase our accuracy I am going to use a 1.5x multiplier => 3.2%
This is translated into a movement from the current opening point of 9.32
With this information our top and bottom , with close to 90.5% probability for today are going to be
The calculations are in general made with the open daily candle. Since we dont have one currently, you can wait for the open candle
and add or rest 9.32 points to that in order to get the top/bottom channel
NQ Nasdaq Future 19 May 2022
The current 2022 Volatility for NDX/NQ/QQQ is much higher and abnormal than the previous years.
For that as a precation I am going to take the initial base as a 1.25x multiplier .
Based on the HV measures from the last year candles our expected volatility for today is around 2.67%
However, in order to increase our accuracy I am going to use a 1.5x multiplier => 3.2%
This is translated into a movement from the current opening point of 376.75
With this information our top and bottom , with close to 88.5% probability for today are going to be
TOP 12288
BOT 12224

GDXJ: Testing the watersAfter jumping down from its last high at the lower edge of the blue zone between $51.27 and $62.63, GDXJ has fallen below the mark at $36.58 to test the waters of the magenta zone between $37.26 and $24.77. We expect it to gather more downward pressure to advance deeper into the magenta zone, where it should finish wave ii in magenta. Then, the ETF should turn around and climb back above $36.58. From there, it should continue the ascent towards the resistance at $51.92. However, there is a 30% chance that GDXJ could break through the magenta zone and subsequently drop below the support at $19.52 instead.

Iron Condor SPY 18 May 2022SPY 18 May 2022
The current expected volatility is around 1.71%
Based on a 85.3% chance, our asset is going to be compressed within the channel made from:
TOP 415
BOT 401
At the same time yesterday, we had Jerome Powell on a hawkish attitude, so we can expect another bear rally in the near future.
Based on all of this, at this very moment we can try as usual with index/etf/stocks an iron condor with
415 418 Call
401 398 Put

$SYG4IR Hoping for some strengthHoping to see a test of at least the top of this down channel @ around the 4000 level. My view is that this could possibly be reached if we see further strength in this bear market rally and the USDZAR plays along. I have a position. Be nimble. Don't fall in love with the upside.

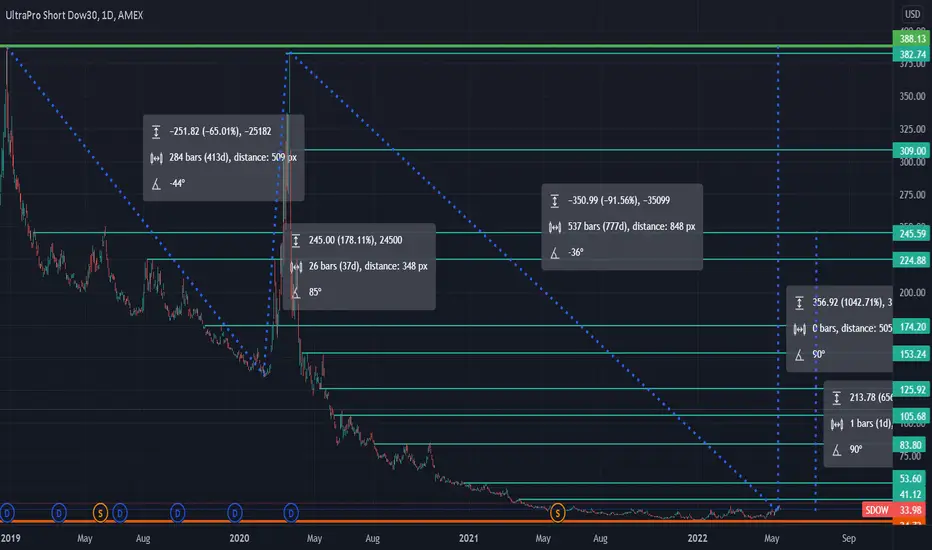
ProShares UltraPro Short Dow 30 ETF Is The US market crash ?Is The US market crash coming ?
We have 3 types of “crashes”
Correction <15% downward movement in a major indicy
Bear Market <20% downward movement in a major indicy
Black Swan event, something very unexpected that tanks the market, think 1987, 1929, challenger disaster, 911 and so on.
The fourth type is the 1919, 1929, 1999 and 2008 scenario that people generally refer to as a “crash” 2022 a new one ?
Sincereley L.E.D
In Spain 14/05/2022
Iron Condor XLE 13 May 2022XLE 13 May 2022
The current implied volatility is at 36.3%/year
So that converted into daily is 2.3%
Since we are in need of the open price for the highest accuracy, I am going to take the current price
which is 79.3(you can also wait for the opening price and take +- 1.8 points from the open candle value)
So based on that our channel for today is going to be compressed with a probability chance of 85% within
TOP 81.1
BOT 77.5
From fundamental point, today we have no big volatility news that can impact our asset.
At the same time the current values are expected to be sidemarket/bullish.
At the same the weekly expected channel top and bot values for DIA were
TOP 335
BOT 314

Reaching last 2017 peak VS 2020 Halving0. The above chart was made in view of the possibility that the four-year cycles of BTC is likely to change to three-year when BTC reaches the 2017 peak before 2020 Halving. If you look at the main chart, you can easily understand. Therefore, the explanation is omitted. This article is not for sell or buy. If you liked this idea, please, 'Thumbs up', 'Follow', 'Comment'~^^
< 2014 ~ 2017 > F1( 11488% ), A1( 87% ), B1( 43% ), C1( 54% ), D1( 66% ), E1( 1606% )
< 2018 ~ 2020 > F2( 2430% / 10359% ), A2( 71% ), B2( 38% ), C2( 57% ), D2( 69% ), E2( 305% / 1580% )
1. the comparison of indicator : 50MA, 100MA, 200MA
2. Current Coin Market Status
- Coin Market Cap : $ 325 Billion
- Bitcoin Dominance : 62.2%
- Volume by National Currencies : USD( 74.8% ), JPY( 14.7.0% ), KRW( 5.8% )
3. The Comparison of Coin Market Cap
- Coin Market Cap : $ 325 billion
- Stock Market Cap around the world : $ 50 trillion / 0.68%
- Korean Stock Market Cap : $ 1760 billion / about 18.5%
- Samsung Electronics Cap : $ 230 billoion < Coin Market Cap
4. Futures Expiration date
- CME : On the last Friday of every month at 4 pm
- CB0E : X
5. Korean Premium
- BTC(3.5%), ETH(3.5%), XRP(3.5%), *** GTO(28.0%), STORM(7.5%), GNT(5.5%)
6. Other Long-Term BTC Forecasts
- A similarity with the 2015 bottom &Influence of halving
- The rising curve by pattern
- A similarity with the 2015 double bottom
