WIF/USDTHello friends
According to the market cycle, the price decline is ongoing and is expected to continue.
Now the only important support is the green area, which the price reaches there and we will see what reaction we get from the buyers.
Will they support the price or will the decline continue...
If you want to be with us in this alt season, send us a message.
*Trade safely with us*
ETF

SPY STRONG BREAKOUT|SHORT|
✅SPY made a bearish breakout
Of the key horizontal level
Of 568.00$ which is now
A resistance and the breakout
Is confirmed so we are bearish
Biased and we will be expecting
A further bearish move down
SHORT🔥
✅Like and subscribe to never miss a new idea!✅

SPY S&P 500 etf Oversold on the RSI ! 2025 Price Target ! The SPDR S&P 500 ETF Trust (SPY) is flashing a major buy signal, with its Relative Strength Index (RSI) currently sitting at 28.33 — firmly in oversold territory. Historically, every time SPY has entered oversold levels on the RSI, institutional buyers have stepped in aggressively, driving sharp rebounds in the following weeks and months.
The last time SPY dipped below the 30 RSI threshold was during market pullbacks in 2022 and 2023 — both of which were followed by significant rallies as institutions capitalized on discounted valuations. The current setup is no different. With earnings growth stabilizing, inflation cooling, and the Federal Reserve signaling a potential shift toward rate cuts in the second half of the year, the backdrop for a recovery is aligning perfectly.
Technically, SPY is also approaching key support levels that have held strong in past market corrections. The combination of an oversold RSI and strong institutional appetite at these levels creates a compelling case for a bounce.
My price target for SPY by year-end is $640, representing over 15% upside from current levels. With sentiment stretched to the downside and technical indicators flashing green, SPY looks primed for a sharp and sustained rebound. Now could be the perfect time to position for the next leg higher.

The Big ReloadI anticipate a significant pullback on the daily timeframe, targeting the $15,000 level before resuming the upward trend.
Following a substantial break in the bullish trend, a robust retracement is expected. This correction should trigger considerable buying momentum around the $15,000 to $16,000 range, presenting opportunities for long-term positions to the upside.

Aptos ($APT) Bullish Signal and ETF PotentialAptos (APT) is currently exhibiting a descending wedge pattern on the daily chart, characterized by converging trendlines that slope downward, typically signaling a potential bullish reversal upon breakout. Concurrently, Bitwise Asset Management has submitted an S-1 registration statement to the U.S. Securities and Exchange Commission (SEC) to launch an exchange-traded fund (ETF) tracking APT. This regulatory filing underscores growing institutional interest in the asset and could enhance liquidity, market exposure, and investor confidence if approved.
From a technical perspective, the Relative Strength Index (RSI) on the daily timeframe has formed a bullish divergence, with the price establishing lower lows while the RSI (14-period) prints higher lows. This discrepancy suggests weakening bearish momentum and strengthens the likelihood of a price reversal. Collectively, these factors position APT for a potential resurgence towards recent resistance levels, aligning with the projected breakout from the wedge pattern.
The combination of favorable technical indicators and the prospect of ETF-driven capital inflows presents a constructive outlook for APT in the near term.
Alex Kostenich,
Horban Brothers.

Nvidia’s Sell-Off Deepens: How to Capitalize on the Decline?📉 Nvidia’s Technical Breakdown:
● Nvidia’s stock has been caught in a storm of selling pressure over the past month.
● The recent breach of critical trendline support levels suggests the downward trend could gain momentum in the days ahead, opening the door for savvy traders to capitalize on the bearish momentum.
🔄 NVDS: The Perfect Inverse Play for Nvidia’s Slide
● For those looking to navigate this decline, an inverse ETF like NVDS NASDAQ:NVDS offers a compelling opportunity.
● Designed to move in the opposite direction of Nvidia’s stock, NVDS has shown a chart pattern that almost perfectly inverse Nvidia’s price action.
● This makes it a strategic tool to potentially profit from the stock’s anticipated slide.

PI/USDT : UPDATE...hello friends
Considering the good growth of this token, it has made a good ascending channel which is well supported by the bottom of the channel and it can be said that it is a valid channel...
Now we expect it to move to the specified goals.
Note that the indicated support is an important support for the price and must be maintained for further growth.
*Trade safely with us*

ADA/USDT: LONG !hello friends
Due to the price correction, now is a good opportunity to buy in steps.
Note that the best way to buy a ladder is to not suffer a loss if the price changes.
We have specified price targets for you.
*Trade safely with us*

SOL UPDATEhello friends
Considering the heavy fall of Solana, now we have formed a classic pattern in the good support area, and we can enter into transactions with the failure of resistance, with risk and capital management, and move with it to the specified goals.
*Trade safely with us*

TRUMP/USDT(BUY)hello friends
Due to the correction of the price and the breaking of the resistance, we can now buy with risk management and move to the specified goals.
*Trade safely with us*

[Update BTC] (1-2-3-4-5)+(WXY) x 2This model is in line with my previous work.
I'm expecting between 77k and 110k (less probable).
This is 2017 but accelerated.
It's going twice the speed but we will see decreasing returns.
Alts-->Higher

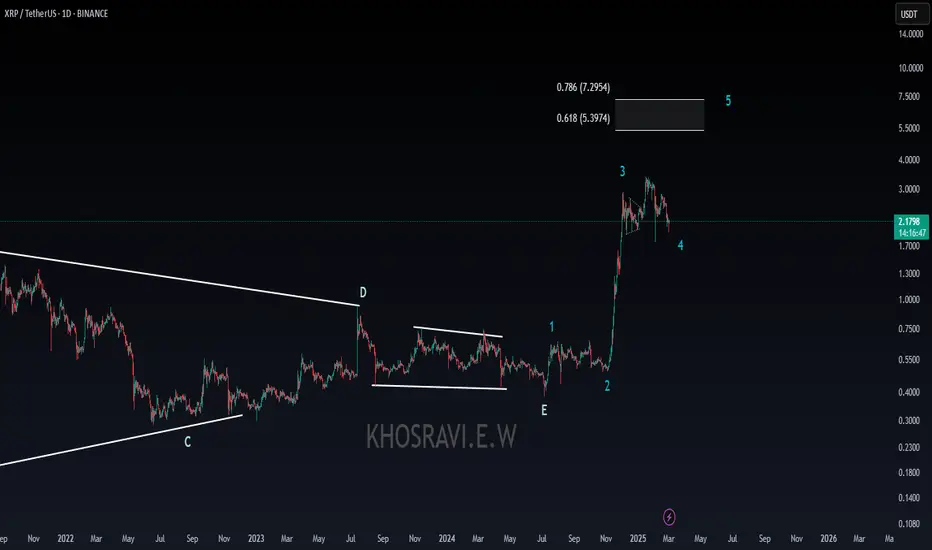
XRP ANALYSISVery important #XRP analysis on the daily time frame
Which in my opinion is one of the most important time frames to understand and comprehend the next movement of this currency.
So stay with us to be aware of the Ripple trend
If you liked this analysis, share it with your friends
Thank you
SOL ANALYSISThe analysis you see is on the weekly time frame.
If you need reviews on lower time frames to be posted on the TradingView site.... Leave a comment in the comments so that this can be done.
If you liked this analysis, share it with your friends.

TradeCityPro | LTCUSDT Let's go for spot buying?👋 Welcome to TradeCityPro Channel!
Let's go together to analyze and review Litecoin analysis, one of the oldest coins in the market, and let's go to update the triggers of the previous analysis!
🌐 Overview Bitcoin
Before starting today's altcoin analysis, let's look at Bitcoin on the 1-hour timeframe. Since yesterday, Bitcoin experienced a correction, which was necessary for the market, and it pulled back to the 102135 range. The next trigger for a long position will be a breakout above 104714.
Yesterday's correction, coupled with an increase in Bitcoin dominance, caused noticeable declines in some altcoins. This highlights the importance of monitoring BTC pairs in your checklist these days.
📊 Weekly Timeframe
On the weekly time frame, it is one of the coins that is in a good position compared to the coins and has had the least correction in recent declines and is in this position due to the possibility of ETF approval
There is no need to complicate things in this time frame and after the break of 136.45, we will buy and be above 98.44. This trigger is valid and we do not have much of an exit trigger for the conditions of these days on this chart and for now it is better to continue holding
📈 Daily Timeframe
On the daily time frame, we are also in a good position and we had a good return after the recent market decline due to the Bybit hack and Trump's tariffs and this is a good thing!
After breaking the 75.01 level and exiting the daily box and breaking its ceiling, we moved up to the resistance of 136.45 and are now fluctuating between the 98.44 to 136.45 boxes.
We also had a curve line in this time frame that was a good support for this event and every time we hit it, we made a good move upwards, but after its failure, it can be said that the upward trend moved into the range and went to form a new structure.
To buy spot after the 136.45 trigger is broken, we can buy for spot with a stop loss of 98.44 and as long as we are above 114.38, the 136.45 trigger is very important for us and it shows us more the strength of buyers and in case of a 98.44 break, we will go for 89 and 80 and we will have a price correction.
📝 Final Thoughts
Stay calm, trade wisely, and let's capture the market's best opportunities!
This analysis reflects our opinions and is not financial advice.
Share your thoughts in the comments, and don’t forget to share this analysis with your friends!

The fate of Litecoinhello friends
Here we have two scenarios:
1_ Channel failure and reaching specified goals.
2_ Falling from the roof of the channel and buying in steps.
Considering the high probability of approval of Litecoin ETF, the first scenario is more tolerant.
*Trade safely with us*

What Is an ETF and How Does ETF CFD Trading Work?What Is an ETF and How Does ETF CFD Trading Work?
Exchange-traded funds, or ETFs, have gained significant popularity in recent years as a way to invest in a diversified portfolio of securities. But for the uninitiated, the world of ETFs can seem complex and overwhelming. So, what is an exchange-traded fund, and how does it work? In this article, we’ll cover everything you need to know about ETFs, the advantages and disadvantages, and we’ll explain how to trade ETF CFDs.
What Is an ETF and How Does It Work?
The ETF definition in investments is the following: exchange-traded funds (ETFs), sometimes called equity-traded funds, are financial products that track the performance of a specific index, commodity, or group of assets. ETFs are popular among individual and institutional investors thanks to their flexibility, low fees, and transparency.
Like stocks, ETFs are traded on exchanges. This means that you can buy ETF shares when the stock market is open. Note that you buy shares of a fund, not the fund itself. Unlike stocks, however, ETFs don’t focus on a single asset. Instead, ETFs consist of multiple assets and even different asset classes, such as stocks, bonds, commodities, and cash. Some ETFs are passively managed, meaning they’re designed to track a specific market or sector. Others are actively managed and have professional portfolio managers who choose which assets to include in the ETF.
ETFs are an effective way for traders and investors to diversify their positions. Because ETFs comprise a diverse range of securities, holders can gain exposure to different assets, markets, and sectors without having to trade each one individually. This can help reduce risk and volatility and potentially generate more stable returns over the long term.
Differences and Pros and Cons of ETFs vs Mutual Funds
While they share some similarities to mutual funds, one of the main differences between the two is that mutual funds are only traded at the end of the trading day according to their net asset value (NAV), while an ETF’s share price fluctuates throughout the day.
Mutual funds pool money from investors to invest in a range of assets and are often actively managed by a professional portfolio manager. This means they typically come with higher fees and a higher minimum investment requirement.
Generally speaking, ETFs are the more cost-effective and flexible option, as they offer lower expense ratios and allow for intraday trading. They also tend to be more tax efficient due to their reduced portfolio turnover rates. However, ETFs come with commissions, while mutual funds do not. Moreover, the passive management style of many ETFs can lead to lower returns compared to mutual funds, which aim to beat the market through active management.
ETF Types
There are many different types of ETFs out there that can be used to meet a wide variety of investment goals. Let’s look at some examples of exchange-traded funds.
Index ETFs
What is an ETF in the stock market? Equity ETFs are those that track a stock index. They vary in terms of the sectors, industries, company sizes, and countries they cover. Equity ETFs are divided into broad market and sector ETFs.
Broad Market ETFs
These ETFs track the performance of the entire market. They can be a useful tool for investors looking to gain exposure to the overall market without having to pick an individual instrument. One of the most significant broad-market ETFs is the SPDR S&P 500 ETF.
Sector ETFs
Sector ETFs offer investment in specific industries or areas of the market, like technology, healthcare, energy, and financials. These ETFs are ideal for investors looking to profit from the overall growth of an industry. Popular sector ETFs include the ARK Innovation ETF.
Bond ETFs
These ETFs invest in fixed-income securities such as government, corporate, and municipal bonds. Bond ETFs expose investors to the fixed-income market, which can be an effective tool for diversifying a portfolio. One of the bond ETFs is iShares 20+ Year Treasury Bond ETF.
Commodity ETFs
Commodity ETFs invest in assets like gold, silver, oil, and other natural resources. Commodity ETFs offer investors easy access to the commodity market and can help them hedge during market downturns. SPDR S&P Oil & Gas Exploration & Production ETF (XOP) is an example of a commodity ETF.
Currency ETFs
These ETFs invest in foreign currencies and are used to gain exposure to a particular country’s currency or group of currencies, meaning they can be used to hedge against currency risk. Primary currency ETFs include the Invesco DB US Dollar Index Bullish Fund.
Leveraged ETFs
Leveraged ETFs use derivatives to provide investors with magnified exposure to the underlying assets, typically 2x, 3x, or 5x. For instance, a 2x leveraged ETF based on the S&P 500 would drop 2% if the S&P 500 fell by 1%. Direxion Daily Semiconductor Bull 3X Shares ETF is one of the most popular leveraged ETFs.
Inverse ETFs
These ETFs allow buyers to invest in the inverse performance of the underlying asset. For example, an inverse ETF that tracks the S&P 500 would go up when the S&P 500 goes down. Inverse ETFs can be useful for hedging against market downturns but also shouldn’t be held long-term. An example of an inverse ETF is the ProShares Short S&P 500 ETF.
How to Trade ETF CFDs
Aside from buying ETFs on stock exchanges, you can trade them via CFDs. CFDs are derivative products that allow traders to speculate on the price movement of an underlying asset, such as an ETF. Unlike traditional ETF investing, ETF CFD trading does not involve owning the ETF itself. Instead, traders are exposed to the price movements of the underlying ETF when they open a position.
At FXOpen, we have dozens of ETF contracts for difference (CFDs) that are ideal for short-term trading.
One key benefit of CFD trading is the use of leverage, which allows traders to open larger positions with smaller amounts of capital. This can potentially amplify profits but also magnify losses. All of our ETF CFDs offer 1:5 leverage, so to open a $100 position, you’ll need $20 to cover the margin requirements.
Moreover, ETF CFDs can be opened long or short, allowing traders to profit from both rising and falling markets. This can be especially useful when looking to hedge against an existing position or take advantage of short-term market movements.
Unlike regular ETFs, CFDs are subject to overnight fees, which are charged for holding open positions overnight. However, the same as with regular ETFs, CFD traders receive dividends if applied. The dividend adjustment is positive for buy trades and negative for sell trades.
Consider a Trading Strategy
If you’re thinking of trading ETF CFDs, it’s important to have a trading strategy in place. One approach is a trend-following strategy, which involves identifying and entering in the direction of the trend of the underlying ETF. Many traders use technical analysis tools, like moving averages and trendlines, to help them gauge the direction of a trend.
Seasonal trend trading can also work particularly well for ETF CFDs. Traders using this strategy look at historical market data and identify trends that tend to occur during certain times of the year. For example, a retail sector-based ETF might perform well around the holiday season, so traders could use this expectation to guide the direction of their trade.
Some traders prefer breakout trading - taking positions in ETF CFDs when their prices break through key support or resistance levels. Breakout trading can be especially effective in ETF CFD trading because ETFs tend to be less volatile than individual stocks. This means that when an ETF breaks through a support or resistance level, it may continue in that direction for an extended period, providing traders with an opportunity to profit.
Trading ETF CFDs: Advantages and Disadvantages
While we’ve explained some of the key advantages and disadvantages of ETF CFD trading, there are other factors to consider. Here are some additional advantages and disadvantages of ETF CFDs to be aware of.
Advantages
Flexibility: ETF CFDs can be bought and sold quickly throughout the day, providing traders with the flexibility to adjust their positions in response to intraday market events.
Broad Exposure: ETF CFDs offer exposure to a wide range of global markets and sectors, meaning that traders can diversify their positions and speculate on the price movements of a market or sector as a whole rather than relying on a single asset.
Hedging: This broad exposure also allows traders to use ETF CFDs to hedge against their other positions and reduce their potential losses. For example, a trader long on tech stocks could use a technology-based ETF CFD to short the sector during earnings season to protect from downside risk.
Disadvantages
Only Tradeable During Specific Hours: ETF CFDs are only available to trade when their respective exchanges are open. This might only be 9:30 a.m. to 4:30 p.m. EST, whereas other types of CFDs, like forex CFDs, are available to trade 24/5.
Potential Liquidity Issues: During periods of high volatility or low volume trading hours, some ETF CFDs can suffer from poor liquidity. This can widen spreads, increase costs for traders, and heighten the risk of slippage.
Fund Closure: While rare, it is possible for an ETF to cease trading while you have an open CFD position. This would result in the liquidation of the position and the net profit or losses being realised. When combined with leverage, a forced liquidation could lead to significant losses.
Your Next Steps
Now that you have a solid understanding of ETFs and their CFD counterparts, you may wonder how to start trading them. Follow this step-by-step guide to get started:
1. Open an FXOpen Account: At FXOpen, we offer a wide range of ETF contracts for difference (CFDs) that you can begin trading in minutes.
2. Explore ETFs: The next step is to look for ETFs that align with your strategy. You can research factors like potential for growth and historical performance to help determine if an ETF is right for you. You may also want to consider elements like the ETF’s level of diversification and trading volume.
3. Place a Trade: Once you think you’ve found the ETF you want to trade, you can use one of four trading platforms at FXOpen to enter a position. This involves selecting the ETF CFD you want to trade, choosing the appropriate trade size, and setting stop losses to manage risk. At this stage, you could also set some targets for where you’d like to exit your trade.
4. Manage Risk: As your trade progresses, the only thing left to do is manage your position’s risk. You could do this by gradually moving your stop loss closer to breakeven, taking partial profits, and hedging your position with other ETF CFDs.
Trade on TradingView with FXOpen. Consider opening an account and access over 700 markets with tight spreads from 0.0 pips and low commissions from $1.50 per lot.
This article represents the opinion of the Companies operating under the FXOpen brand only. It is not to be construed as an offer, solicitation, or recommendation with respect to products and services provided by the Companies operating under the FXOpen brand, nor is it to be considered financial advice.

DOT Eyes 170% Breakout as Nasdaq Sets to List Grayscale PolkadotPolkadot (DOT) is on the verge of a massive breakout as institutional interest in altcoin-based exchange-traded funds (ETFs) gains momentum. With Nasdaq officially submitting a filing to the U.S. Securities and Exchange Commission (SEC) to list and trade shares of the Grayscale Polkadot Trust (DOT), the stage is set for DOT to witness significant capital inflows, potentially driving a 170% rally.
Nasdaq Files to List Grayscale Polkadot ETF
The cryptocurrency investment landscape is undergoing a major shift as traditional financial institutions increasingly embrace digital assets. In a recent filing, Nasdaq submitted Form 19b-4 to the SEC, requesting approval to list and trade shares of the Grayscale Polkadot Trust. If approved, this move will provide investors with a regulated and institutional-grade avenue to gain exposure to DOT.
Grayscale Investments, the asset management firm behind the proposed ETF, has been aggressively expanding its crypto product offerings. Alongside the Polkadot ETF, the firm has filed for a spot Cardano ETF and an XRP Trust conversion. Other potential digital asset ETFs, including those tracking Solana (SOL), Dogecoin (DOGE), and Litecoin (LTC), are also being considered.
This filing follows a broader trend of growing institutional interest in crypto ETFs. In late January, asset manager 21Shares also applied for a spot Polkadot ETF, signaling heightened confidence in DOT’s long-term potential. The SEC now has 45 days to review Nasdaq’s application, after which it can approve, deny, or extend the decision-making process.
Technical Indicators Signal a 170% DOT Breakout
As of the time of writing, Polkadot is trading at $4.40, up 1.4% on the day. The technical outlook for DOT presents a highly bullish scenario, with the asset forming a textbook falling wedge pattern—a historically reliable setup that has preceded major upward price movements.
A closer examination of DOT’s price action reveals striking similarities to its March 2024 trading pattern, where the token surged 170% following a breakout from a similar wedge formation. Historically, DOT has exhibited a strong tendency to rally after breaking out of falling wedge patterns, making this a key inflection point for traders.
Momentum indicators further reinforce the bullish outlook. DOT’s Relative Strength Index (RSI) currently sits at 37, indicating that the asset remains in oversold territory with significant upside potential. With buyer accumulation increasing and selling pressure waning, DOT appears poised to capitalize on this dip before an explosive breakout takes place.

BUY XRPhello friends
Ripple, which was in a triangle pattern, has now managed to break it and pull back to the ceiling of the triangle, we enter into a purchase transaction with capital management.
*Trade safely with us*

BTC | NEWS | Abu Dhabi Invests $436.9M in ETFAbu Dhabi's sovereign wealth fund, Mubadala Investment Company, has made a significant investment in Bitcoin by purchasing $436.9 million in shares of the iShares Bitcoin Trust (IBIT).
This MUST be a clear indicator that they are bullish on BTC, at least for the longer term.
Investment firms most commonly invest with the eye on the longer term, and are usually unphased by short term swings like daily or even weekly corrections. This is, if anything, extremely bullish for BTC in the longer term (1 year and possibly beyond).
In similar news; the potential of the SEC approving XRP ETF is causing optimism for XRP.
XRP has recently made great progress in terms of fundamentals, more on that HERE:
________________________
BINANCE:BTCUSDT

TLM/USDThello friends
This currency is expected to move to the support range according to the structure that is formed.
If the range is maintained, we can see the structure change and price growth.
*Trade safely with us*

Should we buy bitcoin or not?hello friends
Due to the growth we had, we entered a downward channel. Now all we can do is wait...
We have obtained important supports for you to buy and we have identified the targets as well...
*Trade safely with us*

ETHEREUM ($ETH) – COULD STAKING ETFs TRANSFORM THE NETWORK?ETHEREUM ( CRYPTOCAP:ETH ) – COULD STAKING ETFs TRANSFORM THE NETWORK?
(1/7)
Ethereum fees (i.e., network revenue) are climbing as DeFi, NFTs, and now potential staking ETFs attract more usage and institutional capital. Let’s see what’s moving the second-largest crypto by market cap! 🚀💎
(2/7) – RECENT “REVENUE” TRENDS
• Network fees jumping with higher on-chain activity (DeFi, NFTs)
• Potential ETF staking could funnel institutional money and supercharge Ethereum’s fees & usage
• ETH price at $2,647—some say undervalued vs. historical highs & future prospects 💸
(3/7) – STAKING NEWS & IMPACT
• CBOE BZX filed to add staking to 21Shares Ether ETF—a first in the U.S. if approved 🏆
• ETH spiked +3% on Feb 13, 2025, after the news broke 📰
• Could pave the way for more institutional ETH adoption & yield opportunities
(4/7) – CRYPTO SECTOR COMPARISON
• NVT ratio (network value to transactions) suggests Ethereum might be undervalued given expected usage hikes
• Competitors (e.g., Solana, Cardano) also have DeFi & smart contracts, but ETH’s brand & developer base remain top-tier 🏅
• If staking ETFs become mainstream, ETH’s yield potential could shine even brighter 🌟
(5/7) – RISK ASSESSMENT
• Regulatory: SEC scrutiny of staking—could they tighten the reins? ⚖️
• Market Volatility: Crypto can pivot from bull to bear in a heartbeat 😱
• Tech Hurdles: Ongoing Ethereum upgrades (sharding) face potential delays ⏳
(6/7) – ETHEREUM SWOT HIGHLIGHTS
Strengths:
Leading smart contract platform, huge dev community
Growing staking potential, possibly extended to ETFs
Weaknesses:
High gas fees + ongoing scalability concerns
Regulatory uncertainties around staking
Opportunities:
If ETF staking passes, institutional inflows could surge 💰
DeFi & NFT expansion continue to drive demand
Threats:
Lower-fee rivals like Solana or Polygon on the rise 🌐
Potential crackdowns on staking by regulators
(7/7) – Is Ethereum undervalued at $2,647 given the ETF staking hype?
1️⃣ Bullish—ETH’s about to skyrocket! 🚀
2️⃣ Neutral—Show me actual adoption first 🤔
3️⃣ Bearish—Competition & regulation overshadow it 🐻
Vote below! 🗳️👇

Sector Rotation Analysis: A Practical Tutorial Using TradingViewSector Rotation Analysis: A Practical Tutorial Using TradingView
Overview
Sector rotation is an investment strategy that involves reallocating capital among different sectors of the economy to align with their performance during various phases of the economic cycle. While academic studies have shown that sector rotation does not consistently outperform the market after accounting for transaction costs, it remains a popular framework for portfolio management.
This tutorial provides a step-by-step guide to analyzing sector rotation and identifying leading and lagging sectors using TradingView .
Understanding Sector Rotation and Economic Cycles
The economy moves through distinct phases, and each phase tends to favor specific sectors:
1. Expansion : Rapid economic growth with rising consumer confidence.
- Leading Sectors: Technology AMEX:XLK , Consumer Discretionary AMEX:XLY , Industrials AMEX:XLI
2. Peak : Growth slows, and inflation may rise.
- Leading Sectors: Energy AMEX:XLE , Materials AMEX:XLB
3. Contraction : Economic activity declines, and unemployment rises.
- Leading Sectors: Utilities AMEX:XLU , Healthcare AMEX:XLV , Consumer Staples AMEX:XLP
4. Trough : The economy begins recovering from a recession.
- Leading Sectors: Financials AMEX:XLF , Real Estate AMEX:XLRE
Step 1: Use TradingView to Monitor Economic Indicators
Economic indicators provide context for sector performance:
GDP Growth : Signals expansion or contraction.
Interest Rates : Rising rates favor Financials; falling rates benefit Real Estate.
Inflation : High inflation supports Energy and Materials.
Step 2: Analyze Sector Performance Using Relative Strength
Relative Strength RS compares a sector's performance against a benchmark index like the
SP:SPX This helps identify whether a sector is leading or lagging.
How to Calculate RS in TradingView
Open a chart for a sector TSXV:ETF , such as AMEX:XLK Technology.
Add SP:SPX as a comparison symbol by clicking the Compare ➕ button.
Analyze the RS line:
- If RS trends upward, the sector is outperforming.
- If RS trends downward, the sector is underperforming.
Using Indicators
e.g.: You may add the Sector Relative Strength indicator from TradingView’s public library. This tool ranks multiple sectors by their relative strength against SP:SPX
Additionally, you can use the RS Rating indicator by @Fred6724, which calculates the Relative Strength Rating (1 to 99) of a stock or sector based on its 12-month performance compared to others in a selected index.
Example
In early 2021, during economic recovery, AMEX:XLK 's RS rose above SP:SPX , signaling Technology was leading.
Step 3: Validate Sector Trends with Technical Indicators
Technical indicators can confirm sector momentum and provide entry/exit signals:
Moving Averages
Use 50-day and 200-day Simple Moving Averages SMA.
If a sector TSXV:ETF trades above both SMAs, it indicates bullish momentum.
Relative Strength Index RSI
RSI > 70 suggests overbought conditions; <30 indicates oversold conditions.
MACD Moving Average Convergence Divergence
Look for bullish crossovers where the MACD line crosses above the signal line.
Example
During the inflation surge in 2022, AMEX:XLE Energy traded above its 200-day SMA while RSI hovered near 70, confirming strong momentum in the Energy sector.
Step 4: Compare Multiple Sectors Simultaneously
TradingView allows you to overlay multiple ETFs on one chart for direct comparison:
Open AMEX:SPY as your benchmark chart.
Add ETFs like AMEX:XLK , AMEX:XLY , AMEX:XLU , etc., using the Compare tool.
Observe which sectors are trending higher or lower relative to AMEX:SPY
Example
If AMEX:XLK and AMEX:XLY show upward trends while AMEX:XLU remains flat, this indicates cyclical sectors like Technology and Consumer Discretionary are outperforming during an expansion phase.
Step 5: Implement Sector Rotation in Your Portfolio
Once you’ve identified leading sectors:
Allocate more capital to sectors with strong RS and bullish technical indicators.
Reduce exposure to lagging sectors with weak RS or bearish momentum signals.
Example
During post-pandemic recovery in early 2021:
Leading Sectors: Technology AMEX:XLK and Industrials AMEX:XLI
Lagging Sectors: Utilities AMEX:XLU
Investors who rotated into AMEX:XLK and AMEX:XLI outperformed those who remained in defensive sectors like AMEX:XLU
Real-Life Case Studies of Sector Rotation
Case Study 1: Post-Pandemic Recovery
In early 2021, as economies reopened after COVID-19 lockdowns:
Cyclical sectors like Industrials AMEX:XLI and Financials AMEX:XLF outperformed due to increased economic activity.
Defensive sectors like Utilities AMEX:XLU lagged as investors shifted away from safe havens.
Using TradingView’s heatmap feature , investors could have identified strong gains in AMEX:XLI and AMEX:XLF relative to AMEX:SPY
Case Study 2: Inflation Surge in Late 2022
As inflation surged in late 2022:
Energy AMEX:XLE and Materials AMEX:XLB outperformed due to rising commodity prices.
Technology AMEX:XLK underperformed as higher interest rates hurt growth stocks.
By monitoring RS lines for AMEX:XLE and AMEX:XLB on TradingView charts, investors could have rotated into these sectors ahead of broader market gains.
Limitations of Sector Rotation Strategies
Transaction Costs : Frequent rebalancing can erode returns over time.
Market Timing Challenges : Predicting economic cycles accurately is difficult and prone to errors.
False Signal s: Technical indicators like MACD or RSI can produce false positives during volatile markets.
Historical Bias : Backtested strategies often fail when applied to future market conditions.
Conclusion
Sector rotation is a useful framework for aligning investments with macroeconomic trends but should be approached with caution due to its inherent limitations. By leveraging TradingView ’s tools, such as relative strength analysis, heatmaps, and technical indicators, investors can systematically analyze sector performance and make informed decisions about portfolio allocation.
While academic research shows that sector rotation strategies do not consistently outperform simpler approaches like market timing or buy-and-hold strategies, they remain valuable for diversification and risk management when used judiciously.
