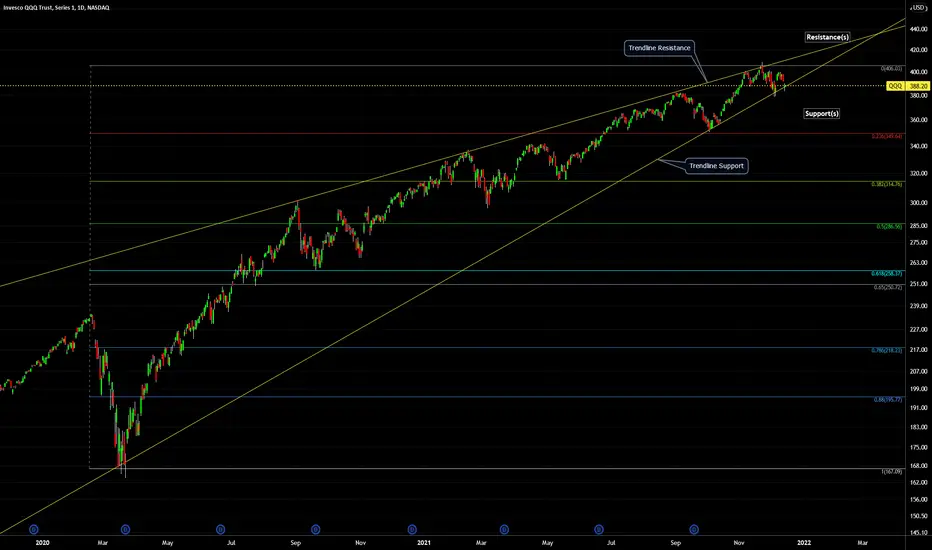
QQQ (Nasdaq ETF) - Support, Resistance, Trendlines, Pattern 2021QQQ (Nasdaq ETF) - Support, Resistance, Trendlines - 2021- Daily:
Price Pattern: potential Head-and-Shoulders.
-Resistance Price Levels (colored horizontal lines above current price)
-Support Price Levels (colored horizontal lines below current price)
-Trendline Resistance (diagonal yellow lines above current price)
-Trendline Support (diagonal yellow lines below current price)
note: chart is on log scale.
ETF
DIA (Dow Jones ETF) - Support, Resistance, Trendlines 2021 - DayDIA (Dow Jones Industrial Average ETF) - Support, Resistance, Trendlines - 2021 - Daily Chart:
-Resistance Price Levels (colored horizontal lines above current price)
-Support Price Levels (colored horizontal lines below current price)
-Trendline Resistance (diagonal yellow lines above current price)
-Trendline Support (diagonal yellow lines below current price)
note: chart is on log scale.

Gold (XAUUSD) - Support, Resistance, Trendlines, Pattern - 2021Gold (XAUUSD) - 2021 - Support, Resistance, Trendlines, Price Pattern - Daily Chart:
Price Pattern: Descending Triangle.
-Resistance Price Levels (colored horizontal lines above current price)
-Support Price Levels (colored horizontal lines below current price)
-Trendline Resistance (diagonal yellow lines above current price)
-Trendline Support (diagonal yellow lines below current price)
note: chart is on log scale.

Silver (XAGUSD) - Support, Resistance, Trendlines - 2021 - DaySilver (XAGUSD) - 2021 Support Resistance, Trendlines (Daily Chart):
-Resistance Price Levels (colored horizontal lines above current price)
-Support Price Levels (colored horizontal lines below current price)
-Trendline Resistances (diagonal yellow lines above current price)
-Trendline Supports (diagonal yellow lines below current price)
note: chart is on log scale.

USO (US Oil ETF) - Support, Resistance, Trendlines - 2021USO (United States Oil Fund ETF) - 2020 to 2021 - Support, Resistance, Trendlines:
-Resistance Price Levels (colored horizontal lines above current price)
-Support Price Levels (colored horizontal lines below current price)
-Trendline Resistances (diagonal yellow lines above current price)
-Trendline Supports (diagonal yellow lines below current price)
note: chart is on log scale.

UNG (Natural Gas ETF) - 2021 - Support, Resistance, TrendlinesUNG (United States Natural Gas Fund) - 2021 - Support, Resistance, Trendlines:
-Resistance Price Levels (colored horizontal lines above current price)
-Support Price Levels (colored horizontal lines below current price)
-Trendline Resistances (diagonal grey lines above current price)
-Trendline Supports (diagonal grey lines below current price)
note: chart is on log scale.

Exposure to crypto using blockchain ETF's, BLCNPurchasing crypto tokens is not the only way to gain exposure or profit from the development of web 3.0 and the myriad of potential uses for distributed ledger technology of which blockchain is a type. It is important when making investing decisions, particularly around new technologies, to try and look at the entire "picture". In this sense that means what kind of infrastructure and supporting services will be necessary to facilitate the implementation of this new technology. Often investors and speculators get tunnel vision and focus on one specific aspect of a new technology, this example is the mass speculation and focus on crypto tokens. BLCN is an ETF that will allow you to invest in businesses that provide the infrastructure and services for people to use blockchain technology, from the SirenETFs website they invest in companies that "are committing material resources to developing, researching, supporting, innovating or utilizing blockchain technology for their use or for use by others." Listed below are the top 10 holdings of the ETF, as you can see they are all companies that will profit immensely from the mass adoption and utilization of blockchain technology. In addition to this, from an investing perspective companies that are willing to adopt new technologies tend to generate a competitive advantage over the long run which results in appreciating share prices and profitability. As a long term investor I don't believe in trying to time the market but when prices fall to low levels on a short term basis it is a good idea to add to your position. Now is such a time for BLCN, crypto assets have declined over the last month and along with it the perceived value of the underlying infrastructure. This makes it a good opportunity to add to my position in BLCN, price has fallen outside the 200 day Bollinger bands and so I will begin gradually adding to my position until price moves back inside them. This method used along with your regular investing contributions helps to concentrate more of your purchases at lower price levels. I hope you found this analysis useful and alerted you to an alternate method for gaining exposure to crypto assets.
COINBASE GLOBAL INC
SILVERGATE CAP CORP
OVERSTOCK COM INC DEL
NVIDIA CORPORATION
ACCENTURE PLC IRELAND
ADVANCED MICRO DEVICES INC
MARATHON DIGITAL HOLDINGS INC COM
MICROSOFT CORP
ORACLE CORP
*Not a recommendation to buy or sell*


Consumer Staples ETF for Uncertain Times, VDCConsumer staples/Consumer defensive stocks are a sector that is exactly what the name suggests. They are products and services that no matter the situation consumers are unable or unwilling to go without. Examples include, Walmart, Costco, Coca-Cola, Colgate-Palmolive, etc. These big name household staples are unlikely to give you the astronomic growth of the newest tech startup or revolutionize their industry but they do have some very appealing attributes that may make investors want to include them in their portfolio.
1) They Don't go Backwards: Too often investors are focused on the upside and not enough on the downside. Just like that new technology company experienced huge growth by replacing the technology before it so to will it eventually be replaced. Consumer staples do not suffer from this need to constantly innovate, they exist to provide goods and services that are generally essential for our continued existence and so consumers are are unable to easily replace them with a new product. Of course no business is immune to failure but generally the companies that exist in the consumer staples sector will retain their value over time.
2) Safety During Economic Downturns: During periods of economic hardship consumers may decide to completely abandon purchasing anything except the essentials needed for everyday existence. This will inevitably result in decreased profits for most businesses in the economy but not so much the consumer staples. While they may also experience decreased profits, the decrease in revenue is capped for consumer staples by the fact that people still have to eat, brush their teeth, and clothe themselves, this results in businesses in the consumer staples sector generally outperforming during economic downturns.
3) Inflation Resistant: Businesses in the consumer staples sector are able to effectively price higher inflation into their products and services. When high inflation puts excessive upwards pressure on prices consumers will start to taper their purchases of luxury and non-essential items, this generally means these businesses have to reduce prices to maintain sales or accept a decrease in revenue. Businesses who offer staple goods and services are not as prone to suffering from this phenomenon and can more easily price inflation into their products. This makes consumer staples an excellent hedge against inflation.
The easiest way for new or "lazy" investors to gain exposure to the consumer staples sector is to use an ETF. I recommend using the Vanguard Consumer Staples ETF (VDC). This ETF has 97 holdings diversified across the consumer staples sector, its top 10 holdings are:
1 Procter & Gamble Co.
2 Walmart Inc.
3 Coca-Cola Co.
4 PepsiCo Inc.
5 Costco Wholesale Corp.
6 Philip Morris International Inc.
7 Mondelez International Inc.
8 Altria Group Inc.
9 Estee Lauder Cos. Inc.
10 Colgate-Palmolive Co.
With the multiple headwinds currently facing the markets including, out of control inflation, China's property market collapsing, irresponsibly loose monetary policy, and record high valuations across every asset class, now is a good time to make sure you have exposure to an ETF like VDC that can help you weather an impending financial disturbance.
*Not a recommendation to buy or sell*

Waiting DEalThis ETF performs well on the return to the long zone. Closure above the level of 91.33 - entry into the deal. Target: 107.5. ( Upside 17.8%).
❤️ If you find this helpful and want more FREE forecasts in TradingView
. . . . . Please show your support back,
. . . . . . . . Hit the 👍 LIKE button,
. . . . . . . . . . . Drop some feedback below in the comment!
❤️ Your Support is very much 🙏 appreciated!❤️
💎 Want us to help you become a better Stock trader?
Now, It's your turn!
Be sure to leave a comment let us know how do you see this opportunity and forecast.


ETHUSD - Longer term view! 🐂 🐻We in consolidation for now:
Lows: $4000 areas
Highs: $4800 areas
A break to either direction, a pull back and then continuation to show the direction of trade short term of the formation draw. Either way, longer term I am bullish ETH and any pull backs regarding price, I will be buying in further.
Long term view: A break above, pattern: Cup & handle formation including the shorter term formation, we could easily reach to $5500-$6000 areas. Larger institutional firms are predicting it to go towards $15k-$20k. However, price doesn't always go in a straight line.
Institutional wise ETF & Options etc & the adoption of ETH has more of a use case is far greater than BTC. Allowing the Alt-coins in yr 22 to prosper further.
Disclaimer: NOT FINANCIAL ADVICE.

I will avoid trading below this trendline | ARKKToday, we will look at ARKK, one of my favorite assets to trade.
What can we see right now? The price made a new local low last week, which took us to a 42% decline since the previous ATH on February 2021.
As you can see, this scenario already happened in the past, and ALL the time, we saw new ATH coming after that. That's why it's important to define what I will be expecting before taking new bullish setups on Cathie Wood's ETF.
The main element I want to pay attention to is the current descending trendline. Below that level, I will assume that I'm not in a solid situation to develop setups. Therefore, I want to see a breakout of it FIRST.
Most of the time, getting great opportunities is a matter of patience, and the most important thing is that we can't force the market to provide us with an opportunity; we can only wait. And, at the moment, the price is on a clear bearish trend, far from our filter. So, this post is more about "what I will not do" rather than what I'm expecting. So, my conclusion here is:
Until I don't see a breakout of that descending trendline, I will not risk my capital, and I will keep waiting. Let's see how much time we should wait for that to happen. Maybe a couple of months.
Thanks for reading, and feel free to add your view or charts in the comments.

Comparing BTC Price Action with AltcoinsMorning☕
I'm here only to spread for the people that want avoid the liquidation risk of futures that we can buy on Binance ETF tokens like DOTDOWN, SUSHIDOWN, IFYDOWN, 1INCHDOWN, etc...
That's da stay-in-play secure mode to takes good profits today. Comparing te price action on the CHART will help u to choose one of thoses 'DOWN' tokens.
Good day trading!
Likes and share If I help u!

ETFs and rising concerns (TL;DR at end)ETFs are by far the most popular form of investment, regardless of whether you are a parent saving up for your child's college or you're a multi-millionaire/billionaire banker, a good portion of your investments will be in exchange traded funds, regardless of whether that fund is for commodities, industries or indexes.
Since their first implementation in the 1990s, they've have grown rapidly as seen in the thumbnail of this idea ( AMEX:VOO ). In the words of Mr. Buffett himself, there is only one problem with index funds: "they're boring". You can't stand with your friends on the weekend at the barbecue and talk about all the trades you've made in response to crazy market action because you've got some fund manager who just holds the stock of everybody worth holding (in theory). All you do is put more money into it, or take money out of it.
However, recently I came to the realisation (like many other investors), they're becoming ludicrously priced. Not just the individual price but the overall market cap with companies like Blackrock and Vanguard holding quite conceivably hundreds of billions if not trillions of dollars within ETFs. Now there are concerns regarding a potential crash in the ETF market or at least the funds that trade through indeces. As far as the cause of such crash, I wouldn't dare attempt to make some degree of educated guess as anything could happen. One may consider me rather cynical when it comes to this topic but I'm sure I'm not the only person who has a problem with losing money.
Now there is absolutely nothing one can do about a crash but there are other solutions to minimise losses especially in a market that is trading so dangerously high. I would personally (assuming I had the financial capacity) take out around 60-75% of my overall investments in ETFs and transfer them to AAA rated state issued bonds or simply reinvest the money in stocks I already hold. Then I would continue my regular dollar cost averaging approach to investment in ETFs (or whatever the frequency is that you add money to such funds) until such a crash may occur. At a given point, (depending on the fund and how severe the crash is) I would increase the frequency and amount of money I add to such funds as the price drop should cause them to appear very attractive. Understandably, many people will disagree with this approach as you are still setting yourself up to lose money (unless you remove all your money from the funds, while you still could potentially continue earning. This results in the investor being left in some sort of dilemma. Although this is another discussion for another day) and "past performance is no indicator of future results" but this is the approach I would take.
As usual, other opinions, facts, news and comments are always welcome so comment away and stay safe!
TL;DR: ETFs are trading very high in price (dangerously) and a potential crash is luring (if you have a cynical outlook).*
*See the last paragraph on what I would do, due to such a situation being upon us.

VEMT Daily - Continues to look constructive Been accumulating this ETF for a while and banking a decent monthly divi. Bullish set ups continue to form. Yesterday we saw a bull flag break and an inverse H&S will be confirmed above 38. Targets are 39 area

SOL BreakoutSolana has just started to breakout on the lower timeframe. I expect it to continue because of the announcement of a SOL ETF
Solona ETF announcement

BTC Forecast, ETF on cryptoHello people, hope you are doing ok;
As you may know the BTC ETF has been approved, to be honest Im not that excited, Wall Street now will be the new whale in this market, and a whale that is not filled with BTC, they are the ones who manipulate the prices in the derivative markets.
So I am expecting a pullback during this week.
Right now am not drunk, so lets see how this analysis goes. :)

VXUS near levels to add to positionVXUS is an ETF issued by Vanguard that seeks to track the FTSE Global All Cap ex US Index, which measures the investment return of stocks issued by companies located outside the United States. VXUS holds 7760 stocks, with net assets totaling $416.8 billion and an expense ratio of only 0.08% this ETF is extremely attractive for exposure to mostly large cap global equities. With the recent identification of a new variant of Covid the ETF's price has started to decline quite quickly. Viewing this ETF as a long term investment declines in price due to market panics are seen as excellent opportunities to purchase shares at reduced prices. As price declines I will continue to gradually increase the size of my position in this fund. Recent events have shown us that the perceived disruptions and negative effects of the Covid pandemic have not been nearly as detrimental to business as previously thought and so any undue panic simply represent an opportunity for patient, dispassionate investors to pick up bargains.
*Not a recommendation to buy or sell*

XAUUSD 1D TF : 25.Nov.2021Today, the price of gold reached the bottom of its uptrend channel and after reaching this range, it reacted positively. The lowest price traded today was $ 1778. Today's Canlde is Signal Bar and we're looking forward to KEY BAR , and in this case we can look for the Buy position in the daily timeframe. if the price Close below this range we will enter to a Sell position and the most important resistance (target) will be $ 1796 and $ 1802.
Follow our other analysis & Feel free to ask any questions you have, we are here to help.
⚠️ This Analysis will be updated ...
👤 Arman Shaban : @Ar_M_An_4
📅 25.Nov.2021
⚠️(DYOR)
❤️ To give us energy and motivation , please like and leave a comment. ❤️


VUTY Daily - Should explode higher when eventually breaksBeen waiting ages for a break on this ETF... its just looking more and more bullish. I think we can see an explosion higher when 19.15 eventually breaks targeting 19.80. Been building a position while it has been consolidating
