VUTY Daily - Should explode higher when eventually breaksBeen waiting ages for a break on this ETF... its just looking more and more bullish. I think we can see an explosion higher when 19.15 eventually breaks targeting 19.80. Been building a position while it has been consolidating
ETF

Halal way to trade the movement of the Oil prices : ETFI am a Muslim so there are issues about the halal-ness in trading CFD, particularly the Brent CFD (BCOUSD in Oanda)
My solution for this is to buy an ETF that tracks oil companies (Oil companies stock price movement generally moves almost the same as the price movement of Brent and WTI). I found either FENY and XLE as great ETF for this. Unfortunately USO and UCO are tracking Brent futures.
I will use the Brent price chart to determine when I will swing trade FENY or XLE ETF. Look at the chart and it is self explanatory
Cool thing is sometimes FENY will perform slightly better than Brent CFD (13.87% for Brent / 16.85% for FENY for this particular timeframe)

TAN - Getting Ready for next Big Breakout TAN Solar ETF has been on upside momentum for a while. You could clearly see it had a channel breakout first, and then breakout the strong resistance line and now consolidating side ways for last 1 week or more, testing the next resistance levels. Weekly charts also shows that the buying demand is high and bulls are in control. Getting ready for next breakout. Targets 107.25, 113.20, 125.05, ATH. Can't give exact timelines, as markets are floating with light volumes getting into Holiday Season.

ARkk tri wedge As100ma getting close to price. Price most likely break
Downside and use 100ma as support to the upside.

Bought MJ for DOPE exposureBought MJ (small position)
Probably jumped in too soon, but wanted some DOPE exposure

Poseidon Dynamic Cannabis ETF $PSDN - BUY NOW - MSOgang#StatesReformAct FEDERALIZATION Bill in Congress. Cannabis legalization is BiPartisan. $PSDN has the best $MSOS advisors lined up to make great investing decisions in the ever growing cannabis sector.
The US sector is on fire. Women & minority leaders will be sought. Diversity is great for business. $PSDN & $KERN. Recommend.
Compliance Data SOFTWARE. #thegem (no shipping hassles)
US Cannabis Council Board Chair, Akerna CEO, Jessica Billingsley. $KERN
GL #cannabiscommunity #valueinvesting
FINALLY WINNING! Jobs & Justice

possible breakout to watch for... or breakdown?Watching to see what happens with this chart pattern we're seeing form on ARKG.
Over the last few months the ARK funds have been in the spotlight as funds that won't be able to perform well past the initial hype.
Will ARKG be able to take back its glory or breakdown to lower levels?
We'll see.

$MSOS AdvisorShares - US Cannabis ETF - BreakoutON VOLUME. Volume precedes price. A move without volume is suspect (see #shib).
States Reform Act on Monday should be a headliner for sure. Lot's of legislation to look forward to.
#cannabisreform
#thegem
Jobs & Justice
Akerna $KERN has the data. Enterprise Solutions, Compliance SOFTWARE
CEO Jessica Billingsley is Chair of USCC, United States Cannabis Council.
$ITHUF $GNLN $GPRO $FCEL $PLUG $GM $VIXY US5Y UP. Large cap #stonks & #cryptocrash to #cannabisreform
The future.

₿ SOLUSDT 1D ₿ : 12.Nov.2021If the price can maintain its static support, it can rise again to its ATH, the targets of the previous analysis are still valid.
Follow our other analysis & Feel free to ask any questions you have, we are here to help.
⚠️ This Analysis will be updated ...
👤 Arman Shaban : @Ar_M_An_4
📅 12.Nov.2021
⚠️(DYOR)

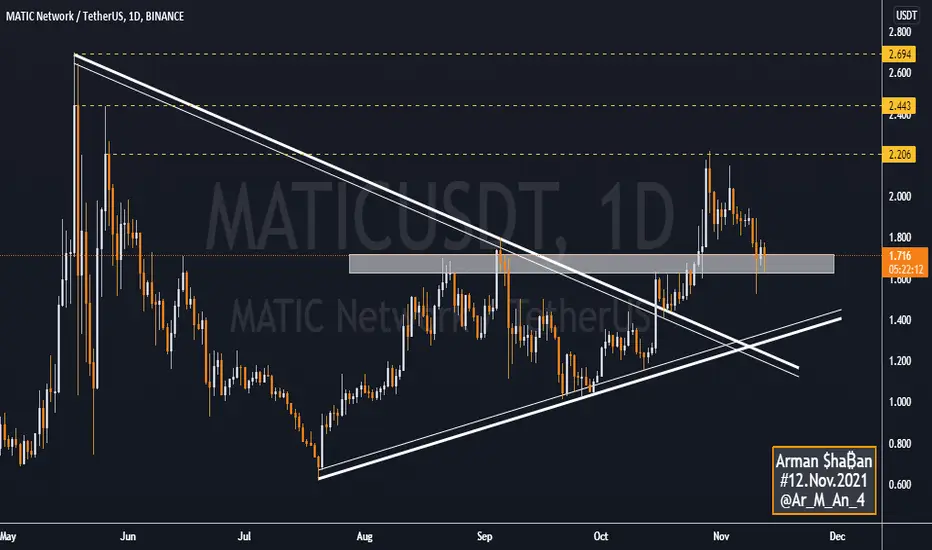
₿ MATICUSDT 1D ₿ : 12.Nov.2021Metic Network, after giving us 40% return, has reached a good support range again ... Keep an eye on Matic ...
Follow our other analysis & Feel free to ask any questions you have, we are here to help.
⚠️ This Analysis will be updated ...
👤 Arman Shaban : @Ar_M_An_4
📅 12.Nov.2021
⚠️(DYOR)
₿ BITCOIN 1D ₿ : 12.Nov.2021Bitcoin has reached an important support level and if the support of the $ 62300 range is lost, we can expect the price to fall further to the level of $ 60200 and $ 57700 ...
Follow our other analysis & Feel free to ask any questions you have, we are here to help.
⚠️ This Analysis will be updated ...
👤 Arman Shaban : @Ar_M_An_4
📅 12.Nov.2021
⚠️(DYOR)

BTC GOING FOR THE NEW ATH SOON?With the ETF news we have seen BULLS breaking all the resistances and currently BTC is sitting there just 2% below the previous ATH.
We still have to find out if this ETF was sell the news event or does it really have what it takes to take BTC to the new ATH! Right now these are mostly all these old retailers fomoing in at the top and we'll see it on Monday what really happens when we see the final news.
Right now to me it looks like that BTC is going for the ATH very soon!
This is not a financial advice, it is very risky until we break the final resistance of the last ATH I'll try to reduce my exposure but I do think that BTC is ready for another leg up after some corrections and we might break the resistances.
This is my bullish bias, anything can happen with the final news, but I do hope and I do think we're going to break the previous ATH!
Be Safe!
And give a like if you liked this idea!

Asset Classes - Part 1 and 2 - For beginnersAsset classes - Part 1 - Stocks, Bonds, Commodities and Currencies
There are several types of asset classes which group together investments with similar characteristics. However, each asset class also has its own particular features that it does not share with other asset classes. Most common asset classes are: equities, fixed income, real estate, commodities and currencies. Correlation between different asset classes within the same industry is common. However, asset classes in unrelated fields show very little correlation. Each asset class possesses a different level of liquidity; most liquid asset classes are equities, fixed-income securities, and commodities.
Sub-asset class
Asset classes can be subdivided into sub-asset classes; for example, commodities can be subdivided into lumber, metals, oil, etc. Sub-asset classes can be further subdivided into separate groups which show common characteristics while showing characteristics of the broad group at the same time. For example, metals can be subdivided into precious metals and industrial metals. Each group can be then divided even further to efficiently distinct between separate features of asset type. For example, precious metals can be divided into gold, silver and platinum.
Illustration 1.01
Illustration above shows a daily chart of continuous CFD on WTI oil. Price made a low of 33.67 USD on 2nd November 2020 and continued to rise until it reached a high of 85.39 USD on 25th October 2021.
Correlation
Some assets tend to show correlation. Such correlation can be positive or negative. Positive correlation means that two assets behave in a similar way. For example, when gold rises then mining stocks rise as well. Contrary to that, negative correlation describes such behavior in which assets move in the opposite direction to each other. For example, when USDEUR declines then WTI oil tends to rise.
Illustration 1.02
Illustration above shows the daily graph of Exxon Mobil Corporation which belongs to the oil mining and exploration sector. It made a low of 31.11 USD on 29th October 2020 and then continued to rise until 1st November 2021 when it reached a high of 66.08 USD. Positive correlation can be observed between CFD on WTI oil shown in Illustration 1.01 and Exxon Mobil Corporation stock.
Stocks
Stocks, also called equities, are normally issued by an eminent (company, state, etc.) as shares which give right of ownership to their holder. These shares are then sold by eminent (to investors) with the purpose to raise capital. Stocks are predominantly traded on stock exchanges and they can be either common stocks or preferred stocks. Common stocks entitle a shareholder to vote at shareholders´ meetings and to receive dividends being paid by a company. Preferred stocks differ from common stocks in that they usually come with limited or no voting rights at all. Though, preferred stocks have higher claims to dividends and distribution of assets by a company. This means that in case of liquidation of a company preferred stockholders have priority over common stockholders. In addition to that, preferred stocks can pay higher dividends than common stocks and because of that they are good for building passive income based on dividend payments which can be monthly or quarterly.
Bonds
Bonds are simply loans made by an eminent (borrower) which can be state, corporation, or any other legal entity. Bonds are considered fixed-income instruments because they come with interest payments being paid out to an investor. Owner of a bond is called debtholder while the issuer of a bond is called a creditor. Bonds are tradable assets and they have maturity. In addition to that, bonds come with risk of default. Because of that, higher yielding bonds usually come with higher risk of default. Bonds are great investment vehicles for building passive income, however, they generally underperform in terms of yield when compared to stocks, commodities and indices. Bond yield is negatively correlated to bond's price.
Commodities
Commodities are basic goods (such as gold, lumber, oil etc.) that are used in commerce. They are usually refined or used for production of other goods. Commodities can be traded on market exchanges where they must meet specified minimum standards like quality, weight, type, etc. Commodities are great speculative and anti-inflationary investment vehicles.
Illustration 1.03
Illustration 1.03 shows the daily chart of CFD on WTI oil. On 20th April 2020 due to the WTI oil crisis at Cushing, Oklahoma price plunged below negative 36 USD (-36 USD per barrel). Unfortunately, that is not depicted on the chart (chart depicts lowest value at 0.00 USD).
Currencies
Currency has the role of a medium of exchange for goods and services in almost all economies around the world. There are many different currencies worldwide, however, predominantly used currencies are U.S. dollar (USD), Euro (EUR), British pound (GBP), Yuan (CNY) Ruble (RUB), Yen (JPY). Relationships between currencies are highly intertwined making the currency market very complex and hard to predict. Central banks can influence currency rates through monetary policies such as interest rates and quantitative easing. Similarly, a government can impact currency rate by enacting fiscal policies. These policies can have an impact on spending, import, export, etc.; which will, in result, influence currency rate. In addition to all of that, some currencies exhibit positive or negative correlation with commodities such as gold, oil, etc.
Illustration 1.04
Illustration above shows the daily graph of EURUSD. It is observable that EURUSD made lows in March 2020 and then continued to rise towards November 2020. Only a month later in April 2020 oil bottomed out and then started to rise in tandem with EURUSD (depicted in Illustration 1.03).
Asset Classes - Part 2 - Cryptocurrencies, ETFs, CFDs
Modern technology along with financial evolution brought rise of new asset classes such as cryptocurrencies, exchange traded funds (ETFs), contracts for difference (CFDs) and options. These new financial instruments represent alternative investment to stocks, bonds, commodities and currencies. Additionally, some features within these products can help an investor to diversify portfolio, trade short and use leverage with ease of a few mouse button clicks.
Cryptocurrencies
Cryptocurrency is simply digital currency. Most cryptocurrencies are based on blockchain technology which acts as a distributed ledger that is run by a large number of computers that comprise decentralized structure. Normally, cryptocurrencies are not issued by central authorities (however, central banks around the world currently work on digital form of fiat currencies). Cryptocurrencies are encrypted by cryptographic methods which makes them very difficult to counterfeit and double-spend. These assets are considered to be more volatile when compared to stocks, bonds, commodities and fiat currencies. Another defining feature that sets cryptocurrencies apart from other assets is that they are traded non-stop (24 hours a day, including weekends). Most popular cryptocurrencies are Bitcoin (BTC), Ethereum (ETH), Cardano (ADA), Ripple (XRP), Dogecoin (DOGE).
Illustration 1.04
Picture above shows the monthly chart of BTCUSD (Bitcoin in USD). It is very easy to spot unbelievable growth of more than 862 000 % between August 2011 and November 2021.
Exchange traded fund (ETF)
Exchange traded fund is a type of security that is publicly traded on a stock market exchange and which tracks an index, stock, commodity, or other asset. Exchange traded funds can track either one asset or group of assets. This allows an ETF to be structured in such a way that it can reflect performance of a particular economic sector.
Illustration 1.05
Illustration above shows the daily graph of JETS ETF which is an airline exchange traded fund. It has exposure to airline manufacturers, airline operators, airports and terminal services.
Contract for difference (CFD)
Contract for difference is exchange traded security that is cash-settled and which does not include delivery of goods. It simply pays the difference between the opening price and closing price. CFDs copy the price of other securities and they can be traded short, and also on margin. However, usually higher fees are associated with CFDs when compared to stocks, bonds, currencies and commodities.
Illustration 1.06
Depiction above shows the monthly graph of CFD on USOIL.
DISCLAIMER: This content serves solely educational purposes.

SPY - Patient Bears FeastPretty obvious what is in store for the next few weeks. What goes up, must come down. A few unfilled gaps that need recognition.

SPYShort term little double bottom with a failed neck break.
with an over lapping abcd prediction.
this is more for live trading on such short time frames. good for finding entry's and exits.
Im also publishing to see future progress and predictions play out

Oil ETF : FENYTo profit rising price of Brent, you can do worse than checking out FENY ETF. Check out the Brent price action correlation with FENY (Fidelity MSCI Energy Index ETF)

SPY (S&P500 ETF) - Trend, Support, Resistance - 11/2021SPY index ETF price has been in an uptrend & ascending channel throughout 2021.
Price is currently testing the upper resistance trendline (~$470).
Bearish Scenario: Price falls down below $466 to $460.
Bullish Scenario: Price breaks up above $470 to $480.
Support(s): $466, $464, $460, $455, $452, $448, $446.
Resistance(s): $470, $472, $476, $481, $485, $488, $494.
Note: Q3 2021 Earnings Season will end after mid-November.

DON'T FOMO AT 62K AT SELL AT 50K ☠️Hi everyone 👋🏽
🕊 Wish y'all have a profitable lifestyle 🍀
📌 BTC /USDT - H:4 - Time frame
📌 PRICE ACTION - FIBONACCI - BEARISH DIVERGENCE - FUNDAMENTAL - ichimoku cloud
📍 ⚠️ BITCOIN chart looks so scary in my eyes ⚠️ 📍
🍀 First, I have to apologize for my absence in the past week. I am looking forward to update cryptocurrency markets
📍 In the H:4 time frame I can see two bearish divergences which may lead the price back to the 50k-53k price zones.
✍🏼 Along with the latest ETF NEWS, I am starting to worry so much about Bitcoin chart, I PERSONALLY see the latest ETF news as a horrible news which I am going to explain why:
1- BTC is one of the most decentralized if not the most decentralized asset in the world and with ETF news the decentralization part about BTC does not make sense any more!
2- Bitcoin does not like regulation in general; and again with ETF regulation this aspect is also questionable
3- Bitcoin is all about the peer to peer money exchange world-wide; ETF does not like that either
⚠️ Another thing: If I want to store all my Bitcoin in a centralized bank and start to pay taxes; why can't I buy GOLD or other stocks? 🤔
📍 From technical analysis point of view, I see two bearish divergences in the chart in RSI and Price
📍 From ichimoku cloud point of view, I can see a red cloud in the given dates which either can stop or drop the price to the kijun line
📍 From Fibonacci point of view, we did not see a pullback to 0.618% and 0.5% zones which are really necessary for the future growth
📍 I also see the last pump not as an ETF miracle, it was all technical along with a little bit of FOMO and NEWS
TO BE CONTINUED

(BTC) What's happening? Dip or new ATH?If you pay attention to the momentum, it becomes weaker in the falls during the price compression
But BTC dominance is declining which has weakened it.
What is clear is that Bitcoin holders are waiting for US decision on the BTC Spot ETF. which if approved, would be a strong price stimulus.
It's better to Take a little profit. Then you can buy potential dips and if Bitcoin decides to touch new ATHs, we will not lose anything. Because in the next few years there will be many great opportunities in this market and we will use them 😉

TOKE at acceptable levels to start buyingTOKE is an ETF that seeks to generate capital gains by investing in companies that have exposure to the broad cannabis industry. Since the start of the year the ETF's price has declined steadily from highs of around $26 to about $13 currently. The drop in price has bought the shares into a range of reasonable value considering the relative youth of the legal cannabis industry and the size of the companies this ETF holds. Long term cannabis products have significant growth potential and is only a matter of time before it is legalized and its use normalized across most societies. As long as price stays below $15 I believe it is a good time to start increasing exposure to this industry that has long-term growth potential.
*Not a recommendation to buy or sell*

Bitcoin Futures! The Fake Bitcoin! Who's "wallet"??? LOL! WOWWell, back to Bitcoin and Ethereum as trading pairs for this trader. Gulp, cough cough. These are big freaking whales and waves, I tell ya. WOWie!!! Lots of biting by big sharks (so big, sharkies are called "Whales" LOL!
Oh boy this little dogFISH feels tiny after the last few days of surfing. WOW what a way to end a winning streak! Now I have to wash my swim suit and let dry! LOL That was a big SHIBsters LOL
Hide to Bitcoin and Ethereum, the King and Queen of crypto, You need both! The queen is useless without the king in the current cryptophere, so you need the powerful Queen ETC and hide the King BTC in cold storage OFF NET ASAP to prepare for the tsunami coming... I don't when but these waves both on the market and in crypto are tell tales!
The shitcoin mega waves is the canary in the coalmine. You do not want to be too close to the surf because the tide will go back to sub $60K levels on Bitcoin possibly. Take take ALL the shells you can now, and head to higher ground ASAP. I can't tell you the timing, I'm always wrong there because time is relative and the force controls that. I'll likely be surfing these things but you won't see me at the crest of these things and if I am, let me know! LOL I like to be a TOP DOG, but on $HITocean, I'll be top dOG if the Princesses of Whales allow me to be! LOL I won't ask, I'll try to be quiet and listen to the whale quietly LOL The charts says everything but MissChart does not always know. It not her, it's her reporting what they white and black whales are up to. If you are a seasoned whale watcher, you will adjust your tools to fine tune the detection and the timing of the whales, If you are a beach partiipant trying to jump on assive waves, good luck. Watch from a distance at first!
So, avoid shitcoins and $HITcoins, buy the real ETH and real BTC and move away unless you are a Pro or have the stamina and devotion to learn. After decades of trading, I'm retooling 100% for crypto as equities over time with the dollar. Tesla and Apple will issue "crporate coins" to allow investors to directly trade their coins with backed coins. Tesla and Apple coins will be a hit, GM, FORD and Chrysler? Well only government will buy those, which means these are tax payer buying the coins via the back door to feel THE biggest Shark: Crookstreet.
So this DOG and, his little jet fighter, and small team will only ride the wave with me KEEPING my mouth SHUT. A wipe out with mouth open is nasty. On nasty waves, you need to abort. If you don't your assets will die as the waves crashes leaving you in pieces with a broken dream to get rick quick. Money is interesting, the easier it comes in, the easier it flows out. I've learned to respect it and not let it lead my actions. I am not longer a slave to money because I can simply reduce what I need. Simplicity is good. Truth is good, Honesty is good. I just want good.
Shitcoins will teach you the respect and danger of money and gambling. If you dare enter this shitcoin ocean, don't follow any pro surfers. You can''t react. You might now the important difference between a market order and limit. When to use them, on what type of waves etc. Waves, and spectators, might lead you to the rocks. Pick your ponies and ditch shit. A shitty horse will never be a winner. Good horses are good from the start and continue to dominate in the space. Look at Tesla and Apple. Kings/Queens of their space. Both are years ahead of competition and the rest of the pack will never catch up. New entrants might but who can catch up with Tesla internationally? The legacy and outdated car companies plan to start when Tesla will be cranking millions of cars per month across a network of distributed mega factories.
For cryptophere, the two winners today, are Bitcoin BTC and Ethereum ETH. Rest coins are toxic. Not trustable. Big whales control them. I have seen it first have and it's impressive! WOW! WOW! WOW! Ouchies LOL The SHIBster bites but he was a good runner so I stilll love the little beast out of respect, not love. I'm not sure if he represent the devil or the heavens. So that little biter is 100% trade only because I have zero trust until it proves it's a friendly white whale and not a deadly dark MEGA shark. The charts will tell me, not the other way around! LOL Don't hope, don't expect, don't think you know the colour or intention of the Princes of Whales. Only THEY know.
For me, it's not about money. It's about surfing these megawhale wages to the best of my ability learning every single day to be humble. Best way to learn to surf when you think you're a good surfer is to jump on board on the North facing side of Hawaii in the winter season. WOW WOW WOW Novices, watch from a distance! LOL If you're a newbie on the beach and say "hey, that looks easy and fun, let me try", well go out to the "surf" but make sure you carry just a small amount of coins in your pockets because , 99% chance, they aren't coming back. And if you carry too much both YOU and your coins will hit got under and sink to the bottom. It's possible but it's as easy as it looks but it will continue to attract the "fear of missing out" FOMO masses to feed the mega sharks, ughhh, black whales.
I've been trading part time since it was legal and I'm becoming a professional surfer. It's work but it's a trill if you nail those waves! I'll surf the cleaner ocean with ETH and BTC and, once I shower and brush my teeth, retune, will head back to $HITocean to make more money because it's scary but very lucrative. Nasty when you wipe out in shit with your mouth wide open. Cough, cough Lesson learned, surf shit with your month closed. OMG that's going to be hard. Please gods and Prince of ocean, SAND and beaches, have pitty on this little itty bitty surfer! LOL WOOF WOOF WOW WOW WOW ouchies D0G$ LOL !!! I love your roBOTs LOL Cute little remote control for MEGA $hitsters!!!! LMDAO!!! WOOF WOOF LOL WOW!
I have experience and scars. So I'm fine losing money on a bad call but it has to be calculated and that means taking emotions out and trading like a robot, if you can't afford to buy one with diamonds made by crushing SAND! LOL ;-)
If you're trading without automatic stop loses or are 100% dedicated to the screen, you will lose to pros who are setup properly. They have massive robots and they will borrow coins from HODLers, give them high interest rates, and SHORT the $hit out of crap at the perfectly right time. Don't pretend to be a whale if you are a tiny fish. Quietly watches the whales, you might not be able to tell if they are white or black, but the waves are the same for both. Black whales will show themselves to watchers. Trust me on this.. I've ridden enough mega $HIT waves that some of these Princess of Whales are AMAZINGLY powerful in changing the direction of big waves! LOL WOW WOW WOW!
Now what about Bitcoin Futures? That's another shit ocean but that's by banksters instead of gangsters LOL All a joke of course, I'm a dog with four paws telling DOG stories! LOL WOOF Seriously, do not enter shit oceans without undertstanding " The Big Short" the movie. Watch it 5 times. Movie should be called "Banksters vs banksters: Average people get killed and nobody understand why?" This upcoming event, if The Sequel: Revenge of the "temporary" debasement of the dollar." And I really hope humanity has learned from 2008/2009 and leverages GOOD over EVIL. This flying rock of ours that we're physically attached to in a "temporary" manner isn't the end. It's the test - can we coexist with each other and all living things?
Not with Banksters and Gansters tools of massive financial destruction. We need the banksters to show the gangster that derivative products are not heahtly for the average investor, these are scalping tools. How to you avoid banksters and gangsters, easy, head the other way! Cold storage Bitcoin and Ethereum and practice moving the stuff around because people underestimate the difficulty and get trapped or lose coins on failed transfers. Yeah, it's beta but it's amazing, the residual finishing stuff will happen with the Apples and Tesla of the world being the "retail" (aka average person banksters' speak) would call it, these derivatives and shadows shit is "catshit wrapped in dogshit". So if you want to buy shit with a fake Bitcoin logo on it, go right ahead but it's counterfeit Bitcoin. To HAVE Bitcoin, you need either a paired public and private key (aka cold wallet) and a backup phrase to securely backup your cold wallet. If you trade BTC, you don't own the Bitcoin, your trading platform generally do. DEX (distributes exchanges) could change that but we'll see two cryptopheres that shadow the Internet itself. A normal internet and cryptophere where people do law abiding things and the "dark web" "dark cryptoshere" owned by different groups that one might or might not want to be associated with. Depends on where you think you'll be treated best from a lifestyle and tax perspective. If you are in a Western Country, you can expect to pay taxes so if you think you can move money to a safe crypto exchange with questionable coins and "neighbours" go ahead. I tell everyone, research who your are entrusting your crypto with.
Most regular people who understand fiduciary duties will entrust their cryptos to well known banks or reputable organisations like Apple and Bitcoin. So do I expect to pay for a Cybertruck using ETH2 when the truck is ready to ship, yes. Absolutely, ETH2 and BTC Lightning will be supported by Tesla. Elon has already said it but mainstream and yourtube-click-bait-yours are too dumb to understand the guy's hints. I'm going 100% chart and I just have to retune everything for massive surfs. I will go out again in $HITcoin ocean looking for the $HIT and trying to avoid the SHIT. Wipe out in shit and gulf, best keep your mouth SHUT! LOL
Gulp Shit = More to Ethereum and Bitcoin to watch the tsunami from a distance, Its coming! When you feel rich, take half off the table! There will be other waves you can ride, if you have a surfboard left! LOL
Please comment and like if you enough zoo stories ! I to be an animal and DOG (of dOG) because whales & sharkies are the real DOGs but I prefer to be a fluffy bunny that quietly looks for carrot fields protected well away from sharkies and wolves. Contact me here before or via private chat here @JustCharts and let's focus on Just Charts! LOL Gulp LOL
PS LONG Bitcoin. Not Futures or unbacked fake ETF. Backed by the real thing in trusted custody with the ability to veriify because we no longer trust. At least, I don't, I educated myself and looked at the latest data available to make my first conclusion that I trust neither banksters or gansters black whales. I will watch them from a far distance on on friendly, quiet beach.
Peace Paw
@JustCharts just a little surfing dOG with deep respect for all the MEGA White Whales and Dark Sharks
A little dirty but washing up nicely! LOL WOOF WOW

SMOG ETF retracement for better priceWe saw a strong rejection today at the resistance zone from February 2021.
The RSI shows VanEck to be overbought and I would expect a retracement down to the 0.23 or even to the 0.38 fib-level.
Stay alert to enter at better price.

Investing Green: Global X CleanTech ETFIn this post, I'll be introducing a way you can gain expose yourself to green investments through Global X CleanTech ETF ($CTEC).
Disclaimer: This is not financial advice. This is for educational and entertainment purposes only. I am not responsible for the profits or loss generated from your investments. Trade and invest at your own risk.
The Potential of Green Investing
- President Joe Biden is expected to unveil a new $1.75 trillion spending framework on Thursday, which will include $555 billion for clean energy investments.
- The spending targets emissions-reducing technologies across buildings, transportation, industry, electricity and agriculture.
- The dollars earmarked for climate spending focus on incentives rather than punishments.
- The initiatives will start cutting pollution now, with more than one gigaton of greenhouse gas emissions reduced in 2030.
- This will set the U.S. on a path to reduce emissions by 50% to 52% below 2005′s levels by 2030.
- The plan includes a 10-year expansion of tax credits for utility-scale and residential clean energy, transmission, storage, electric vehicles and clean energy manufacturing.
- More than $100 billion is set aside for resilience investments as extreme weather events, including wildfires fueled by climate change, batter the U.S.
Framework Breakdown
- $320 billion: Clean energy tax credits
- $105 billion: Resilience investments
- $110 billion: Investments and incentives for clean energy technology, manufacturing and supply chains
- $20 billion: Clean energy procurement
Information about the ETF
- The Global X CleanTech ETF (CTEC) seeks to invest in companies that stand to benefit from the increased adoption of technologies that inhibit or reduce negative environmental impacts.
- This includes companies involved in renewable energy production, energy storage, smart grid implementation, residential/commercial energy efficiency, and/or the production and provision of pollution-reducing products and solutions.
- Inception Date: Oct 27, 2020
- Total Expense Ratio: 0.5%
- Net Assets: $187.38B
- Net Asset Value (NAV): $22.23
Top 10 Holdings
1. PLUG POWER INC (PLUG) - 8.02%
2. ENPHASE ENERGY INC (ENPH) - 7.60%
3. VESTAS WIND SYSTEMS A/S (VWS DC) - 5.71%
4. SIEMENS GAMESA R (SGRE SM) - 5.24%
5. SAMSUNG SDI CO LTD (006400 KS) - 5.19%
6. SOLAREDGE TECHNO (SEDG) - 5.10%
7. XINYI SOLAR HOLDINGS LTD (968 HK) - 4.89%
8. FIRST SOLAR INC (FLSR) - 4.80%
9. QUANTUMSCAPE CORP (QS) - 4.33%
10. JOHNSON MATTHEY PLC (JMAT LN) - 3.66%
Technical Analysis
- This ETF has undergone a long phase of accumulation between $16-21
- While it has broken out of the accumulation range, there are two main levels of resistance it needs to break; $23.3 and $29.6
- We could expect the ETF to test the now resistance-turned-support in the form of a pullback before moving up to create higher lows and higher highs
- Based on the fibonacci retracement level, we could consider the 1.618 a plausible long term target.
Conclusion
The US government is investing heavily in cleantech, and paving way for green companies to grow, and it's highly likely that other governments will begin to do the same across the world. Finding a specific winner for their cause might be difficult, but this ETF allows you to gain exposure to a variety of cleantech companies. While this ETF doesn't have a long track record, it's managed by a reputable company. Technically, we have broken out of the accumulation range, and yet the price is still close to the ETF's net asset value, providing high upside potential for the mid to long term.
If you like this educational post, please make sure to like, and follow for more quality content!
If you have any questions or comments, feel free to comment below! :)
