continued support for five g (FIVGthere should be continued support for fiveg stocks into the end of the year pushing FIVG back up toward $41
Etfs

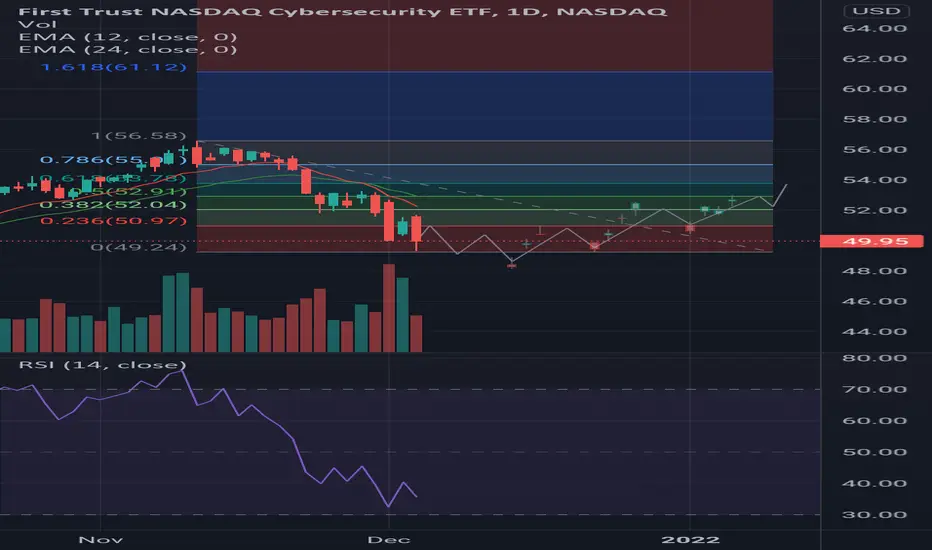
continued support in cybersec (CIBR)cybersec stocks should see additional support through the end of the year pushing CIBR back up toward $53
buy the dip sell gap close (SPY)pretty simple idea. if we gap down spx and we hold some new higher daily low early on, then break above premarket close by a significant margin, the index is a buy until gap is almost or all the way closed
volatility spike still expected by end of wed, thu morning
if we gap up and start to trade up, the higher targets can be used

buy the dip and sell the gap close vix (UVXY)another straightforward idea, invert targets on spy to hedge against es1! calls or spxl shares to add to as you reach sell targets in spx
when pivot is in VIX favor add UVXY when pivot trends toward uptrend in spy add SPXL

The "SPY"Since September 20th, when we get close to the 200 ema (purple), we get a retracement towards the previous high before the next retracement process. A retracement of 61% would take the SPY to $463. The previous high was broken and we have a higher low as we are bouncing off of the 200 ema with a 20/50 cross.

nasdaq futures recovery (TQQQ)theres reason to believe a releif rally will come in the form of big tech and the nasdaq futures finding support and TQQQ moving back toward the $155 area

I will avoid trading below this trendline | ARKKToday, we will look at ARKK, one of my favorite assets to trade.
What can we see right now? The price made a new local low last week, which took us to a 42% decline since the previous ATH on February 2021.
As you can see, this scenario already happened in the past, and ALL the time, we saw new ATH coming after that. That's why it's important to define what I will be expecting before taking new bullish setups on Cathie Wood's ETF.
The main element I want to pay attention to is the current descending trendline. Below that level, I will assume that I'm not in a solid situation to develop setups. Therefore, I want to see a breakout of it FIRST.
Most of the time, getting great opportunities is a matter of patience, and the most important thing is that we can't force the market to provide us with an opportunity; we can only wait. And, at the moment, the price is on a clear bearish trend, far from our filter. So, this post is more about "what I will not do" rather than what I'm expecting. So, my conclusion here is:
Until I don't see a breakout of that descending trendline, I will not risk my capital, and I will keep waiting. Let's see how much time we should wait for that to happen. Maybe a couple of months.
Thanks for reading, and feel free to add your view or charts in the comments.

a double top at resistance for VIX (UVXY)UVXY should double top, and head for yearly lows not passing $27.5 and breaking $20 to the downside. Broader market fear nearly maximized.

ETFs and rising concerns (TL;DR at end)ETFs are by far the most popular form of investment, regardless of whether you are a parent saving up for your child's college or you're a multi-millionaire/billionaire banker, a good portion of your investments will be in exchange traded funds, regardless of whether that fund is for commodities, industries or indexes.
Since their first implementation in the 1990s, they've have grown rapidly as seen in the thumbnail of this idea ( AMEX:VOO ). In the words of Mr. Buffett himself, there is only one problem with index funds: "they're boring". You can't stand with your friends on the weekend at the barbecue and talk about all the trades you've made in response to crazy market action because you've got some fund manager who just holds the stock of everybody worth holding (in theory). All you do is put more money into it, or take money out of it.
However, recently I came to the realisation (like many other investors), they're becoming ludicrously priced. Not just the individual price but the overall market cap with companies like Blackrock and Vanguard holding quite conceivably hundreds of billions if not trillions of dollars within ETFs. Now there are concerns regarding a potential crash in the ETF market or at least the funds that trade through indeces. As far as the cause of such crash, I wouldn't dare attempt to make some degree of educated guess as anything could happen. One may consider me rather cynical when it comes to this topic but I'm sure I'm not the only person who has a problem with losing money.
Now there is absolutely nothing one can do about a crash but there are other solutions to minimise losses especially in a market that is trading so dangerously high. I would personally (assuming I had the financial capacity) take out around 60-75% of my overall investments in ETFs and transfer them to AAA rated state issued bonds or simply reinvest the money in stocks I already hold. Then I would continue my regular dollar cost averaging approach to investment in ETFs (or whatever the frequency is that you add money to such funds) until such a crash may occur. At a given point, (depending on the fund and how severe the crash is) I would increase the frequency and amount of money I add to such funds as the price drop should cause them to appear very attractive. Understandably, many people will disagree with this approach as you are still setting yourself up to lose money (unless you remove all your money from the funds, while you still could potentially continue earning. This results in the investor being left in some sort of dilemma. Although this is another discussion for another day) and "past performance is no indicator of future results" but this is the approach I would take.
As usual, other opinions, facts, news and comments are always welcome so comment away and stay safe!
TL;DR: ETFs are trading very high in price (dangerously) and a potential crash is luring (if you have a cynical outlook).*
*See the last paragraph on what I would do, due to such a situation being upon us.

META BUY IDEAMETA has currently fell from it's All Time High to form a new Lower Low. The pullback is a healthy pullback forming at ABCD pattern. We have the initial High point which is our A then the fall to the Lower Low which is our B. Our C point could be represented by the current pullback that made a new Lower High. IF price does not break that last swing high, then we could see a push down past the last purple line to the blue lines which represents the 127 fib and 161.8 fib support levels. Three potential buy in opportunities would be, the double bottom support form on the bottom purple line and the blue zones below it. So, you have three Buy in targets that you could target to ride back up to the All time highs until it break from there to make a new All time high. This is only my opinion and not financial advice. Please do your own due diligence before investing.

Establishing a position in QYLD - how and why QYLD is a covered call ETF. They write calls on stock they own to bring in more consistent and predictable income. They do this to generate returns via options, this is helpful if you don't know how or aren't comfortable writing calls on your stock. It would behoove you to establish small positions after they pay their dividend should you choose to buy in. This happens monthly so you'll have more opportunities down the road to add onto your position.
Their top holdings are VERY concentrated in the FAANG stocks.
Does well in neutral markets.
QYLD pays a hefty dividend of 11.94% or about $2.70/share annually
Here is the wise way to buy this ETF. Wait until the dividend is paid (monthly in this case), and then spread out your buys across the next several days. There is no sure way to tell when the sellers will be done selling, so you want to be strategic - be careful of how long you wait because you may miss the dip all together.
Note : QQQ returns are significantly higher over the long term. QYLD is NOT in my opinion a buy and hold forever investment. Use is as a hedge if you want, but however you use it I hope that this short idea helps clarify how to maximize your return with QYLD.
NASDAQ:QYLD

SPY Elliott Wave View: Should Extend Into New HighsShort-term Elliott wave view in SPY suggests that the cycle from October 01, 2021 low is showing a higher high sequence favoring new highs to follow. The internals of that rally is unfolding as an Elliott wave impulse sequence where wave 1 ended at $436.03 high & wave 2 ended at $426.36 low. Up from there, wave 3 unfolded with extension where lesser degree wave ((i)) ended at $441.68 high. Afterwards, wave ((ii)) ended at $431.54 low, wave ((iii)) ended at $458.49 high. Then wave ((iv)) ended at $453.83 low and wave ((v)) ended at $470.65 high.
Down from there, SPY made a pullback in wave 4 to correct the cycle from October 04, 2021 low. The internals of that pullback unfolded as a zigzag structure where wave ((a)) ended at $465.26 low. Then wave ((b)) ended at $467.38 high and wave ((c)) ended at $462.05 low. Up from there, wave 5 remains in progress where wave ((i)) ended at $470.49 high and wave ((ii)) ended at $466.34 low. Near-term, while dips remain above $466.34 low and more importantly above $462.05 low expect SPY to extend higher towards $474.82- $480.04 area higher in wave ((iii)) before a pullback in wave ((iv)) develops.

PRN - Bullish Setup, wait for break PRN bullish on charts on multi time frame.
Points to consider
1. Price above 20 D SMA
2. Price above 20 Week SMA
3. Price above 5 Month MA
4. RSI Bullish on Monthly and Weekly MA
5. RSI looking for support on the Daily TF to reverse up.
6. Nice consolidation on Monthly charts
7. Price trading in a nice range for the last 8 months and setting up bullish structure with Monthly RSI not overbought
Price near All time highs and crucial RSI zones on daily charts, bullish structure.
Look to buy dips in the daily channel for a swing with good RR and look for channel break

ICLN - Clean Energy ETF - sector analysis, long setupICLN is setting up well on the monthly charts.
Points for consideration:
1. Price above 20 Day, 20 week and 5 month MA. This should act as a nice support zone
2. 200 Day Moving Average right above us that could act as potential resistance.
3. RSI is crucial zones and positive structure
4. Break above 200 Day MA will be seen as very bullish on daily/weekly close basis
Other ETFs in the same Clean Energy space are as below
1. PBW, TAN, CNRG, ACES, PBD,ICLN, QCLN, SMOG, FAN, NLR, GRID
2. Except NLR and GRID, all the others are below their 200 Day MA.
3. All the above ETFs have shown recent strength and above their 9 day and 20 Day MAs
From a sector ETF Relative Ranking Perspective, these are my current Rankings on relative strength basis (as on 15th Oct 2021 business close basis) and this is dynamic with price changes
ETF Name Ticker Strength Score Rank
iShares Global Clean Energy ETF ICLN 60.00% 5
Invesco WilderHill Clean Energy ETF PBW 20.00% 8
Invesco Solar ETF TAN 100.00% 1
SPDR S&P Kensho Clean Power ETF CNRG 90.00% 2
ALPS Clean Energy ETF ACES 80.00% 3
Invesco Global Clean Energy ETF PBD 30.00% 7
First Trust NQClean Edge Green Energy Idx Fd ETF QCLN 70.00% 4
VanEck Low Carbon Energy ETF SMOG 40.00% 6
First Trust NQ Clean Edge Smart Grid Infra Idx ETF GRID 10.00% 10
First Trust Global Wind Energy ETF FAN 20.00% 8
Will be preparing my views on the top 5 ETFs in this space based on the above relative strengths and will link them for your views and observations
Stocks to look for currently in this sector are as follows
1. RUN
2. JKS
3. PLUG
4. BWEN
5. SEDG
6. ENPH
7.TPIC
8. FSLR
9. FCEL
10. EVA
11. REX
12. AY
13. ORA
14. TPIC
15. EVA
16. CVA
AQN is currently showing a potential for downward break below its 52 week low, while TPIC, EVA and CVA are very close to their 52 week high
Interesting sector, has been all around the place so far.

BTC ETF is near, SEC deciding soon!!Hello everyone, as we all know the market action discounts everything :)
_________________________________Make sure to Like and Follow if you like the idea_________________________________
A bitcoin exchange-traded fund (ETF) based on futures looks increasingly likely to be approved by the U.S Securities and Exchange Commission this month, pushing the market more than 30% higher this month and almost reaching $60k level and with the possibility of the first Bitcoin futures ETFs being launched as early as next week, bullish sentiment is soaring. This marks a major milestone after nearly a decade of fielding crypto ETF applications.
Replaying to the Dollar, BTC has reached $59.8k Which is the highest value for BTC since the mid of May
The regulator isn’t likely to delay the products’ introduction to trading next week, But a decline is possible until the decision is final. These ideas, which are based on futures contracts, offer "substantial investor safeguards" that differ from Bitcoin ETF filings previously rejected by the SEC.
The futures product is likely to be the first one approved since they are viewed more favorably by regulators. Futures are governed by the Chicago Mercantile Exchange (CME) and require investors to put down cash on margin to trade them.
Possible Scenario for the market :
This push will probably lead the price to the $60k level, If that is to happen the Bulls will see this as a confirmation of how much power they hold over the market right now and they will be aiming to hit the resistance level at 61692.00 this week. But never forget that when a market is going under a big decision we might see a wide range of movements that might seems Bullish or Bearish until a decision has been made.
If a Bearish movement happens it will probably reach the support level at 56665.00 and might extend to the 55072.00 level.
Technical indicators show :
1) The market is above the 5 10 20 50 100 and 200 MA and EMA (Strong Bullish signs)
2) The ADX is at 26.31 showing that the market is trending with a positive crossover between DI+ (26.04) and DI- (13.00)
3) The MACD is above the 0 zero line indicating that the market is Bullish with a positive crossover between the MACD line and the Signal line
Daily Support & Resistance points :
support Resistance
1) 56665.0 1) 58258.0
2) 55976.0 2) 59162.0
3) 55072.0 3) 59851.0
Weekly Support & Resistance points :
support Resistance
1) 49286.0 1) 58335.0
2) 43594.0 2) 61692.0
3) 40237.0 3) 67384.0
This is my personal opinion done with technical analysis of the market price and research online from Fundamental Analysts and News for The Fundamental point of view, not financial advice.
If you have any questions please ask and have a great day !!
Thank you for reading.

$QQQInvesco QQQ is an exchange-traded fund that tracks the Nasdaq-100 Index™.
The Index includes the 100 largest non-financial companies listed on the Nasdaq based on market cap.
The Invesco QQQ Trust has been delivering superior returns for several years, easily outperforming SPY and other S&P 500 funds.
QQQ has been rising high for so long that it's only natural to wonder if it's due for a correction. Unless you count the very brief correction of 2020, tech stocks have been in a raging bull market for over a decade. QQQ - which tracks the NASDAQ-100 - has been a main beneficiary of that trend.
According to Invesco, the average bull market lasts 4.83 years.
QQQ has been mostly rising for more than twice that time.
History would tend to suggest that it's in for a possible correction.
So, lets take a look at the technicals.
QQQ is currently sitting in a upwards channel which ended up bouncing off support on the daily.
It’s a good idea to keep your eyes on this chart especially if price ends up breaking support or resistance which can give you a good idea of where the future will lie.
RSI recently out of oversold territory
MACD curling w/ a expectation of a continuation up.
Watchlist this.

Oil ETF, $OIH with a "head & shoulders" patternA lot of analyst have been publishing bullish outlooks for AMEX:XLE . But we have AMEX:OIH in our portfolio for long term position and now is also making several bullish signs. Bullish divergence with the MACD, above average buying volume and price action making a head & shoulders pattern (reversal pattern).
This trade would be a short term trade. The buy point is on the breakout above $197 and the target for profit taking is at $230 for a 16% profit. The projection for price target comes from the rules of the "h&s" pattern. According to the Bulkowski Chart Pattern Ranking (thepatternsite.com), this pattern is Rank #1 with a 50% chances of a throwback after the breakout, so be aware.

BDRY Expected to Rally Towards 38.50Trend Analysis
The main view of this trade idea is on the 2-Hour Chart. The ETF BDRY held its overall uptrend despite failing to break through the 30.75 resistance level on the previous two occasions. Support for BDRY is observed around the 23 price level. Expectations are for the ETF to break above 30.75 resistance on its 3rd attempt and rally towards 38.50. To negate this view BDRY needs to decline towards the 22.75 price level.
Technical Indicators
BDRY is currently above its short (50-MA), medium (100-MA) and long (200-MA) fractal moving averages. The moving averages are trending higher as the short term MA is trading above the medium term MA and the medium term MA is trading above the long term MA. Also there has been a positive crossover on the short and medium term MAs. BDRY’s RSI is above the 50 level and there has been a positive crossover on the KST.
Recommendation
The recommendation will be to go long at market, with a stop loss at 22.75 and a target of 38.50. This produces a risk/reward ratio of 1.46.
Disclaimer
The views expressed are mine and do not represent the views of my employers and business partners. Persons acting on these recommendations are doing so at their own risk. These recommendations are not a solicitation to buy or to sell but are for purely discussion purposes.

ETF Picks For The Next 5 YearsI don't post about stocks or ETF's very often. I got into investing via crypto - and my intention wasn't necessarily to make money either. I had lost faith in the current model of our banking system, and became inspired by what I saw as an alternative. That alternative also ended up being a good financial decision. Ironically (I say this because most investors and traders own a smaller percentage in crypto), my stocks only make up around 2-3% of my portfolio.
There are two reasons I've begun investing a little into the stock market (mostly via ETF's) since I pulled my inital risk from crypto:
1) I'm testing to see if my strategy for crypto (buying into fear, dollar-cost-avergaing, and being extremely patient) will work with regard to the stock market, and perhaps benefit me financially.
2) I genuinely support the marijuana industry and the clean energy industry. Yes, nuclear is considered to be "clean" energy. I picked nuclear because it's flying under the radar, at least in terms of what's "hot" right now.
Looking at the weed industry
Weed is currently a $60 Billion industry. That's actually larger than Tobacco. So, is it still undervalued? I think yes, since tobacco has significantly fewer uses. But let's look at something that's more widespread AND less healthy: Alcohol. The global alcohol industry is worth around $1.4 TRILLION. With that in mind, I think it's fair to assume weed can eventually become at least half as big. It won't be consumed in such large quantities, but I think the uses and applications for it will be quite widespread. What does this mean? It means the value of the Weed sector can grow at least 10x, and it can happen over the next decade. The $170 target is shown on the chart. However, MJ is not in a bull market yet. Despite this, I have been adding slowly. My trendlines show that this could be a decent place to buy. Horizontal supports are also outlined.
Looking at Nuclear
The safety of nuclear power facilities has dramatically increased. Interestingly, URA had been in a severe slump since the Fukushima incident. URA ultimately found a bottom, and is now in a bullish trend, with a golden cross on the weekly. I'm targeting all-time highs. The first big pullback is underway, after the recent incident at the Chinese nuclear facility. My first entry was near $15, but I am slowly buying dips. I also added a small URNM position, which comprises companies that hold physical Uranium. It may perform slightly better.
Of course, I may be wrong. This is why I'm buying slowly and cautiously, rather than piling in all at once. That seems to work with the slow-moving stock market.
I also have invested a little into some other clean energy sectors: solar, hydro, and wind.
Let's see what happens! Certainly not much fervor surrounding these ETF's at the moment, but it's always best to prepare, rather than react emotionally. Definitely learned that from crypto.
This is not financial advice. This is for my personal record, speculation, and entertainment only.
-Victor Cobra

JETS ETF Bullish inclined Naked Puts 10 Sep Expiry (Sep Track 2)This is the first month I'm breaking up my trades into 2 tracks to spread risk and provide myself with more room to navigate depending on the market situation.
I'm back bullish in JETS as it seems like the US is taking the virus in it's stride, even with Delta cases rising fast. Any virus precautions and restrictions while limiting are not new to business owners or consumers. Leisure and hospitality as an industry is opening up fast, Increasing pay and benefits to lure people back.
As more people get vaccinated and business returns, I think we should experience a jolt of green in this sector.
Sold 250 Puts @ 0.21 Strike 20
% to Strike is 13% from entry
ATR percentile is a high so I think we are at a pretty decent price
Rising RSI, tied to an uptrend of lower highs
Total BP Block: 50K

Energy flashing a buy signal (Technical Analysis)AMEX:XLE
NYMEX:CL1!
NYSE:XOM NYSE:AMPY
Energy stocks, crude oil, and the XLE energy ETF all flashing buy signals. $100 oil looks invitable.
From failed moves come fast moves, and oil/energy stocks failed an attempted breakdown below the neckline.
A few favorite long ideas: $LPI, $AMPY, $XLE, CL1 (futures), $XOM

Weekly Bearish Engulfing On The Real Estate SectorThis Real estate ETF looks like it's ready to rollover on the weekly timeframe due to it bearishly engulfing, being at a 1.272 fib extension, and the RSI trendline being broken after reaching overbought.
I will either be looking to buy puts in VNQ tomorrow or i will be looking to purchase shares of the 3x Ultra Short Real Estate ETF $DRV

$BLK: The Undisputed Heavy WeightAs we look forward into the future we may continue to see Blackrock's influence grow from an asset management company into something far greater. With deep pockets and potentially blue skies for the market along with a rising rate environment, we'll see if $BLK can get it done in the weeks / months / years to come.
