Price Channel Trading StrategyCharacteristics:
Channels are banded current trend-following indicators.
Similar to other indicators they lagging.
They have an upper and a lower line.
Upper and lower bands are at equal distance from a middle line.
The area between the upper and lower lines in the channel.
Signals:
The upper or lower line breakouts.
The upper and lower lines bounce backs.
Channels can be seen in trendy or sideways markets.
Different types of channels will be discussed in other videos like:
Donchain Channels
Keltner Channels
Fibonacci channels
.
.
Etfs

Six ETFs with an interesting thesisDiversifying your strategy
There are lots of ways to "win" at investing. For diversification, it can be useful to bet on a lot of different strategies, because often when one strategy starts to go wrong, another will start to go right.
But unless you're an expert coder with a lot of free time, you probably can't actively manage multiple different strategies yourself. That's where ETFs come in. ETFs can be great for diversifying your strategy without the hassle of actively managing your portfolio yourself.
In this post, I'll look at several different ETFs that have a novel and interesting investing thesis. I don't necessarily endorse all of these, but I think they're worth a look.
1. The Sparkline Intangible Value ETF
I've been following Sparkline for a while now, and they consistently put out some of the best investing research I've seen. Basically, Sparkline's thesis is that traditional metrics of value-- especially the price-to-book ratio-- don't work anymore in our technology-driven economy. More and more, what determines a company's value are "intangibles" like patents, talent, network effects, branding, and customer loyalty.
Sparkline has developed ways to "measure" each of these intangible categories. For instance, a good proxy for "talent" is how many PhDs and Ivy Leaguers are employed at a firm. Sparkline plugs these variables into a machine learning model to come up with a sense of which firms are a good "value" when you include intangibles in the calculation.
I've been reading this research for months and scratching my head trying to figure out how to implement it in my own investing, so I was pretty excited when they launched an ETF at the end of last month.
Top holdings of $ITAN include the FAANGM stocks, Nvidia, Intel, and Cisco. It's tech heavy, but you've also got other sectors well represented, from communications and pharmaceuticals to banks, retail stores, and automakers.
We only have a few days of data for $ITAN, so it's pretty meaningless to compare returns, but it has so far underperformed the index with a return of 1.7% vs. 3.1% for $SPY.
2. The iShares MSCI USA Momentum Factor ETF
In the scientific literature on technical analysis, one of the only indicators that seems to actually beat the market is momentum. The iShares Momentum Factor ETF buys large- and mid-cap stocks with high price momentum. Now, it may be that momentum will stop working at some point in the future, because market conditions change. But for now, it seems to work. $MTUM has returned 280% since its inception in 2013, compared to 235% for $SPY.
3. iShares MSCI USA Quality Factor ETF
Also a strong performer in the quantitative investing literature is the "quality" factor. Quality is defined as "high return on equity, stable year-over-year earnings growth, and low financial leverage." In other words, non-capital-intensive businesses with stable growth and low debt. The $QUAL ETF does a pretty decent job achieving sector-neutral exposure to the quality factor. To be honest, it tends to be a little expensive in terms of the price multiples of the stocks it buys. Maybe wait for a dip? $QUAL has returned 212% since inception, vs. 204% for $SPY.
4. Freedom 100 Emerging Markets ETF
Let's say you want exposure to emerging markets, but you're worried about exposure to China or other bad-actor governments. The Freedom 100 ETF may be what you're looking for. Heavily weighted toward Taiwan, South Korea, Chile, and Poland, $FRDM is based on quantitative econ research that shows that countries with higher "economic freedom" scores tend to experience greater prosperity and economic growth. Thus, $FRDM makes active "freedom-weighted" bets on emerging markets: "Country selection and weights are based on composite freedom scores derived from 76 quantitative variables measuring each country’s level of protection for both personal and economic freedoms."
Think of this like the ESG emerging markets fund. Since inception, $FRDM has returned 34% vs. 32% for $EEM.
5. Pacer 100 Cash Cows 100 ETF
Companies these days use a lot of fuzzy accounting: EBITDA and adjusted EBITDA in particular. Usually P/E ratios are calculated with non-GAAP earnings measures that have been heavily adjusted. This makes modeling and forecasting easier, because non-GAAP earnings are a lot less "lumpy" than GAAP earnings are. But if you want to invest based on "real" earnings and "real" value, you should really be using GAAP earnings or free cash flow. Free cash flow is the cash remaining after expenses, interest, taxes, and long-term investments. The companies that generate a lot of free cash flow are the ones that are genuinely profitable, and not just profitable on paper. Investing in free cash flow is the thesis behind the Pacer 100 Cash Cows ETF.
Free cash flow can be used for capital expenditures like R&D, for paying dividends, for buying back shares, or for acquiring other companies. Having lots of free cash flow is especially beneficial in a bear market, when asset prices are cheap and credit is tight. Why? Because a bear market is a great opportunity for a cash-rich company to buy back shares or snap up assets at an extremely low price. Just look at how the Pacer Cash Cows ETF outperformed the S&P 500 during the recovery from the Covid-19 pandemic:
M&A deals and cheap share buybacks helped propel the cash cows to stardom. But you can also see that during bull markets with high valuation multiples, the cash cows have lagged. $COWZ has returned just 93% vs. 112% for $SPY. I worry that $COWZ, like lots of value ETFs, is exiting stocks too quickly rather than holding them to maturity. Since it only holds the 100 cheapest FCF stocks at a time, it ends up only keeping the ones that stay cheap, which may be the lowest quality companies. You might do better to just buy some of $COWZ's higher-quality holdings and hold them forever.
6. Invesco S&P 500 Equal Weight ETF
Over the long run, the equal-weighted S&P 500 index has outperformed the cap-weighted S&P 500 index. There may be a few reasons for that.
First, base effects mean that small companies can grow faster in percentage terms than large ones.
Second, investors pay a premium for big companies because they perceive them as lower risk. But if you average the risk across a lot of small companies, it's a lot less risky and you end up getting a discounted price overall.
Third, cap-weighted indexes are kind of nuts, if you think about it. We're going to buy the most expensive companies, making them even more expensive. We're going to broadcast exactly what we intend to buy, and the basis on which we're making that decision. And literally everyone in the market is going to pile into this trade. Here's the problem: this system can be gamed . All you need is, for instance, a subreddit full of rowdy retail traders to realize that they can pump some tiny stock like GameStop up to an extremely high market cap, and then the indexes will be forced to buy it. Cap-weighted indexes probably get bullied into buying a lot of overpriced companies like Tesla that might not actually be good value for money. Buying equal weight avoids this exploit.
What are your favorite ETFs?
I'm always on the hunt for a good new strategy or investing thesis and would love to hear from you. What are your favorite ETFs? What's an ETF with an interesting thesis? What ETFs might be good for diversification, or might hold up well if market conditions change?

Investing or Trading?Hi, Im Riley...and in this article I want to discuss the topic of investing vs trading. A lot of people reading this probably are already leaning towards trading over investing. In this brief educational article, I want to share some key knowledge that I've been withholding from the Tradingview community ever since I started publishing indicators on this website.
What is this knowledge? In one word: ETFs. I discovered trading at a very young age (18)...and when I did, I was truly astounded at the technical analysis side of it. Now I'm 20 years old, and after 2 years of intense studying of trading the finanical markets...I've come to the conclusion that investing is an equally effective if not better alternative than trading. Specically, investing in ETFs.
To this date, I haven't actually traded yet...(cause I still live with my parents lol, and brokers generally want proof you live on your own before you start trading)... but I have lots of knowledge through reading hundreds of trading articles online, watching hundreds of trading videos, and creating indicators for the TV community over the past 2 yrs. So now that I've established my reputation, lets talk about ETFs and why they're so good...
ETFs...Exchange Traded Funds. What are they? An ETF is essentially a collection of stocks all compiled into one security that you (the investor) can buy at an affordable price. Take for example the S&P500 ETF , "SPY", probably the most well known ETF . It consists of 500 US stocks. Currently it costs $434 per unit (as I'm writing this article). That means you can buy this ETF for under $500 and get exposure to 500 different stocks. Effectively, you are diversifying your risk because now you have limited exposure to any individual stock within that 500 stock portfolio. You have effectively bought the stock market!
ETFs incur low commission fees...Why? because you only have to buy it once and hold on to it for the rest of your life until you decide to retire. Generally, they are also a much safer way of making profits in the finanical markets than trading. Whats so awesome about ETF investing is that the stock market as a whole is very predictable in the long run...it always goes up! Thats what ETF investing takes advantage of...long term and predictable gains.
I've done a lot of research on my own into different forms of trading...CFDs & futures trading, stock trading, and option trading. And something I want to note is that no matter how you slice or dice it, now matter how much you can argue trading is superior to investing, one thing is for sure: trading involves LOTS of work and time spent everyday...something that investing bypasses. Plus, trading can be an emotional rollercoaster. So if your a lazy guy like me whos come to the realization that the effort spent in trading is A LOT and probably not worth it for the extra gains...than ETF investing might be a better choice for you.
Please like, comment, share, and follow me! Good luck :)


ETF - Go long on Global X MSCI China Health Care ETF ($CHIH)The Global X MSCI China Health Care ETF (CHIH) seeks to invest in large- and mid-capitalization segments of the MSCI China Index that are classified in the Health Care Sector as per the Global Industry Classification System (GICS).


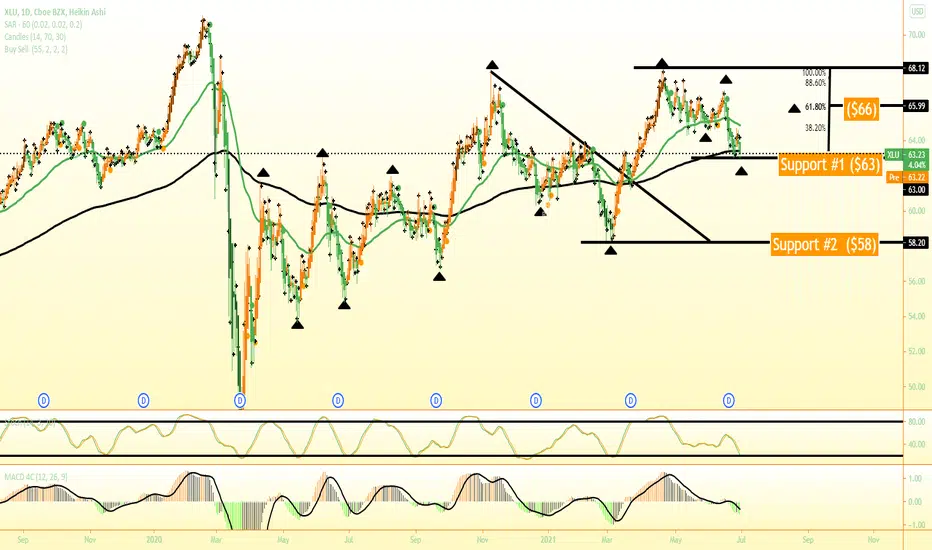
XLI Details in photo.
I like to keep things simple. Will wait for bullish candles above the 50 ma on the 15 minute timeframe before entry. Not advice...

Should be scanning ETFsCome Monday going to look at a position in XBI (if it has not gone too far). Pulled back and spiked at the Weekly 50% Retracement that matches with prior price action. Stop needs to be just below the low of May 11th.
The industry for this ETF is Biotech. This should make Cathie Wood happy.

HORD, another one to keep an eye onThis crypto is a bit more speculative than I usually prefer. However, I do want to keep an eye on it because the use case does seem pretty cool and the marketing behind it is strong. Additionally, they came out with some more bullish news today that they will be offering sector specific ETFs on their platform in the future. I think this is a cool idea for people who do not have a whole lot of time to do research on specific projects but want to invest generally in one of crypto's many sectors.
As for the actually TA there seems to an increase in the momentum as shown in the RSI. However the MACD is not looking as hot. The support holding is probably the most bullish indication for HORD.
Overall, I'm not really looking to jump into this yet, but it is one to keep on the radar.
If it does breakout though, and past its local high, doesn't have any other resistance to the left.

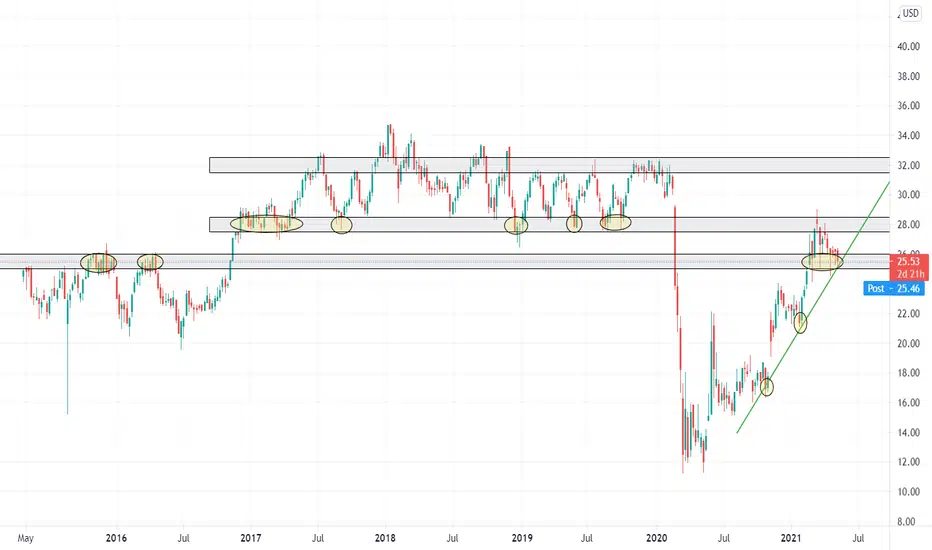
$JETS - Recovery of the Airline Industry“The U.S. Global Jets ETF $JETS provides investors access to the global airline industry, including airline operators and manufacturers from all over the world.”
TECHNICALS
$JETS is currently trading at $25.50 which is 13% below their most recent high of $28.98 which was made in March 2021. The stock has been in an upward trend since October 2020 as a result of increased vaccinations around the world and strong guidance. As seen on the chart, between 2017 and early 2020 $JETS established a strong support zone between $27.50 and $28.50. With travel expected to increase into the summer and vaccinations continue to be rolled out, $JETS can potentially see a 10% move and settle between $27.50 and $28.50 in the coming months.
RECOVERY
Based on their most recent earnings reports, airline companies such as $AAL, $DAL, $LUV, and $UAL have all posted that their revenue is up 100% or more from their pandemic lows. Although revenue is sitting around 50% of pre-pandemic levels, the growing number suggests that the industry is recovering.
RISKS
The greatest risk to the travel industry at the moment is the massive increase in covid cases in India and the emergence of the new covid variant B.1.617. Although much more information is needed, the new variant appears to be spreading at a much faster rate than before and it is unknown if vaccines will help prevent the contraction of the virus.
Anthony, OptionsSwing Analyst
A Study of Sector Rotation during year 2021 [Market Rotation]Sector Rotation Analysis starting from Jan 2021
While 2020 was a wonderful year for many investors, 2021 has been riddled with changes in the stock market thus far. In this analysis, I compared multiple ETFs that track different specific sectors in the market in order to visualize these changes. The periods and commentary are broken down month by month with the sector leaders and losers of that month.
A little about Sector Rotation:
Sector rotation in the market tends to follow the stages of business cycle—recovery, expansion, slowdown and recession.
Recovery
During the Recovery stage, feds will keep interest rates low while long-term rates rise. The material, financial, and industrial sector tends to take the lead during this phase.
Expansion
During the Expansion stage, the economy will expand at a stable pace while fed take a neutral stance on rates but credit conditions will ease. Again, long-term rates increase. Financials, Industrials, Technology, and Consumer Discretionary sectors will excel in this phase.
Slowdown
During the Slowdown phase, the economy peaks then starts to stagnate as inflation grows. At this point, credit conditions will be strained and stocks may fall. The sectors that do best in this phase are Consumer Staples, Energy, Health Care, and Materials.
Recession
During a Recession, the economy shrinks and feds cut rates. Long term rates decrease. Healthcare, Utilities, and Consumer Staples will do best in this phase.
2021 Sector Rotation Commentary
During January , we tested all-time highs for the most part. Several events that occurred were the Senate run-off, the inauguration of President Joe Biden, and even the GameStop Frenzy. In world news, the number of Covid-19 cases were spiking and investors were optimistic that the vaccine would become available and help open the economy back up. Chair of the Federal Reserve, Powell pledged that the central bank will leave interest rates near zero. During early January, Energy was king of the sectors but mid-way through was overthrown by Real Estate and Communication Services. The sector losers of January were Energy, Financials, and Materials.
February kicked off Earnings Season and we saw higher-than-anticipated numbers with a lot of companies beating Earnings expectations. One of the main events that occurred during February was the Treasury Yield started increasing significantly, this sent growth and tech stocks plummeting down (as they would be impacted more than established companies with well-balanced sheets and already sustainable revenue). A lot of low to mid cap stocks were significantly impacted by the rising yields and even up to today as I am writing this, still has not recover fully ($FUBO, $NIO, $PLTR, $SPCE). We saw a rotation from growth to value stocks. The Energy sector took reign over Real Estate while Communication Services rose steadily too. The sector losers of February were Materials, Health Care, and Consumer Staples sectors.
Early March was the bottom of the sell-off that started towards the middle of February. Some notable events were the Suez Canal mishap, several banks getting slapped with margin calls worth Millions of dollars due to exposure from Archegos, and the $1.9 Stimulus was finally passed! The stimulus benefited the banks, airlines, and other consumer discretionary stocks so we saw a slight rally in cause of the news. Real Estate, Energy, and Finance continue to lead amongst the other sectors while Technology, Consumer Staples, and Healthcare continued to remain sector losers.
It's Early May now and the market is starting to look both frothy and toppy. You can see a slight decline/curve from all sectors in the most recent period. Earnings Season is still going on but we saw many companies that met or exceeded expectations, sell-off after reporting earnings. We have also seen an increase in the VIX (volatility indicator) as a reaction on several news such as President Joe Biden's proposal to increase tax on corporations as well as the wealthy. The sector leaders today are (1) Energy, (2) Financials, and (3) Real Estate while the Sector Loser goes to Technology.
I hope this analysis is able to give insight on the current market in regards to different sectors. If there's one thing that is apparent in this analysis, it is that the rotation from growth stocks to value stocks continue. While Tech stocks were a favorite during the Covid-19 lockdown, Tech has been overthrown in favor of everyday necessities like Energy and Financials this year.
-Natalie Garces, OptionsSwing Analyst

3x ETF SOXL vs other 1x semi ETFs over various time horizonsI compare SOXL returns with SOXX, SMH, and PSI, all ETFs in the semiconductor space.
CONCLUSIONS AND FINDINGS:
YTD 2021 SOXL has not provided any net benefit over it's peers. And if you use stop loss orders you've probably lost money on it due to its extreme volatility. Smaller quant ETF fund PSI is the better performer on most/all time horizons YTD or more recent, especially from a risk/reward perspective. Only when comparing SOXL against the others on a time horizon of 1 yr or longer does SOXL outperform it's peers.
Importantly however, charts mimic real life only to the extent we make the purchase the entire position at once and don't touch it over the entire time frame. But this is not what most traders do. Thus, I recommend holding SOXL only if you're going to buy it and not set any stop loss orders, touch it, trade it, or even look at it for a year or more. But you probably can't handle that. I can't either. Thus the better, more realistic strategy for most traders is to get PSI or one of the other primary ETFs covering this space.

PVGThe green long-term channel started to appear around mid of July of 2016 by price hitting the top of the channel!
During the Covid19 Pandemic we observed a fake breakout but everything gone normal after first months!
15th of Sep the price touch top of the channel and started to fall! the red bearish trendline is broken and we are currently in pullback to the Broken trend line!
reactions to mid of the channel is not rare but they are not strong!
considering volumes, it seems market is waiting for 5th of may to observe the earnings and lower volumes in lower prices is not a good news for buyers!
If we are in the second Elliot wave we wont goes up more than the 11.73, but only "time" could clarify the best next move!
Right now for those owning some shares, my suggestion is to be a holder! until the Short-term channel is perfectly broken down or the long-term channel is touched you, then better to sell!
If you don't have any shares and you are a risk taker! you can buy tomorrow or right now!
and if your strategy is safer wait to see if the price break the 11.73 level perfectly or not!

AGQ- Time to push higherPlease check my previous ideas on AGQ, why I like to invest in it and the potential there is.
AGQ is a 2x leveraged Silver ETF. Instead of utilizing swaps like most geared funds, AGQ invests in silver futures and forward contracts—this also means the fund is structured as a commodities pool, so it will distribute a K-1 form.
Since I expect silver to go higher, holding some AGQ shares is another way to invest /speculate on the price of silver rising.
the FXPROFESSOR

Chart of the Day MORTA great example of 50% Retracement Levels being significant and Resistance turning into Support to launch a move!

Energy Sector Pullback LevelAMEX:XLE is setting up a pullback level to the bottom of the Daily Ichimoku cloud matching with the 2021 Q1 50% Retracement level. It is showing a similar pullback pattern to one of its component stocks NYSE:COP which I took a position in this morning.

LIT My vision about Lithium ETFIf price breaks out this rectangle it's interesting to open a long position

The Global Financial Crisis 2008. Why long term wins pt1 I give some background on me learning the markets
some brutal harsh lessons
and why ETF's like the SPY & GLD are awesome!

ARKK - $93 target?Look -- up in the sky!
Is it a crash? Is it a correction? No, it's a sale!
ARKK is at a critical support on the daily chart (right at the 200 MA on daily). But before I re enter, I like to zoom out and take a weekly chart view -- which is what I am presenting.
The weekly chart shows that ARKK rallied upward too quickly for it's own good (we all love the Cathie train). While the daily chart is at the 200MA the weekly is not even close to the 50 MA!
My strategy
I'm waiting for a pullback to around $93 for an initial entry (75% of what I'm willing to invest in this). If the weakness continues, I will dollar cost average at around $75 -- however, at present I don't feel we will see the $75 price point. But we have a whole 2021 left, so I can wait.
NOTE: For me I will not be looking to swing trade ArkK, and am okay if this ship sails before I get a chance to hop on, so please plan your strategy accordingly. My outlook for ARKK currently is 12-24 months if I get the orders filled at my targeted prices. My 2022 price target for ARKK is $195-215 which will be 2x ROI.
Let me know if you're actively in ARK ETFs and what are some of your targets.
Good luck!
