IYR Elliott Wave Analysis: Pullback can Provide Buying ChanceHello Traders,
In this Elliott Wave Analysis, we will have a look at the Real Estate ETF (IYR).
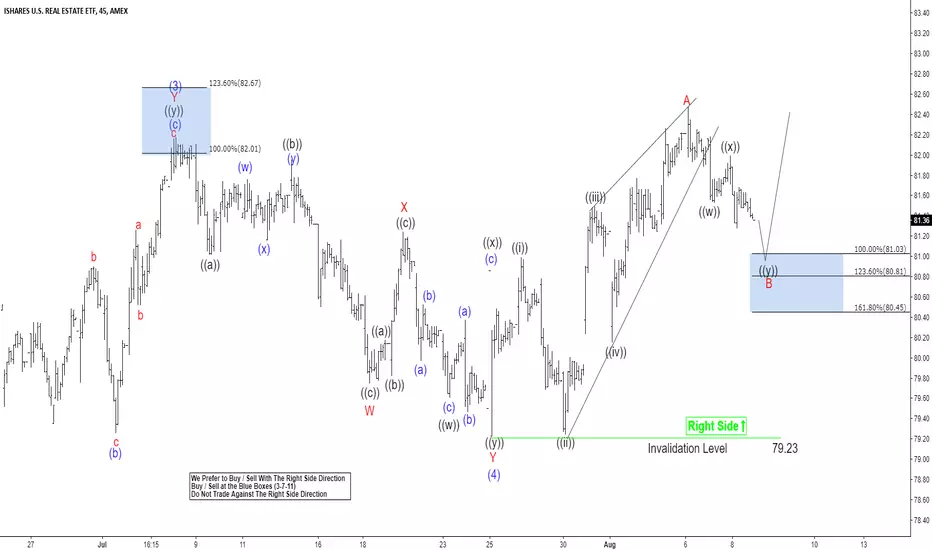
IYR ended the cycle from 03/23/18 (72.71) low at the peak of 07/06/18 (82.20) in blue wave (3). Below from there, the ETF ended the correction from 07/06/18 (82.20) peak in blue wave (4) at 79.23 low. Up from there, it broke already to new highs, confirming that the next extension higher has started.
Near-term IYR ended the correction from 07/06/18 (82.20) peak in blue wave (4) at 79.23 low. The internals of blue wave (4) unfolded as Elliott Wave double correction which ended red wave W at 07/18/18 low (79.76), red wave X pullback at 07/19/18 peak (81.26) and red wave Y of blue wave (4) at 07/25/18 (79.23).
Up from there, the ETF ended the cycle from 07/25/18 low in red wave A at 08/06/18 (82.50) peak. The internals of that move unfolded as a leading diagonal where it ended black wave ((i)) at 07/26/18 low (81.01), black wave ((ii)) pullback at 07/30/18 low (79.24), black wave ((iii)) at 07/31/18 peak (81.51), black wave ((iv)) at 08/01/18 low (80.15) and finally black wave ((v)) of red wave A at 08/06/18 peak (82.50). The ETF is currently in the progress of correcting the cycle from 07/25/18 low (79.23) in 3-7 or 11 swings in red wave B.
Near-term focus remains towards 81.03-80.81, which is 100%-123.6% Fibonacci extension area of black wave ((w))-((x)) to end red wave B pullback. Afterwards, the ETF is expected to find buyers for red wave B higher ideally or should do a 3 waves reaction higher at least. We don’t like selling it into a proposed pullback as the right side remains to the upside.
Etfs
Food for thoughtSo with Venezuela looking to Bitcoin and Dash, rumors of ETFs coming to town, is that surprising that we might be looking at a possible early turn from the bear market,
Purely speculation, but an interesting thought non the less
Chart is LOG

The Effect of Futures Expiration and ETF Decisions on BTCAll traders and investors should be aware of two sets of key dates in BTC:
1) The date that Bitcoin Futures contracts expire (shown on the chart in black in the past, and orange in the future)
Futures contracts let traders bet on whether the price will rise or fall, without actually having to hold bitcoins. Whilst in principal the start of these should push the value of BTC up, the dates that these contracts expire has never coincided with a bullish few days in Bitcoin (although the effect, if indeed there is correlation, thankfully seems to be short term). In fact the very first futures expiration was December 17th 2017... coinciding with Bitcoin dropping like a rock from it's all time high of the previous day! This may have been coincidental, or the futures expiration just might have been the trigger for the beginning of the correction, which is always inevitable and necessary after a huge pump.
Regardless, the next Bitcoin Futures contract (by CME) expires tomorrow 27th July and hence is unlikely to coincide with a bullish period. The epic bull run to a new all time high is more likely to come with my next point...
2) The date that a decision is given on a Bitcoin ETF (shown on the chart in green)
If you haven't heard of the various Bitcoin ETF (Exchange Traded Fund) applications which have been filed you really should do some research - they will open the floodgates to literally billions of dollars from retail traders and individual accredited investors in the US public market and is widely anticipated to mark the start of the next moon shot in BTC. The US SEC (Securities and Exchange Commission) are due to give their next ETF decision on August 16th, although this is widely expected to be delayed to September. However market sentiment remains positive on the impending decision and likely the reasoning behind the recent pump in BTCUSD as this anticipated approval is being priced in. I say "anticipated", but well-connected individuals may already have been advised of which way the decision is going to go. On the other hand, this could be a bull trap, it's very hard to say.
"With the release of an ETF, this allows investors to add BTC to their retirement portfolio. Global Pensions Market: $41.3 trillion. If BTC captures just 1% of global pensions, that would create $413,000,000,000 of exposure for cryptocurrencies."
These Bitcoin Futures expiration and ETF decision dates may or may not be included in your trading and investment strategies, but they are at the very least worth being aware of.
Please give me a thumbs up and follow me if you found my analysis interesting. This is for educational purposes only and not a recommendation to buy or sell.

Vaneck Index Fund bearish outlook towards the end of 2018The Indonesian stock exchange is down and so is Vaneck's Vector Indonesia fund (not just stocks). There are signs of a post-corrective rally in the Jakarta Composite Index 45.
On the face of things however, it seems hard to make the same determination about Vaneck's Indonesia Index as it appears to have just completed wave A down and some of the way through the wave B rally (so it seems to be around half-way through its corrective phase).
In the short-term it seem likely that the current rally will go up ~5% to around $22 and the re-commence the final corrective phase down.
There doesn't seem to be any clear tendencies in wave C extensions: some as low as 0.618 extension of wave A and some as much as 1.618. Mainly based on the signs of recovery within the Jakarta Stock Exchange (which will help the Bank stocks that seem to make up a significant portion of the ETF) I wouldn't expect much more than a 0.618 wave A extension for wave C - which would mean an 18% decline at a minimum before the end of the year.
I am not a professional, this is just for my own education. All care and no responsibility - just like the people that manage your investment portfolio :) If I can spend 5 minutes on the chart and correctly (we will see ay - I could be wrong) pick it going down 18% or more then what are the professionals doing to protect your investment?
I wouldn't mind a like or two - some posts have ~100 views per like. Let's see how it develops. This is 100% technical analysis and comprises 0% fundamental analysis. There are vast benefits to conducting your own research (if you have time).
I chose this ETF randomly and have no investment in it or any other link to it either now or in the past.

BTC Possible Approval of ETF, SKY is the Limit. T.OFFThe same behavior of gold, where prices boomed after the introduction of the ETF investment opportunity.
For institutional money, buying into an ETF would mean not having to deal with technicalities and exchanges.
Gold ETFs hold the physical metal, and hence have increased demand for spot gold and boosted prices...
If the approval for a Bitcoin exchange-traded fund succeed, the cryptocurrency market could potentially experience a never-before-seen influx of capital as institutional capital, speed traders, and accredited investors move into the crypto space for the first time.
Even if the approval does not happen, speculation and therefore volume should keep growing until the decision.
The Bitcoin ETF proposal, submitted as “Notice of Filing of Proposed Rule Change to List and Trade Shares of SolidX Bitcoin Shares Issued by the VanEck SolidX Bitcoin Trust” on June 26, is currently under consideration by the US Securities and Exchange Commission.
A decision from the SEC regarding the filing is likely to occur near August 10 - 16 — the submission of a filing to the SEC is followed by the publishing of a notice in the Federal Register, which occurred on July 2. The SEC typically has 45 days to make a ruling on a proposed rule change, which would leave the final date for a decision on Bitcoin ETFs as halfway through August.
What do you think about it? Will it be approved?
Any Ideas?
Stay Tuned.
Good Luck and Good Profit
M.W.

Elliott Wave Analysis: VOX in a Turning AreaHello Traders,
Today we will have a look at the VOX ETF in the 1-hour chart.
Near-term the ETF ended the cycle from 06/28/18 low (84.09) in blue wave (1) at the peak of 07/12/18 (88.26). The internals of blue wave (1) unfolded in a 5 waves Elliott Wave impulse with an extended red wave 3, where it ended red wave 1 at the peak of 06/28/18 (85.43) and red wave 2 pullback at the low of 07/02/18 (84.16). Up from that low, red wave 3 ended at 07/10/18 peak (88.04) followed by a pullback in red wave 4 at the low of 07/11/18 (87.11). Up from there, it ended red wave 5 of blue wave (1) at the peak of 07/12/18 (88.26).
Below from that peak, VOX is correcting the cycle from 06/28/18 low, where red wave W ended at 07/17/18 low (86.75) and the correction in red wave X ended at 07/17/18 peak (87.79). Below from there, the ETF has reached the equal legs extreme from 07/12/18 peak at 86.31-85.96 areas where we are now expecting a reaction higher.
As long as the pivot at 84.09 low in our proprietary distribution system stays intact it should resume the rally. We don’t like selling it as the right side remains to the upside in the sequences of 3-7-11 swings.

its a traphoosier craw daddy says that this may be a bull trap coming in the next couple months. we are at the peak of second stage bull market cycle, but price will revert back to mean. usually third quarter gets more mean reversions. no idea what arbitrage will bring, but watching. just identify cycle, decide best sectors, strategize

INDL 3X ETF TRADETrade at 75 Buy to 80 Sell for Bounce Attempt Back in The Cloud.
It May Fail before it hits Cloud.

Trade War Volatility! VIXY Pending a BreakoutVIXY is getting ready for a breakout. Currently testing the MA30. If it passes this test with a strong move above, I think this is a buy. Wait for a retest of the MA30 before entering.

OILU Reaches Bottom of 12 Month TrendlineOILU (3x Leveraged Oil ETF) has reached the bottom of a 12 month trendline. Given the age of this trendline it's likely to hold and we're likely to see higher levels. This should be an easy one to trade with a tight stop.

#BOTX #ETF bouncing off #SMA200 - #trading #stocksNice bullish setup on #BOTZ, yesterday's candle was a bullish rejection candle right at static support (yellow box) and SMA200; this confluence might be confirmed by today's candle. If it closes bullish it's a good opportunity to buy for the mid/long term.

$LRGF - WEEKLY REVIEWMulti-factor ETF through ISHARES - seems to have broken a resistance on weekly basis & RSI has been rising 3 weeks in a row - A safe 7% gain over the next 5-7 weeks?

Oil Bullish Push Still A RealityTrend - Bullish
Indicator - 52 Week High
Chart - Weekly
Strategy - Long term bull move
Target - Should reach $13.25 before too much pressure
Exit - Will exit if pair closes with a touch of the 52 week low.

Top Biotech ETFThis is CNCR Loncar Cancer Immunotherapy ETF, it is trading +25% year to date, some of its 30 holdings are ATRA, IOVA, NKTR, JNCE, BGNE, ACEN, 64% in Micro Cap, last price $30.60, expense ratio 0.79%. We are bullish on it and you could too.

ERX- Energy ETF bounce playerx after an incredible run has pulled right back to major support with markets going green here we could be in for a multi-day bounce here. this looks decent for a swing entry with a 2 dollar stop . there is no resistance till the 35-36 area for a first target


GASL LongNatural Gas will have a supply side constraint due to lower production volumes and a demand uptick due to cold winds affecting US coast. This will result in a upward tick in the stock.
Also based on the technical analysis, a strong upward trend can be observed. The average volume is also increasing which predicts a higher price in the future.
Hence long with USD 30 target

#Uranium ETF: A Breakout Or Another Meltdown?$URA is showing interesting chart pattern nearing a breakout above resistance marked on chart #stockmarket #stocktrading $CCJ #ETFs #stocksignals

Short on related ETFsMy first idea in a long time haha. There is Bearish doji/top today with its high touching the 10-day SMA. ON top of that, there was a .382 retracement of the the initial pull back of the upward break of the slightly bullish flag. The inverse of .382, 2.618 is around historical support and the bottom of the slightly bullish flag.

JO Analysis (Pennant Forming)Some chart analysis of JO... Short term supports and resistances as well as long term trend shown.

$IYT - Dow Transports - Short Trade Thesis:
Short Dow Transports
The name is showing price weakness as it is wedged between 8 Day and 21 Day Moving average.
I will be monitoring this to see how the trend plays out.
Confirmations:
1. Lower lows and lower highs on Day chart
2. Lower lows and lower highs on Week chart
3. Below 8 Day EMA
4. Doji indicating price indecision on Week chart
Trade:
Short $IYT

Natural Gas ETF long I'm all about generating ideas off of the storm hitting the Gulf right now. With an anticipation in increasing high natural gas prices, I'm looking at this chart. A good buy for me is around 21.55 with an initial target of 23.13, where I will take 2/3 profits and move my stop up from 21.20.
As a disclaimer, this post and previous and future posts are my opinions only. Do not make investment decisions off of my ideas. This is not official advice.
