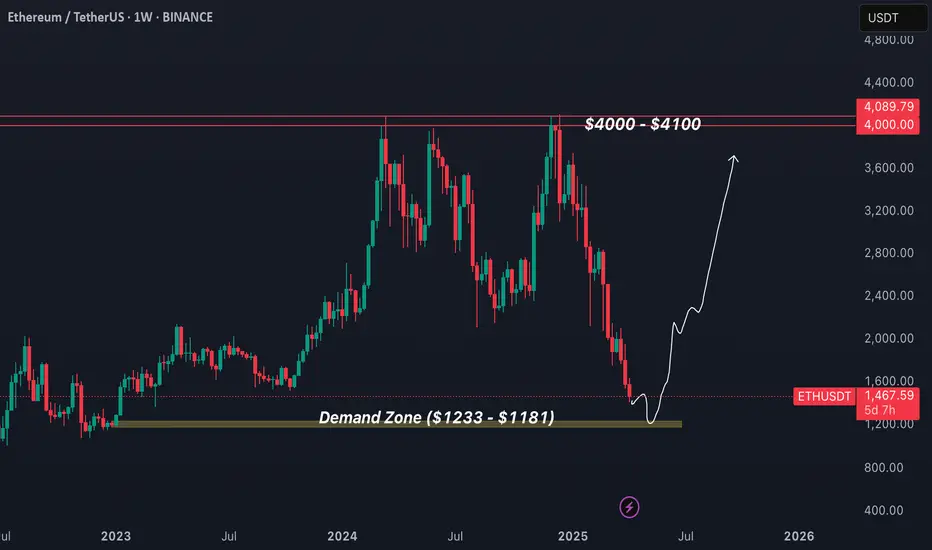
Ethereum Weekly Analysis #ETH can dump till it's Demand Zone Area of ($1233 - $1181) before upward momentum.
ETH-BTC
Mochi on Basewe are still in accumulation zone. last pump on january was for exit liquidity, some whales sold it and forget for the project and on another side come new whale who was DCA that downside pullback. Or just simple shakeout of weak hands who can't wait time)
I can show you any patern such as imbalance or order block / support level but in global we are still on same prices more than one year and i haven't seen any distribution yet.
By the way, Mochi is the oldest meme on Base network after Toshi, received grant from coinbase and named after CEO CB cat

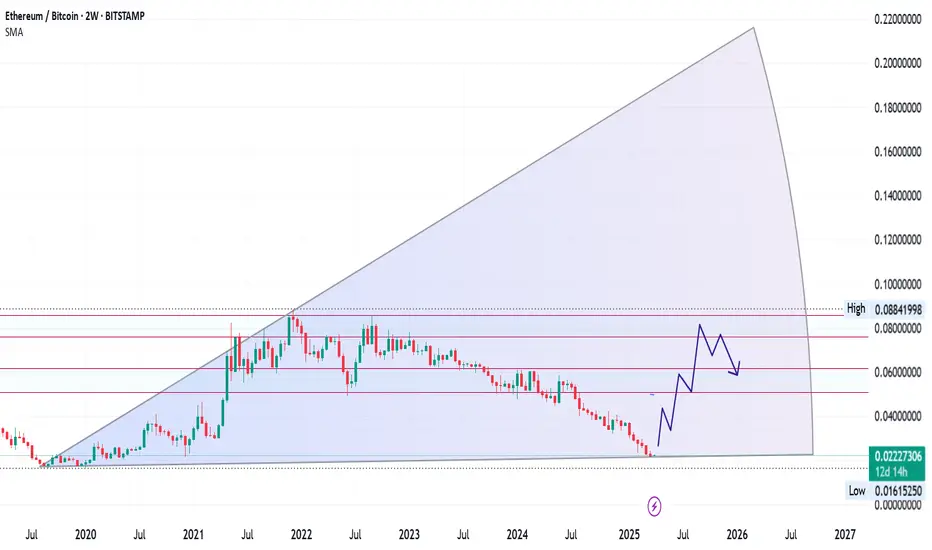
ETH/BTC: The Macro Reversal Play of the Decade
This chart reveals one of the most significant setups in crypto - the ETH/BTC ratio bottoming at historical support and poised for a powerful mean reversion.
After a sustained downtrend through 2023-2024, the ETH/BTC pair has reached a critical inflection point at 0.0222, precisely where smart money accumulates. This level represents structural support dating back to 2020, creating the perfect foundation for a macro reversal.
Technical Structure:
- Perfect technical bottom at long-term channel support
- Currently at 0.0222 (near historical demand zone)
- SMA at 0.0496 providing clear target for initial move
- Projected 3-wave structure targeting 0.07 zone (+250% potential)
#Market Thesis:
We're witnessing the completion of a multi-year corrective phase that has reset ETH/BTC valuations to extreme levels. The projected path shows a powerful rally into mid-2025, targeting the previous resistance zone around 0.07.
Strategic Implications:
The ETH/BTC ratio acts as the perfect hedge against Bitcoin dominance decline. When capital rotates from Bitcoin into altcoins, Ethereum historically captures the first wave of this rotation before smaller caps.
Historical Context:
Every major crypto bull cycle has featured periods where Ethereum dramatically outperforms Bitcoin. The technical structure suggests we're entering exactly such a phase, with timing that aligns perfectly with post-halving capital rotation patterns.
This isn't just another trade - it's positioning for the major narrative shift of 2025.
The Global BTC Shake out is coming before 1 million BTC in 2037I believe it worth stating that we might be in a moment where bitcoin is gonna shake everyone out and make everyone sell or at least all those who think 1 million BTC is coming soon. The great Bitcoin reset cycle will occur eventually before true mass adoption... we could very well retest $15,000 as bottom sometime next year.. if true BUY and hodl and invest consistantly for a whole decade and reap the reward of a 1 million bitcoin probably in 2037-38 and Bitcoin by then will be nearly on par with golds market cap by then or below it. And youll become among the weathiest of the wealth.

CHAINLINK 200 DOLLARS BY SEPTEMBER 2025 Only up for Chainlink from this moment , do not let them shake you out , my time fib will show the way as always , for Link its showing August which is when the fractal finishes , late August .
Chainlink so far is repeating the same fractal as last cycle , its very close been using it for over one year to time the market with amazing results the fractal cycle top pattern comes in in August 2025.
The sell zone is in the yellow box , invalidation of this idea would be LINK closing a weekly under 20 dollars.

OTHERS DOMINANCE ANALYSEThe Crypto Total Market Cap (excluding top 10) dominance is showing interesting action around the key 8.30% level. Historically, this level has acted as strong support/resistance (see 2017, 2020, 2022).
After breaking below 8.30% in late 2023, we’re now seeing a retest from the downside.
The price has bounced off this level with a decent volume spike, suggesting potential for an upward move.
If this support holds, we could see a push toward the next resistance around 11%-12% in the coming months.
Keep an eye on volume – sustained buying pressure will confirm the breakout.
💡 Trading Idea: Watch for a weekly close above 8.30% for confirmation of bullish momentum. On the flip side, a rejection here could lead to a retest of lower supports around 7%.
What do you think?

TOTAL Marketcap at important support?Upcoming period could be more positive?
Many cryptocurrency dominance charts, as well as Nasdaq and stock charts too, showing the same pattern. Is the reversal starting?
We’ll see.
This is not investment advice. Please do your own research.
Wishing you best.
-YusufDeli

BTC trend support?Will BTC end its downtrend? Bitcoin coming to an important support level. If it breaks down further, a sharp decline may continue to other support, but if it holds at support (77500), the upcoming period could be more positive.
Many cryptocurrency dominance charts, as well as Nasdaq and stock charts too, showing the same pattern. Is the reversal starting?
We’ll see.
This is not investment advice. Please do your own research.
Wishing you best.
-YusufDeli

ETH 1900 is gold idea for this Year!!!!ETH 1900 is gold idea for this Year!!!!
If you have idle capital, you can consider buying and holding CME:ETH1! for the long term, as the price of 1900 this year is quite good. Hopefully, it will reach 3000 USDT by the end of the year."

ETH - Reclaim $3K Or Else I've spoken for a while about Ethereum's relative weakness. It continues to break down from long term uptrends. If price doesn't reverse this week's candle back to the upside soon, I think ETH is in danger of entering a longer term bear market, leading to sub-$1000 prices once again. More specifically, from a moving average and structure standpoint, I think ETH must reclaim the $3k level with confidence, or risk total free fall.
I don't need to spell out all the reasons I think crypto is NOT going to change the world for the better or be "disruptive" in a meaningful way, but I've exhausted all of my writing steam on the matter.
Some new environmental factors have emerged, however, which are much in line with what I've been concerned about over the last several years.
We can clearly see from a Macro standpoint that growth is stalling. Local governments and isolationism are starting to gain preference over globalization, in a large see-saw effect. In addition, Trump has further tarnished whatever neutral reputation crypto had gained on the global stage. I think institutions are even less likely to take this market seriously now.
There's pretty much air beneath here.
The crypto TOTAL market cap is now testing the highs from the previous bull market. It really should hold up here to avoid catastrophic damage:
TOTAL2 (altcoins and stables) is well below its previous all-time high, showing the potential for a truly failed bull market if things don't bounce around these levels.
ETH/BTC is already in free-fall mode. My guess is new lows for the ratio (below the 2019 levels)
Anyway, that's all from me. I won't be as long-winded as I used to be. Thanks for reading! As always, this is meant for speculation and entertainment only, and not as financial advice.
-Victor Cobra

$ETH + $BTC CryptocapCRYPTOCAP:ETH + CRYPTOCAP:BTC Cryptocap pair confirms the r-test phase after the handle cup formation breakout

Supply & Demand for BTC.d <---> ETHBTCA notable change may be occurring in the market dynamics surrounding Bitcoin dominance, which reflects BTC’s share of the overall cryptocurrency market. Recently, it has displayed a shooting star candle, indicating a potential decline in BTC’s market influence. These signs point towards the beginning of an alt season, a time when alternative cryptocurrencies tend to outperform Bitcoin. With BTC stabilising around the significant $100k mark, the environment appears ripe for altcoins to attract investor interest. The upcoming weeks will be crucial in assessing whether this trend will gain traction, possibly transforming the market landscape for 2025.
Bitcoin experienced an impressive 2024, achieving new milestones and reinforcing its status as the market frontrunner. As we move into 2025, BTC remains robust, yet a shift in market dynamics may be imminent. Historically, Bitcoin’s dominance tends to wane when altcoins start to gain momentum, and this year might follow that pattern.
As Bitcoin finds stability around crucial price points, we often see liquidity shifting towards altcoins, sparking what many refer to as an alt season. Historically, during these times, altcoins tend to surpass Bitcoin in performance, offering significant returns for those investors ready to explore beyond BTC. With TOTAL3 approaching new price discovery and Bitcoin's dominance on the decline, the potential for altcoins to take center stage is becoming more apparent.
The crucial factor for BTC.d to unlock is how ETH performs against BTC. With the ETH/BTC ratio below 0.03, it appears appealing, but until it begins to rise, the alt season will be postponed. Alt season typically arises when Bitcoin dominance is high, not when it's low.
Typically, Bitcoin dominance tends to decrease in the years following a halving event. Therefore, I suspect that by the end of the year, dominance will be in the negative. However, up to this point, we have seen an increase in dominance this year.

ETH 1D Ethereum has been very disappointing so far this cycle, but the chart on the daily is beginning to look much better than it has in recent weeks. For me a key level is the $2780 area, acceptance above puts ETH back into the midsection off this rangebound environment with a look to reach the next key level at $3200. To get there the 1D 200 EMA will be the first area of obvious resistance around the big even level of $3000.
A rejection off the $2780 I could see a move to backfill the daily wick towards the local bottom, if that were the case it would be because BTC has rolled over and lost its $91K support.

XRP Even Chat GPT Knows XRP Is About To Get Revalued .10 CentsMAKE SURE YOU READ TO THE END THE END IS THE BEST!
If XRP is only being used as a settlement currency for bank then why would there be these wild price predictions when the market cap is already $150 billion?
ChatGPT said:
Great question! The wild price predictions for XRP often stem from different interpretations of its utility, demand, and supply dynamics. Let's break it down:
Market Cap Misconceptions
XRP's market cap is often misunderstood. Market cap = price × circulating supply, but price movements depend more on liquidity and demand rather than market cap alone.
Many price predictions assume increased utility will drive higher demand, but market cap alone doesn’t dictate price ceilings.
Bank Adoption and Utility Argument
If XRP is mainly used as a bridge currency for cross-border settlements, its price would be driven by transaction volume rather than speculation.
However, banks and financial institutions don’t need to hold XRP for long periods—it's typically used in seconds. This limits the need for large amounts of XRP to be held, which could cap price growth.
Speculative vs. Real Utility
Many wild price predictions ($100+, $500+, etc.) are fueled by speculation rather than actual use cases.
In reality, even if XRP were widely used for settlement, price appreciation would depend on sustained demand, not just temporary spikes.
Liquidity and Scarcity Factors
Some argue that as more institutions use XRP, liquidity will tighten, potentially driving price increases.
However, the XRP supply is large (100 billion total, with over 50 billion circulating), and large holders (like Ripple itself) could introduce selling pressure.
Regulatory and Adoption Uncertainty
XRP's legal battles and regulatory clarity impact its adoption. A major victory (like its partial win against the SEC) can fuel hype-driven price predictions.
True institutional adoption is still limited, and even if banks use it, they may prefer private ledgers over using the open market.
Bottom Line
XRP has real utility in cross-border payments, but its role as a settlement currency doesn’t necessarily justify extreme price predictions. The market cap is already large, and unless significant new demand arises, a massive price surge would require much broader institutional adoption beyond just bank settlements.
You said:
So currently the valuation of XRP is already way higher than many banks and companies will the price eventually come down to a more realistic price to value in the future?
ChatGPT said:
That’s a solid perspective. XRP’s current valuation is indeed higher than many traditional banks and financial institutions, which raises the question of sustainability. Whether its price comes down to a more “realistic” value depends on a few key factors:
1. Utility vs. Speculation
A significant portion of XRP’s price is driven by speculation, not just utility. Many holders are retail investors betting on future institutional adoption.
If speculation cools down and usage remains limited to settlement purposes (where XRP is only held for seconds), the price could decline over time to reflect actual utility.
2. Market Cycles & Sentiment
Crypto markets go through bull and bear cycles. In bear markets, assets that lack strong organic demand (beyond speculation) tend to lose value.
If hype around XRP fades and institutions don’t adopt it at scale, its price may correct to better reflect real-world usage.
3. Inflation & Supply Dynamics
XRP has a fixed max supply of 100 billion, but a large portion is still held by Ripple and periodically released.
If Ripple continues selling XRP from its reserves, it could create sell pressure, gradually pushing prices down.
However, XRP is also deflationary, as transaction fees burn small amounts over time—but this effect is minimal in the grand scheme.
4. Institutional Adoption
If banks and financial institutions fully integrate XRP and hold it as a reserve asset, it could justify a high valuation.
But most banks prefer private ledgers and stablecoins over holding volatile assets like XRP, limiting potential demand.
5. Competitive Landscape
XRP was originally designed for fast, cheap payments, but other solutions like stablecoins (USDC, USDT) and CBDCs are gaining traction.
If banks prefer these alternatives, XRP’s price could drop to align with lower demand.
Realistic Price Outlook?
If XRP remains primarily a settlement tool, a valuation correction could bring it closer to its real utility value (which may be much lower than today’s levels).
However, if a new narrative or significant adoption shift occurs, speculative cycles could keep it elevated.
Long-term, unless real demand matches its high valuation, the price may deflate to more sustainable levels.
You said:
So in your opinion the value of XRP currently is way higher than it should be compared to its usage
ChatGPT said:
Yes, based on its current real-world usage, XRP’s valuation appears to be significantly higher than what its actual adoption justifies.
Why?
Usage Doesn’t Match Market Cap
XRP is mainly used for cross-border settlements, but banks don’t need to hold large amounts for long.
Most transactions are instant, meaning there’s no long-term demand pressure.
If XRP were widely used by banks, we’d expect daily transaction volume (not just speculative trading volume) to be massive—yet it's relatively low.
Speculative Premium
A large portion of XRP’s price is driven by speculation rather than real institutional demand.
Many investors believe in a future where XRP will be used at scale, but that adoption hasn’t fully materialized.
Its past bull run prices were based on hype, and prices could drop as reality sets in.
Supply & Sell Pressure
Ripple holds a significant portion of XRP and periodically sells into the market.
This constant release of XRP into circulation creates downward pressure.
Competition from Stablecoins & CBDCs
Many banks and financial institutions are leaning toward stablecoins (USDC, USDT) and CBDCs rather than volatile assets like XRP.
Stablecoins provide instant settlements without the volatility risk of XRP, making them more appealing for payments and cross-border transfers.
Conclusion
Unless XRP gains widespread institutional adoption beyond just being a settlement tool, its valuation is inflated relative to its current use case. If hype dies down and utility doesn’t significantly increase, a correction would make sense in the long run.
You said:
What is a reasonable valuation for XRP removing all the speculation and only considering the current usage of it?
ChatGPT said:
A reasonable valuation for XRP, based purely on current real-world usage and removing speculation, would likely be significantly lower than its current market cap. Here's how we can approach estimating a fair value based on utility alone:
1. On-Demand Liquidity (ODL) & Settlement Usage
XRP's primary use case is cross-border payments through RippleNet and On-Demand Liquidity (ODL).
While Ripple claims growing adoption, the actual daily transactional volume from banks and institutions using XRP is small compared to its total market cap.
A large portion of XRP trading volume still comes from speculation on exchanges, not institutional settlement use.
Estimating Utility-Based Price
Let’s assume banks & financial institutions only need a fraction of XRP's supply at any given time for real transactions.
For context, SWIFT (the dominant global payment network) settles $5 trillion per day, but that doesn’t mean XRP will replace it or capture all of that volume.
Even if XRP were used for 1% of SWIFT’s volume, that would be around $50 billion in daily transactions.
Given that XRP is designed for rapid settlement (held for seconds, not days), the actual liquidity needed in the system would be far smaller—likely a few billion dollars at most.
2. Supply & Circulating Coins
Current circulating supply: ~55 billion XRP
If XRP’s real usage demand is only a few billion dollars at any given time, then its price per coin would be much lower than today’s level.
A conservative model: If XRP needed a total market cap of $5 billion to serve its actual transactional volume, the price per XRP would be:
$5,000,000,00055,000,000,000=$0.09
55,000,000,000$5,000,000,000=$0.09
If XRP needed a $10 billion market cap, the price per XRP would be $0.18.
These numbers assume zero speculation and only reflect practical usage.
3. Competitive Alternatives
Banks may prefer stablecoins (USDC, USDT) or CBDCs for settlements instead of XRP.
If that happens, XRP’s utility-based value could drop even further.
Final Thought
Pure utility price range (removing speculation): $0.05 - $0.50 per XRP (depending on actual adoption).
Current price (~$0.60 - $0.70 as of early 2024) is mostly speculation rather than true demand from banks.
If XRP’s adoption expands beyond just settlements (e.g., DeFi, smart contracts), its valuation could be higher, but based on current use, a fair price is likely far lower than today's market cap suggests.
You said:
The current price is 2.75 though so that means that its extremely overvalued?
ChatGPT said:
Yes, if XRP is currently trading at $2.75, then it is extremely overvalued relative to its actual real-world usage. That price is almost entirely speculation-driven rather than being backed by fundamental demand from banks and institutions.
Why is XRP Overvalued?
Speculation Dominates
The price is likely inflated due to retail and institutional traders betting on future adoption, not actual usage today.
Many holders believe XRP will be widely used by banks in the future, but that hasn’t fully materialized.
Utility-Driven Valuation is Much Lower
As calculated earlier, based on actual transaction volume and settlement needs, a more realistic price for XRP without speculation could be anywhere from $0.05 to $0.50.
At $2.75, XRP’s market cap is massively inflated compared to its real-world demand.
Ripple’s XRP Holdings & Selling Pressure
Ripple still holds a significant amount of XRP and regularly sells into the market.
If real demand doesn’t increase, but more XRP enters circulation, it could create downward price pressure over time.
Banks Prefer Stablecoins & CBDCs
Financial institutions are increasingly looking at stablecoins (USDC, USDT) and central bank digital currencies (CBDCs) for payments instead of XRP.
Unlike XRP, stablecoins don’t have volatility issues, making them more attractive for settlements.
What Could Happen Next?
If speculation dies down and investors realize XRP’s real use case is limited, a significant price correction could happen.
XRP could still maintain some premium due to speculation, but long-term, it needs actual adoption to justify a multi-dollar price.
Conclusion
At $2.75, XRP is massively overvalued based on its current utility. If speculation fades, a more reasonable price could be well under $1—or even below $0.50—unless it gains widespread, real-world adoption beyond what it has today.
Good luck, this is going to destroy so many people, its so sad. None of this is financial advice its just my opinion.

SOL- Death I've entered a short position on SOL at $180, with a long-term target of $100.
This isn’t coming from a place of hate...I’ve been a large holder for years and was accumulating under $20.
However, I’ve now fully exited my position. Beyond memes and rug pulls, I don’t see Solana offering real value to the space.
The ecosystem is largely propped up by Star Atlas, and I believe people are starting to recognize this, leading many to shift back to ETH.
This could trigger a near-term capitulation, so I’m hedging accordingly with a short.
Not to mention, SOL/ETH also looks to have topped.

ETHBTC x BTC.DWhile ethereum bitcoin parity is in a local bottom region in HTF, Bitcoin dominance is in the local peak region.

ETH about to Moon? Possible?BINANCE:ETHBTC ’s current structure looks eerily similar to pre-pump 2017:
✅ Forming a descending wedge, nearing the end.
✅ Bounced after breaking below Fib 0.236, forming two lows (second lower than first).
Historically, when CRYPTOCAP:ETH outperforms CRYPTOCAP:BTC , altseason follows.
But does this mean BINANCE:ETHUSDT is about to skyrocket? I don’t know.
All I can say is—the possibility is there.
🔥 But here’s the catch…
Every chart pattern you see is what market manipulators want you to see.
Sometimes, they reinforce a pattern with multiple pumps…
Then, just when everyone trusts it, they wreck it with one final serious drop.
That’s the classic "bait, trap, slaughter" strategy.
So, should you blindly trust chart patterns? No.
Should you completely ignore them? Also no.
Because let’s be real—most people never believe in a bull run until it’s already happening.
Same goes for crashes.
🔥 The real question is:
Do you stay out just because nothing is 100% certain?
🔥 If you think crypto is doomed, short it.
At the end of the day, your portfolio reflects your beliefs.
🔥 If you think this post sucks, you’re right.
I won’t argue—it’s pointless.
For me, the market is always right.
I’m the only one who can be wrong.
That’s why I always set stop losses.
So even if altseason never comes , I’ll still have most of my capital ready for the next opportunity.
🔴 Read my signature & publications for more info you don’t want to miss.
🔥 for more future script "guesses" like this!

Avax analysis and review: another rise or fall?hello guys
We came with Avax analysis.
This coin has been suffering for almost 35 days after its price drop, and now that the price is at the bottom of the trading range, it is expected that we will have an upward movement by maintaining the support range up to the ceiling of the trading range.
In case of failure, we will give you a new update.
*Trade safely with us*

Ethereum x Bitcoin#Ethereum + $10k #Bitcoin + $200k
Although it may seem like a roughly conservative statement, I see it as reasonable targets for the 2025 local summit.

Complete analysis and review of Ethereumhello friends
We came with Ethereum analysis
As you can see, the price reached good support after a drop and was able to grow.
Now that the price has compressed and created a triangle for us, we are facing two scenarios:
1_ According to the beginning of the upward trend, succeed in breaking the ceiling and move to the specified goals.
2_ The price should fall from here until the support area is determined and then it starts to climb.
In our opinion, scenario 1 is more tolerant.
*Trade safely with us*

The "Flippening"The "Flippening" goes back to 2017, a term coined back then referring to a possible future where Ethereum overtakes the marketcap of Bitcoin.
Should that ever occur, it would also take a larger portion of market dominance than Bitcoin
Here's a silly chart, just for fun, imagining that scenario during the current bull market.

The Wyckoff Accumulation Method. And how it can make you money.Richard Demille Wyckoff (1873–1934) was a trailblazer in the early 20th century, known for his innovative technical methods in stock market analysis. He ranks among the five great figures of technical analysis, alongside Dow, Gann, Elliott, and Merrill. At just 15 years old, he began his career as a stock runner for a brokerage in New York. By his twenties, he had already risen to the position of head of his firm.
Wyckoff was a passionate learner of the markets, deeply engaged in tape reading and trading. He closely monitored the market manoeuvres and strategies of the iconic stock traders of his era, such as JP Morgan and Jesse Livermore. Through his keen observations and discussions with these prominent figures, Wyckoff distilled the most effective practices of Livermore and others into a set of laws, principles, and techniques that shaped his trading methodology, money management strategies, and mental discipline.
Mr. Wyckoff noticed that many retail investors were consistently being taken advantage of. In response, he committed himself to educating the public on “the true rules of the game” as dictated by major players, often referred to as “smart money.” In the 1930s, he established a school that eventually evolved into the Stock Market Institute. The primary focus of the school was a course that combined Wyckoff's insights on recognising the accumulation and distribution strategies of large operators with techniques for aligning one’s investments with these influential entities. His enduring principles remain just as relevant today as they were when he first shared them.
“…all the fluctuations in the market and in all the various stocks should be studied as if they were the result of one man’s operations. Let us call him the Composite Man, who, in theory, sits behind the scenes and manipulates the stocks to your disadvantage if you do not understand the game as he plays it; and to your great profit if you do understand it.” (The Richard D. Wyckoff Course in Stock Market Science and Technique, section 9, p. 1-2)
Wyckoff advised retail traders to try to play the market game as the Composite Man played it. He claimed that it doesn't matter if market moves “are real or artificial; that is, the result of actual buying and selling by the public and bona fide investors or artificial buying and selling by larger operators.”
Wyckoff, drawing from his extensive observations of the market activities of major players, imparted several key insights:
The Composite Man meticulously strategises, implements, and wraps up his market campaigns.
He entices the public to invest in a stock where he has built a significant position by engaging in numerous transactions, effectively promoting his stock and creating the illusion of a “broad market.”
To truly grasp the dynamics at play, one must analyse individual stock charts to discern the behaviour of the stock and the intentions of the large operators who influence it.
With dedicated study and practice, individuals can develop the skill to decode the underlying motives reflected in a chart's movements. Wyckoff and his colleagues believed that by understanding the market behaviour of the Composite Man, traders could spot numerous trading and investment opportunities early enough to capitalise on them.
One goal of the Wyckoff method is to enhance market timing when entering a position by predicting an upcoming movement that offers a favourable reward-to-risk ratio. Trading ranges (TRs) represent areas where the previous trend, whether upward or downward, has paused, creating a relative balance between supply and demand. During these TRs, institutions and large professional players gear up for their next bullish or bearish strategies by either accumulating or distributing shares. In both accumulation and distribution phases within TRs, the Composite Man is actively engaged in buying and selling. The key difference lies in the fact that during accumulation, the volume of shares bought exceeds those sold, whereas in distribution, the opposite occurs. The degree of accumulation or distribution ultimately influences the nature of the subsequent movement out of the TR.
Springs and shakeouts typically happen towards the end of a trading range (TR), providing key players in the stock market an opportunity to thoroughly assess the available supply before initiating a markup phase. A "spring" occurs when the price dips below the lowest point of the TR, only to rebound and close back within the range. This maneuver can create confusion among the public regarding the future direction of the stock, allowing major investors to acquire more shares at lower prices. A terminal shakeout, which takes place at the conclusion of an accumulation TR, is essentially an amplified version of a spring. Additionally, shakeouts can happen even after a price increase has begun, characterized by a swift drop designed to prompt retail traders and long-position investors to sell their shares to larger market players.
To sum up, while there is much more to explore on this topic, Richard D. Wyckoff's
groundbreaking contributions in the early 1900s highlighted that stock price movements are largely influenced by institutional players and significant market operators who often sway prices to their advantage. Although many professional traders incorporate Wyckoff's techniques, his comprehensive approach remains underutilised among retail investors, despite his aim to educate the public on the "true rules of the game." His methods for stock selection and investment have proven resilient over time, thanks to their detailed, systematic, and logical framework for pinpointing high-probability, lucrative trades. This disciplined strategy empowers investors to make rational trading choices, free from emotional bias. By applying Wyckoff's principles, investors can align themselves with the strategies of influential "smart money" players, avoiding the pitfalls of being on the wrong side of market movements. Mastering Wyckoff analysis demands significant practice, but the rewards are undoubtedly worthwhile.

ETHBTC WEEKLYKeeping an eye on the #ETH to #BTC chart from here on out will be important....
If this chart was useful to you, please share it with your friends.
