ETH-BTC

OMG - The sleeping giant looks to enter new increase trendHello trading friends,
Depending on scan trading for the low time frame - OMG looks to make an interesting trend.
We will see coming time, or this will be the time for Omisego to show also them increase trend with this green cycle trend.
The best target we could see in this low time frame is the 9 USD + trend, but it could be also lower.
Same time there is no guarantee that this will happen, it's about the scan study that was done on this coin as the chance shows high.
Have a good time.
- This is not a trading call - and trade only depends on your setups.


CHiliz - The moon shot trendHello trading friends,
CHZ has shown some interesting trends - And it's still interesting for the breakout trend.
We have seen into historical trends that CHZ has done more times the whale breakouts.
There are also some nice updates coming for CHZ.
0,40+ could be a possible trend price action if the whale breakout did coming time.
its interesting to watch CHZ out coming time
Have a good time.
# this is not a trading call - trade only depending on your setups.

Daily chart ETH BTC in the handleHear is a linear regresion zoomed in on the handle of the previous post with daily candles.
Looks like it might be breaking out of this trend - let's see....

ETHBTC Cup and handle still intactSimple chart on weekly candle showing ETH in BTC prices
This is the chart to watch if you believe there is an ALT rally coming..
I LOVE multi-year chart patterns - this one is still not getting much attention, but if ETH makes a move, it'll be due to this chart ot BIT.D

Crypto Overview - 6 in 1!Hello TradingView Family, this is Richard, as known as theSignalyst.
Today, I am sharing my thoughts about the overall crypto market.
1) TOTAL - Crypto Total Market Cap
2) BTC - Bitcoin
3) ETH - Ethereum
4) USDT.D - Market Cap USDT Dominance
5) BTC.D - Market Cap BTC Dominance
6) OTHERS.D - Market Cap Altcoins / OTHERS Dominance
My Comments:
1) As you noticed, TOTAL, BTC, and ETH share almost the same chart/price action. We are overall bullish trading inside the brown channel, and now approaching the lower brown trendline acting as non-horizontal support.
We are currently stuck inside a range in the shape of a symmetrical triangle. For the bulls to take over, we need a break above the last major high (projection in green)
Meanwhile, the bears can still kick in, reject the upper trendline, to form another swing low before breaking the last high. (projection in red)
2) Regarding USDT.D it is usually negatively correlated with the overall crypto market.
For the bull run to start, we need USDT.D to break the symmetrical triangle and the 3.75% downward. (projection in purple)
Meanwhile, we can still see one more correction. (projection in blue)
3) Regarding BTC.D and OTHERS.D, these two are usually negatively correlated. For the Altcoin season to start, we need BTC.D to break below the gray area/support, and OTHERS.D to break above the last high in gray.
-------------------------------------------
If you reached so far, I want to thank you for your time and hope you find this post useful.
If you like this idea let me know in the comment section below to share Part 2 next week.
Always follow your trading plan regarding entry, risk management, and trade management.
Which scenario do you think is more likely to happen? and Why?
Good luck!
All Strategies Are Good; If Managed Properly!
~Rich

Harmoney - (ONE) THE BREAKOUT POWER LINE Hello trading friends,
This is an extra update for ONEUSDT DEPENDING on the last trends.
Harmoney is still into positive trend and we could see coming time a breakout to 0,17+
The data shows that ONE shows an effect trading that could make some trend volume - same time manage all time the risk.
We will follow ONE coming time to see what changes it can bring, as it's now on the power line.
Markets going on their way and it can take time before it shows some results.
Have a great day.

NEAR, key BREAKOUT of the trend line!NEAR Protocol (NEAR) is squeezing to the trend line. What will happen next?
The squeeze shows that buyers are willing to buy higher and higher, and there are not enough sellers so the price rises even more.
Also, the fuel for the pump will be the traders who opened short positions and will close them at a loss, giving additional liquidity to the buyers.
It will be important to watch for false breakout of the trend line. After a false breakout, the volumes should increase, indicating the presence of a buyer.
Friends, push the like button, write a comment, and share with your mates - that would be the best THANK YOU.
P.S. I personally will open entry if the price will show it according to my strategy.
Always make your analysis before a trade.

ETH/BTC $ALTSETH/BTC showing signs of trend reversal on the Daily with price consolidating above the 30DMA. This is bullish for alts and many setups are already primed.

Eth targeting 3600Eth 2.0 staking at All time high . Bulls looking to break phycological Barrier at 3k . Possible move up to 3600 and change for bulls to take profit.

ETHBTC Looks Profitable FinallyETHBTC has set itself a double bottom which is a strong reversal signal. We have seen the breakout from the trendline with a successful test of the 50MA and the trendline itself. The 50MA has been rather troublesome of late for both BTC and ETH. Here we can see a clear indication that green days may be ahead for ETH and alts in general. Strong alts will likely do well. At the very least, alts that are destined to fall will likely see a lower high providing people exit liquidity for a rotation. You would do well to keep and eye on ETHBTC in the coming weeks. Let me know what you think!
Not financial advice. Do your own research.

ETH BTCETH BTC pair is breaking out the downtrend line major resistance. The falling wedge also broken in upward direction. If ETH BTC able to hold above this resistance line then we see good upside move in coming days. Altcoins will follow ETH and we may see some positive move soon.
#ETH BTC

Take The Stress Out Of BITCOINEveryone has this burning FOMO; take a chill pill and relax. Bitcoin is becoming institutional, whilst most people will say that means more big money in, it must go up! They miss the fact, the same big money will want to accumulate!
It's actually very obvious when you take a step back and look at the big picture.
I got a lot of stick last year for posting the Wyckoff distribution schematic (at $62,500) NOBODY believed it and hey we pinged my targets.
Once we started to see accumulation of the weekly 4, you could quickly see the levels for an extension and why we would create what is called a truncated weekly 5. I took the time to explain this in August and why the move up to the current ATH was limited at inception.
In order to understand, you need to know about money flow. Some people will call this smart money, others only know the term manipulation.
When you know what to look for, you can see the pre meditated moves - their flashing with neon lights.
I covered the COT situation back in November, which clearly showed massive short positions - Again like the distribution from the weekly 3. I posted to explain the situation and was bombarded with "we are off to the moon", "This is accumulation not distribution" Oh well, guess what we dropped AGAIN.
Who was selling the rally? Well, who do you think? I'll give you a clue - COT data painted massive shorts. Which means retail (Dumb money) buying from Wholesale (smart money) - get this, AT A PREMIUM
So jump foreword to the current situation, we are monthly 3 down to monthly 4 in the Elliott bias. Every retail trader, especially those carrying red bags. They all want the bottom to be in. Take a look at "smart money" levels.
I have used a traffic light system, Red being larger, orange medium and green local. the blue is the live level.
There are clear imbalances left un-tapped from above (important for a potential B swing)
We have a huge cluster around the 28k levels - again smart money knows where the money sits.
This key area was the first line target back in November when looking at destruction after a truncated 5th leg. Using Point and Figure extensions this range was the target, I don't feel the well has been fully tapped.
We have some logic for a long drawn out accumulation as is, my current thinking is the A is yet to complete and we are still forming a combo move within that larger leg down. This will complete before we get to witness an explosive B move to chase the liquidity and sucker more dumb money into moon calls.
If you hadn't followed the roadmap - I recently did a 3rd update.
So in summary, don't jump in, follow the "smart-money" and wait for confirmation.
Disclaimer
This idea does not constitute as financial advice. It is for educational purposes only, our principle trader has over 20 years’ experience in stocks, ETF’s, and Forex. Hence each trade setup might have different hold times, entry or exit conditions, and will vary from the post/idea shared here. You can use the information from this post to make your own trading plan for the instrument discussed. Trading carries a risk; a high percentage of retail traders lose money. Please keep this in mind when entering any trade. Stay safe.

SPX500 + ETH at SMA resistance - Gold + Bitcoin at SMA supportSPX500 + ETH at SMA200 resistance - Gold + Bitcoin at SMA200 support on 4h chart
Comparing all four charts the way up for BTC seems to be more free.
What do you think?
Drop me a nice comment if you'd like me to analyze any other cryptocurrency.
*not financial advice
do your own research before investing

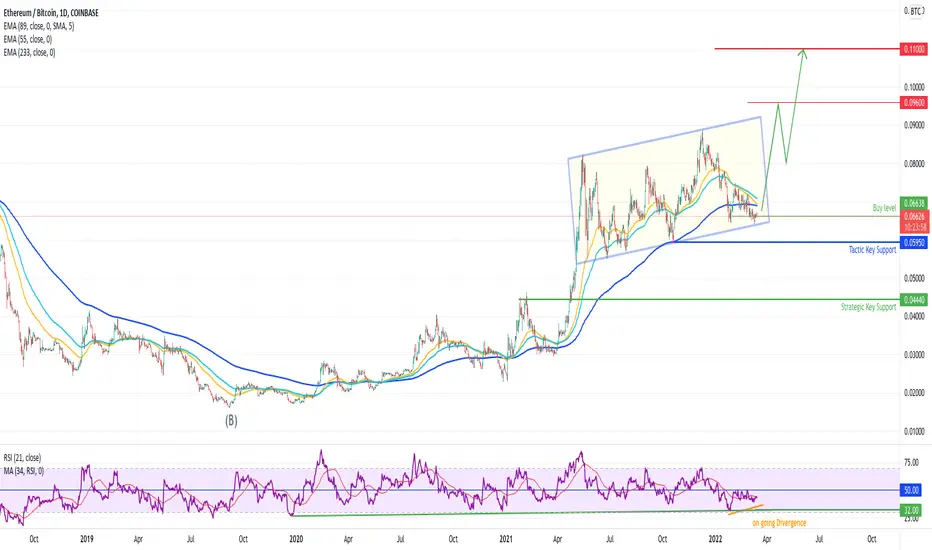
ETH/BTC at lower part of the range (Buy setup)ETH/BTC at lower part of the range (Buy setup)
Context :
Etherum is evolving wit h a clear outperfomance versus Bitcoin since the end of 2019. This ETH outperformance trend is since the last past 9 month in a pause within an ascending range (Yellow). Regarding the wave structure composing the ascending range we can conclude that the pattern is now or about to be finished and show an opportunity to catch a new significant bullish dynamic by anticipating a bullish breakout from this structure and at least a test of the previous top area in a common part scenario (Last upside leg before consolidation)
+> NEws flow : More and more article are speaking about ETHV2 , it is more than probable that ETHV2 will be full operational one day but many people into blockchain tend to say it will not be for this year maybe.... So take care... buy the news yes but the technologie can take time to be released. Also Many regulation and supervisor are banning the POW mecanism in oreder to eraze the consequence of the mining so we can't ignore that ETHV2 will be not operational before a ban of the POW from many juridiction..... (Time to check HBAR : Hedera Hashgraph which offer a significant alternative in this context)
Key Elements:
- lower part of the ascending range is support
- 233EMA is support whil the shorter period are mixed (Range config)
- an ongoing divergence on RSI can be highlighted (bearish momentum exhaution)
- Fibonacci multi level at 0,0595
Tactical View 3 to 9 Weeks
Last upside leg - As long as 0,0595 adjust the weight of the ETH and BTC in the portfolio in order to reduce the BTC exposure.
ETHETH needs few weeks to get out of the bearish. here is the expected scenario.
if you are willing to buy eth make 2 orders one in $139 and second at $1850
the worst scenario is breaks $1680

$ETH 🔎MARKET VIEW
🚦📌SHORT TERM🚦
▫️A little bit Pull back expected
🚦MEDIUM TERM🚦
▫️Bears are still in play $BTC expected to touch $36k
♟TRADING STRATEGY♟
▫️Sell the resistance

fantom Mid-term downtrendMid-term downtrend ↘️
🏴twin roof Range flag poleback points 🔛1.14 - 1.36
Best price for Hold 0.38 - 0. 40 🌹

The Bull W from HellI believe what we have is a great entry point that will never be repeated in our life time. A W pattern that is going to gather support at 2400ish and then blow up faster than any of us have seen. It will be a headline news event.
Disclaimer: I'm not giving advice and nothing I say should be taken as investment advice. Never invest more than you are willing to lose. Best of luck, I'm off to Vacation, I'll be back on the 12th, Plenty of time for this to drop down and fill my orders :)

Barts everywhere, smart money is liquidating both sides.While many think about buying or selling, the smart money keeps playing the futures market and liquidating
the shorts right now, so that they can liquidate the longs afterwards. Sideways movements like that are the best way to loose money.
Be careful.

ANOTHER DOUBLE DIP FROM ETH?ETH is very close to critical one year support. I expect 2-3 weeks range, after that direction is upwards.

matic head and shouldersa potential matic short, DYOR and trade safe.
potential target on the chart and stoploss
