HolderStat┆ETHUSD wedge-breaker momentum runCRYPTOCAP:ETH — Monster breakout from a year-long falling wedge rocketed into a rising pennant; 2.55 k acts as dynamic trendline support. As long as bulls defend that level, upside extension toward the 2.95-3.1 k sell zone resistance looks probable. Lost support opens a dip to 2.25 k structural shelf before buyers regroup.
ETH-D

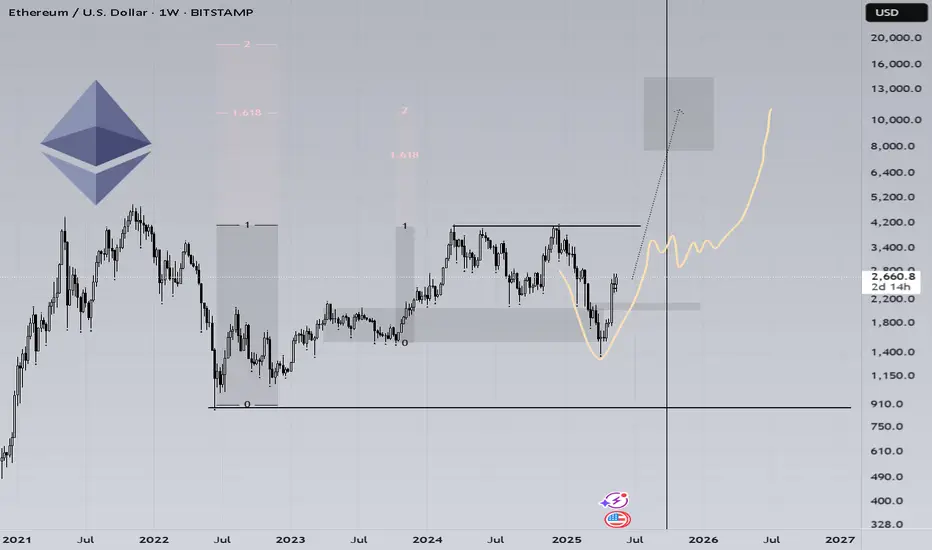
ETH 10 000$ soonAs for me, the fractial is the same)
Flashcrash in the preles of accumulation, the same good fast V-shaped reversal. BTC made 1.6 and 2 fib level, if copy paste it on ETH, it could be 10k$ easily. The dominance on the TOP, ETH/BTC on historical bottom. The cyclicality of the cryptocurrency market persists.
I would like to see June growth, going sideways at higher values closer to August. And starting in the fall to make the final movement.
ETH Continues Bullish Momentum Above Broken TrendlineHello guys!
Ethereum has shown a strong bullish rally, breaking through a long-standing descending trendline with significant momentum. Currently, price action is consolidating above the broken trendline, which may now act as a support zone.
🔹 Scenario 1 (Bullish Continuation): If ETH holds above the current range and confirms the broken trendline as support, we could see a continuation toward higher resistance levels around $3,500 and beyond.
🔹 Scenario 2 (Deeper Retest): Alternatively, a pullback toward the $2,200–$2,300 area (highlighted zone) could offer a better accumulation point before the next bullish leg resumes.
This setup suggests that as long as ETH remains above the key support levels, the bullish structure remains intact.

ALTCOIN ROADMAP: REVISITED!!! Ethereum vs NvidiaOne of the most insightful ratio charts that provides a remarkable glimpse into the vitality of Altcoins and the appetite for risk is when Ethereum outshines one of the fastest rising stars in the stock market, #NVDA!
The conventional Altcoin index indicates how many of the top 100 Altcoins are outperforming #BTC.
This is indeed a valuable metric that we can rely on for identifying peaks.
However, I believe that if we broaden our perspective and examine the ETH ratio against a Tech Titan, we can truly pinpoint the timing of the banana zone. When it starts and when it is confirmed violent uptrend.
My interest in this ratio was sparked when ETH was still a proof of work coin, validated through GPUs; it seemed like a natural starting point to assess whether the ETH price was overvalued or undervalued.
Even after the transition to POS, I still think it’s worth analysing, as shown by the recent double bottom on the ratio!
The next crucial question is when we can break the multi-year downtrend to genuinely confirm the Banana zone. Because without ETH, there’s no party.
If we enter a big strong banana zone, I believe the ratio could swiftly trend towards 100, so we will be keeping a close eye on it!

BTC Dominance forecast until the end of August 2025It is a reversal now.
From now on until the end of August 2025 BTC.D will travel south. Downtrend will be in waves with major dates in the end of June and end of August 2025.
Major correction up will happen from 59.4% to 61.67%
The end of altseason will be at the level of 57.75%
Beware of major dates. Don't get driven away by profits, because the real fortunes are made in bear markets.
For more check my profile

Ethereum flagging out gives us a setup with good RRETH is forming a nice structure that looks like a nice flag on higher timeframes. Structures allow you to create setups that include valid risk management. There is a clear volume gap below that can present some weakness.
Full TA: Link in the BIO

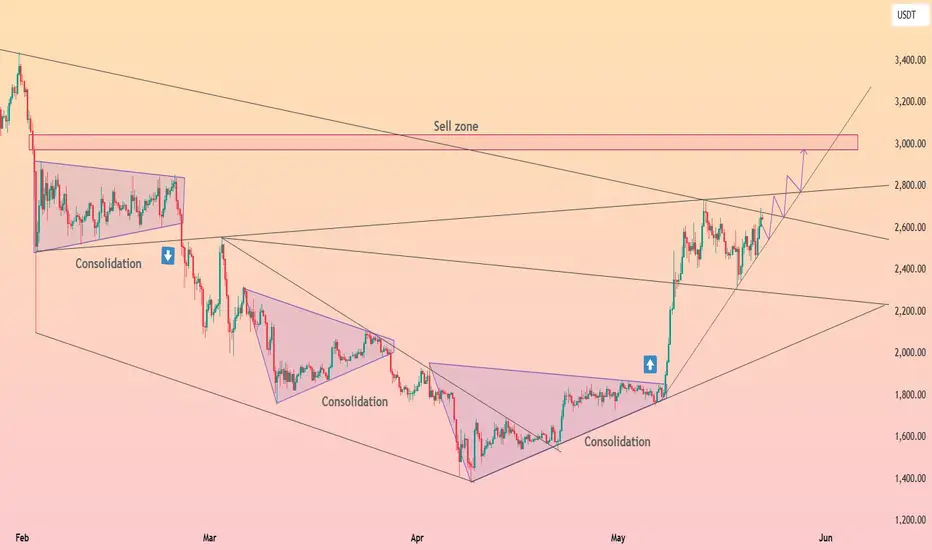
ETH USDTEthereum’s $2,328–$2,400 blue support zone was an excellent buy range. If the price breaks below this zone, the last opportunity to buy may be at the yellow support zone.
In the coming weeks, if Ethereum breaks above the green resistance zone at $2,727–$2,833, we could see new highs. I believe this breakout would signal the beginning of a new bull run.

Ethereum Breaks Above MA200, Long-Term Bullish Cycle ConfirmedThe 5-May week marked not only a major advance and recovery above the August/September 2024 low prices, but it also signals a recovery for Ethereum above MA200 long-term, weekly timeframe.
This simple signal confirms that the bulls are in. But there is more.
After breaking above this level, Ethereum closed two additional weeks green above it, both times wicking lower but recovering. So this level has been conquered, retested and continues to hold. This means that we have at least 6 months of bullish action confirmed based on the chart, technical analysis.
There are also some great signals based on the long-term.
» RSI: The weekly RSI has a strong reading (bullish) and produced a major higher low compared to June 2022. This signal matches what happened at the end of the previous bearish cycle.
» MACD: The weekly MACD also produced a long-term higher low compared to July 2022 coupled with a bullish cross. This indicator is trending full-upwards and leaves no room for doubt. Ethereum is set to grow long-term. Let me show you the MACD...
What would you do if you knew, with a high level of certainty, that Ethereum will trade at $7,000 or higher this same year? How would you take action? How best to profit from this knowledge/information?
Namaste.

SUSDTAfter forming a Diametric pattern and then correcting after that, the price is now ready to move to the specified range...

Sideways Still in Play for ETH After RejectionIf you find this information inspiring/helpful, please consider a boost and follow! Any questions or comments, please leave a comment!
Recap
Ethereum just tapped into a key Area of Interest and got rejected. The move confirmed short-term resistance while keeping the broader wave structure intact. Although no clear breakdown has followed, the rejection signals that the asset is still mid-cycle.
The expectation now is for a sideways consolidation. This aligns with a developing wave 4, but the price action ahead will determine how this structure unfolds.
Wave Structure
At present, the count favors a completed wave 3 followed by a wave 4 that is still forming. The rejection at the AOI fits the narrative of a corrective structure underway. Whether that plays out as a triangle or a flat will depend on how the next legs print.
Key markers are in place:
AOI was respected
No breakdown of the prior key support level
Above the 0.382 to 0.5 retracement zone remains in focus as a reaction area
Should price expand beyond typical retrace/time boundaries, the degree of the count may need to be adjusted. A more complex correction or a deeper reset could shift the current interpretation from a wave 4 into something more substantial.
Outlook
• Rejection confirms resistance
• Expecting sideways movement to continue
• Watching the 0.382 to 0.5 zone for key price behavior
• Price action will determine the next wave structure
• If momentum expands rapidly, degree reassessment is on the table
Ethereum’s current posture suggests a market in digestion mode. Whether this leads to a launch into wave 5 or deeper corrective behavior, the next prints will be critical. No confirmation of bullish continuation yet.
More updates soon as the next leg develops.
Trade safe, trade smart, trade clarity.

BRIEFING Week #21 : Watch out for ComoditiesHere's your weekly update ! Brought to you each weekend with years of track-record history..
Don't forget to hit the like/follow button if you feel like this post deserves it ;)
That's the best way to support me and help pushing this content to other users.
Kindly,
Phil

ETH Update: Pressed Between Key Levels on the Daily
ETH is currently pressed between the 200MA and the 50% Fibonacci level—two major areas of interest.
On May 14th, we saw a clear rejection at the 200MA, followed by solid support at the 50% Fib on May 18th-19th. 📉
MLR < SMA < BB Center isn't ideal, so we need to play it safe and let price do its thing. If we close above the BB Center and macro conditions support the move, we could see upside. 🌱
⚠️ Keep safe, follow for unbiased TA, and always manage risk! 📊

ETH - Trading at crucial resistance levelBINANCE:ETHUSDT (1W CHART) Technical Analysis Update
ETH is currently trading at $2500 range and the price is at crucial resistance zone, previously ETH had one if its largest crash after this support line was broken, now the same support line is acting as resistance.
50 EMA is also acting as a strong resistance in this are.
ETH needs to breaks this resistance to reach the next resistance around 4k USDT. if ETH cross 3K then 4k is an easy target.
Im expecting this resistance to break in next couple of weeks.
Short term target 3100
Mid Term Target 4000
Long Term Target 7000-9000a
a
aRemember to set your stop loss.
Follow our TradingView account for more technical analysis updates. | Like, share, and comment your thoughts.
Cheers
GreenCrypto

ETH - Ethereum Weekly Chart🔍 Market Structure & Smart Money Analysis:
✅ Bullish Signs:
Recent CHoCH at $2,000: Suggests shift from bearish to bullish order flow
BOS above recent resistance: Confirms upward market structure
Stochastic Oscillator: Turning bullish from oversold area (momentum confirmation)
Volume Pickup: Suggests stronger buyer interest
🧠 Liquidity Zones:
Equal Lows (EQL) seen in 2023 and again near 2024 → were taken out → classic liquidity sweep before reversal
Weak High near $4,951: A future potential liquidity target
Supply Zone around $3,200–$3,700: Previously strong resistance, could act as a rejection point again
🧭 Trend Summary:
Macro Structure: Recovering from multi-month downtrend
Short-Term: Bullish momentum building post-reversal
Next Objectives:
Bullish target: $3,200–$3,700 (possible pause or reversal zone)
Bearish invalidation: Drop below $2,000 with strong candle body
📝 Conclusion & Outlook:
ETH has likely confirmed a bullish shift on the weekly timeframe with the CHoCH and BOS above $2K.
Immediate upside targets are within the $3,200–$3,700 region before facing stronger resistance.
This could be the beginning of a longer-term accumulation → markup cycle, targeting the $4,950+ liquidity zone eventually.
Keep monitoring weekly closes and volume, and watch for divergence or rejection signals near supply zones.
-------------------
----------------------------
Low Market Cap #RWA #RealEstate #Tokenization Platforms by FDV
SQRB $100K on PROBIT
$RNB $310K
$HTS $1.9M
$STBU $3.5M
LAND $3.6M
-----
Not for recommendations to BUY SELL any stocks, cryptos, FX or securities
Not for Financial Advise
DYOR

See if it can find support near 2521.05 and go up
Hello, traders.
If you "Follow" me, you can always get the latest information quickly.
Have a nice day today.
-------------------------------------
(ETHUSDT 1D chart)
The two charts above are charts that use the HA-MS indicator to mark support and resistance points on the 1M, 1W, and 1D charts.
The chart below is just a chart with the HA-MS indicator hidden.
If you look closely at the drawn support and resistance points, you can see that the points drawn with the HA-Low and HA-High indicators are important support and resistance points.
The HA-Low indicator is marked in orange (#ff9800), and the HA-High indicator is marked in blue (#0000ff).
It is impossible to explain all the thoughts of a chart analyst in writing.
That is why it is necessary to provide objective information to the readers.
Then, it will be very helpful for you to look at the chart.
If you think that my idea has too many indicators, you can disable the indicators by clicking "Grab this chart" in the idea article.
If you look at the chart with the indicators disabled, you may think that something looks better, but since you don't know why these support and resistance points were drawn, you may not be able to properly utilize the support and resistance points drawn on the chart when actually trading.
Even the support and resistance points you drew yourself often become unreliable due to the movement of the chart over time, and you will be even less reliable when it comes to support and resistance points drawn by others.
In order to reduce this phenomenon, objective information is necessary.
For that objective information, I use the HA-MS indicator.
For the trend perspective, there is the M-Signal indicator, and for the trading perspective, there are the HA-Low and HA-High indicators.
To understand the detailed movement, we use the DOM(60), DOM(-60), StochRSI 50, StochRSI 80, and StochRSI 20 indicators.
Therefore, you can basically interpret the chart by activating only the HA-Low, HA-High, and M-Signal indicators.
-
Therefore, if we interpret the chart, if it rises from the current price position, the resistance zone is around 3265.0-3321.30, and if it falls, the support zone is around 1647.06-1861.57.
You can see that the HA-High indicator is newly created at the current price position, and the M-Signal indicator on the 1M, 1W, and 1D charts is passing, so we can see that it is at an important turning point.
Therefore, the key question is whether the price can be maintained above 2609.74 or whether it will fall below 2359.35.
However, since the HA-High indicator is newly created, it is more likely to fall.
Since the OBV indicator showed that the OBV fell below the High Line, we need to check whether it can touch the OBV EMA again and rise above the High Line.
If the StochRSI indicator falls below 50, we need to focus on finding a time to buy, and if it rises above 50, we need to focus on finding a time to sell.
Since the OBV is currently on an upward trend, if this trend continues, the price is expected to eventually rise.
-
Thank you for reading to the end.
I hope you have a successful transaction.
--------------------------------------------------
- This is an explanation of the big picture.
(3-year bull market, 1-year bear market pattern)
I will explain more details when the bear market starts.
------------------------------------------------------

ETH might be about to melt facesSentiment as negative as it could be, no real inflows for weeks - bottom sentiment? Check.
Sudden massive inflows? Check!
This is not a trade idea. If you trade this, be careful - who knows right now.

ETH (ethereum) – Massive Flag Pattern After 100% RunCRYPTOCAP:ETH – Bullish Flag After Monster Run
Ethereum ( CRYPTOCAP:ETH ) has nearly doubled since April, and now it’s cooling off — but in the best way possible: a bullish flag consolidation.
🔹 After a nearly 100% move, ETH has been consolidating tightly for two weeks — textbook flag behavior.
🔹 The trend remains strong, and this type of structure often leads to another leg higher.
🔹 Volume has tapered off during the flag — exactly what you want to see before a breakout.
Setup Overview:
Pattern: Large bull flag
Support/Risk: Defined risk to the $2500 zone
Measured Move Target: Breakout could push to $3100–$3500 based on the prior leg
Why I like this setup:
Healthy consolidation after a parabolic run
Risk/reward is favorable with structure and measured target
Potential breakout fuel from the ETH ETF narrative + BTC dominance rotation

UNI – Long Spot Trade Setup Following Breakout and RetestUniswap (UNI) has recently broken out of resistance and successfully retested it as support, forming a strong bullish structure. If Ethereum (ETH) continues upward, UNI is likely to benefit from correlated momentum, potentially kicking off a larger rally.
🔹 Entry Zone:
$5.46 – $5.95 (post-breakout retest zone)
🎯 Take Profit Targets:
🥇 $7.50 – $8.00
🥈 $10.00 – $10.50
🛑 Stop Loss:
$4.10

HolderStat┆ETHUSD pressing trend resistanceCRYPTOCAP:ETH blasted out of a mega-triangle, topping at 2.80 k, and keeps pressing along an aggressive rising trendline. Candles are marching through overlapping consolidations, each one springboarding higher; sustain footing above 2.55 k and the route to the 3.0-3.1 k sell zone stays paved. Slip back under 2.40 k and a broad retest of the prior wedge roof near 2.25 k awaits.
ETH — Bull Flag or Trap? Trade Plan with TargetsETH is setting the stage for its next major move — and the chart is packed with clues.
After completing Wave 3 at $2738.50, ETH has entered a corrective phase, forming what looks like a bullish flag. But beneath the surface, smart money levels are aligning: VWAP, Fibs, key levels, and liquidity traps are all converging around one high-probability zone.
This analysis breaks down both the long and short setups, backed by real confluence and clean R:R opportunities. Whether you’re planning to snipe the reversal near support or fade the rally at resistance, you’ll walk away with a clear trade plan and deeper insight into how price reacts at precision levels.
Let’s get into it.
🟢 Bullish Scenario: Long Setup with Deep Confluence
After a fakeout pump into the golden pocket of this minor downtrend (typical for a Sunday), ETH rejected cleanly at the upper resistance of the bull flag channel.
We're now watching for the swing low at $2406.63 to be swept, setting up a potential SFP (Swing Failure Pattern) at a highly confluent support zone:
🔍 Confluence at the $2390–$2360 Zone:
Anchored VWAP from the Wave 3 origin at $1752 is sitting at $2390
Trend-Based Fib Extension 1:1 of the correction lands at $2386.84
Liquidity pool just under the recent swing low
0.382 Fib retracement of the entire Wave 3 at $2361.66
0.618 Fib Speed Resistance Fan intersects this zone
Lower bull flag support line also aligns
This makes the $2390–$2362 zone a high-probability bounce area.
📌 Plan:
Laddered long entries between $2390–$2362, watching closely for a clean SFP or reversal signal.
Target 1: $3000 psychological level
Target 2: 0.618 Fib retracement at $3067.71 (potential Wave 5 top)
Stop-loss: Below previous yearly open (can be tightened after confirmation)
R:R: 1:5 or better after SL adjustment
🔴 Bearish Scenario: Short Setup at Key Rejection Zone
If ETH makes a move up to complete the 5th wave, we monitor $3067.71 — the 0.618 retracement of the entire corrective leg — as a key resistance.
If price rejects here with momentum loss or bearish structure:
📌 Plan:
Short on confirmed rejection of $3067.71
Stop-loss: Above $3211 (above 0.666 Fib)
Target: Previous high near $2700 or lower
R:R: 1:2 or better depending on entry and structure
🧠 Educational Insight: Why Confluence Increases Probability
Many traders chase setups based on single indicators. Real edge comes from stacking independent tools: VWAPs, Fibs, FVGs etc... When they align, the setup isn’t random — it’s high conviction.
This strategy gives you a framework to anticipate where price is likely to move and why, rather than reacting emotionally.
Patience and preparation will always outperform panic and reaction. Trade the plan — not the impulse.
___________________________________
If you found this helpful, leave a like and comment below! Got requests for the next technical analysis? Let me know.

ETH 10 000$ soonAs for me, the fractial is the same)
Flashcrash in the preles of accumulation, the same good fast V-shaped reversal. BTC made 1.6 and 2 fib level, if copy paste it on ETH, it could be 10k$ easily. The dominance on the TOP, ETH/BTC on historical bottom. The cyclicality of the cryptocurrency market persists.
I would like to see June growth, going sideways at higher values closer to August. And starting in the fall to make the final movement.

ETH - BBB - Bullish Building Block!Hello TradingView Family / Fellow Traders. This is Richard, also known as theSignalyst.
🏢 ETH Building Blocks:
📈 Short-Term Bullish:
ETH is currently bullish trading within the second floor in the shape of a rising channel marked in green.
As ETH retests the lower green trendline and $2,550 structure, we’ll be looking for short-term trend-following long setups!
📈 Long-Term Bullish:
For the bulls to remain in control medium-term and push towards the $3,000 mark, a break above the last major high at $2,750 is needed.
📉 Short-Term Bearish:
If the $2,550 structure is broken downward, ETH's momentum will be shifted from bullish to bearish leading to a correction phase towards the $2,300 support.
📚 Always follow your trading plan regarding entry, risk management, and trade management.
Good luck!
All Strategies Are Good; If Managed Properly!
~Rich

Skeptic |Ethereum (ETH) Analysis: Altcoin Rally Ready to ExplodeHey everyone, Skeptic here! Did you see Bitcoin finally smash through the $107K resistance? Now, with BTC.D dropping, liquidity’s flowing back into altcoins like ETH , which could be gearing up for some wild rallies! 😊 Stick with me for a deep dive into Ethereum’s charts. Let’s start with the Daily Timeframe. 📊
Daily Timeframe: The Big Picture
After breaking the downward curve trendline, ETH has started a sustainable uptrend. Rising volume and Bitcoin’s rally confirm this move, so we can cautiously say the weekly major uptrend is regaining steam. This gets confirmed if we hold above the daily resistance at 2886.63 . Our spot trigger is a consolidation above 2886.63 , backed by increasing volume and momentum, plus a key condition: ETH/BTC needs to be in an uptrend.
Let’s take a quick peek at the ETH/BTC chart.
For a long time, ETH/BTC was in a sharp downtrend on the daily, but recently, it’s kicked off an uptrend momentum. A break above the 0.02588 resistance would confirm ETH/BTC’s uptrend, signaling it’s time to buy spot ETH. Until that break, I don’t recommend jumping in. Always confirm with ETH/BTC—otherwise, Bitcoin is the safer buy since, if ETH/BTC stays bearish, Bitcoin will likely outperform ETH.
4-Hour Timeframe: Long & Short Setups
Let’s zoom into the 4-hour timeframe for long and short triggers. For my long setup, I’ve already opened a position after the break of 2701.33 .
On the 15-minute timeframe, rising volume and RSI hitting overbought during the breakout gave solid confirmation. It looks like it’s pulling back to this level now, but there’s a chance it could be a fakeout. I’m letting it play out—if it hits my stop loss, no big deal; I’ve got risk management in place, and one stop won’t blow up my account :) For a short setup, a break below 2381.51 , coinciding with a break below ETH/BTC support at 0.02289 , could be your short trigger. But I don’t recommend it—the major uptrend is bullish, so shorting means going against the trend, which is risky.
💬 Let’s Talk!
If this analysis sparked some ideas, give it a quick boost—it really helps! 😊 Got a pair or setup you want me to dive into next? Drop it in the comments, and I’ll tackle it. Thanks for joining me—see you in the next one. Let's grow together! 🤍
