Ethereum will retest $3,500 ┆ HolderStatOKX:ETHUSDT bounced from $2,875 and is approaching $3,100. Breakout may target $3,250 next. Bullish structure remains.
ETH-D

ETH Dominance – Golden Cross, New Era?This is ETH Dominance on the Daily chart.
A golden cross just printed, and the last time we saw this, at similar levels, was February 2020. Back then, dominance climbed steadily, bouncing off the 200MA repeatedly.
Today, price is approaching the 0.236 Fib level, which could act as short-term resistance and send us back to retest the 200MA as support.
But unlike 2020, everything has changed:
– ETH is getting institutional support via ETF flows
– The SEC confirmed ETH is not a security
– The RWA narrative is gaining serious traction
That’s why this golden cross could mean more than just a signal, it may be the start of a much stronger structural uptrend.
My humble guess?
ETH Dominance continues climbing with the 200MA as support.
It won’t be a smooth ride, but the direction might be set.
Always take profits and manage risk.
Interaction is welcome.

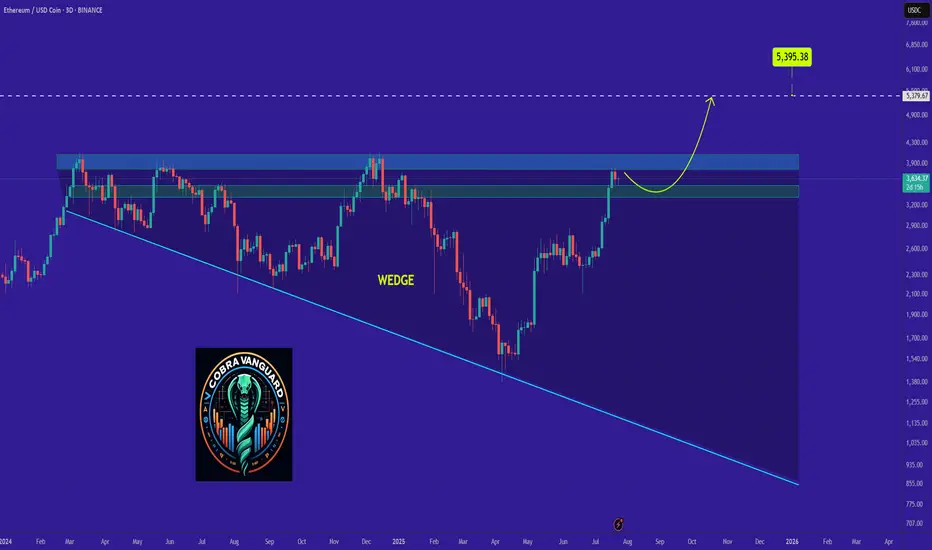
ETH's situation+ Target PredictionThe price has reached the upper boundary of the wedge, which could lead to a slight price drop. We can be hopeful that after breaking out of the wedge, we will see significant price growth.
Give me some energy !!
✨We spend hours finding potential opportunities and writing useful ideas, we would be happy if you support us.
Best regards CobraVanguard.💚
_ _ _ _ __ _ _ _ _ _ _ _ _ _ _ _ _ _ _ _ _ _ _ _ _ _ _ _ _ _ _ _
✅Thank you, and for more ideas, hit ❤️Like❤️ and 🌟Follow🌟!
⚠️Things can change...
The markets are always changing and even with all these signals, the market changes tend to be strong and fast!!
btc vs. ethBitcoin vs. Ethereum 🔃
It is obvious that Ethereum has not yet made a real run compared to other cycles compared to Bitcoin, and I think that the current correlation gap will close in the coming period.

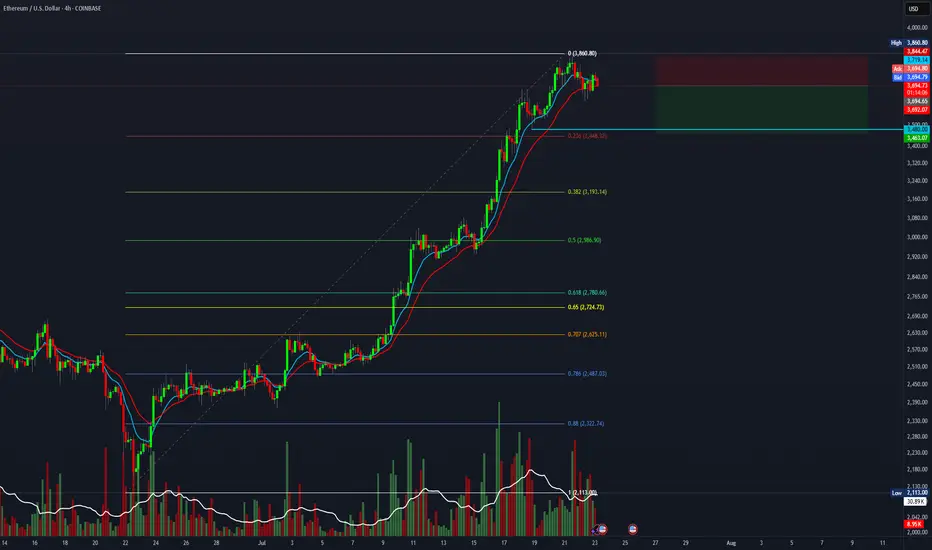
$ETH Hit Our Targets and was rejectedCRYPTOCAP:ETH hit our signal take profit target at $3820 and was rejected at the High Volume Node EQ to the penny.
That appears to have completed wave 3 of this motif wave. Wave 4 has an expected target of the R2 daily pivot and 0.236-0.382 Fibonacci retracement, $3260 before continuing to the upside in wave 5 with a target of the all time high.
This aligns with my views of a significant pullback at the end of August and September which is typical after a summer rally.
No divergences yet in daily RSI.
Safe trading

Ethereum is Trending HigherSince April trough, Ethereum has risen by 179%, delivering a higher rate of return than Bitcoin at 66%. But most of our attention is on Bitcoin, breaking above the 120,000 level.
Why is Ethereum quietly gaining ground —and what does the future hold for Ethereum?
Mirco Bitcoin Futures and Options
Ticker: MET
Minimum fluctuation:
$0.50 per ether = $0.05 per contract
Disclaimer:
• What presented here is not a recommendation, please consult your licensed broker.
• Our mission is to create lateral thinking skills for every investor and trader, knowing when to take a calculated risk with market uncertainty and a bolder risk when opportunity arises.
CME Real-time Market Data help identify trading set-ups in real-time and express my market views. If you have futures in your trading portfolio, you can check out on CME Group data plans available that suit your trading needs www.tradingview.com

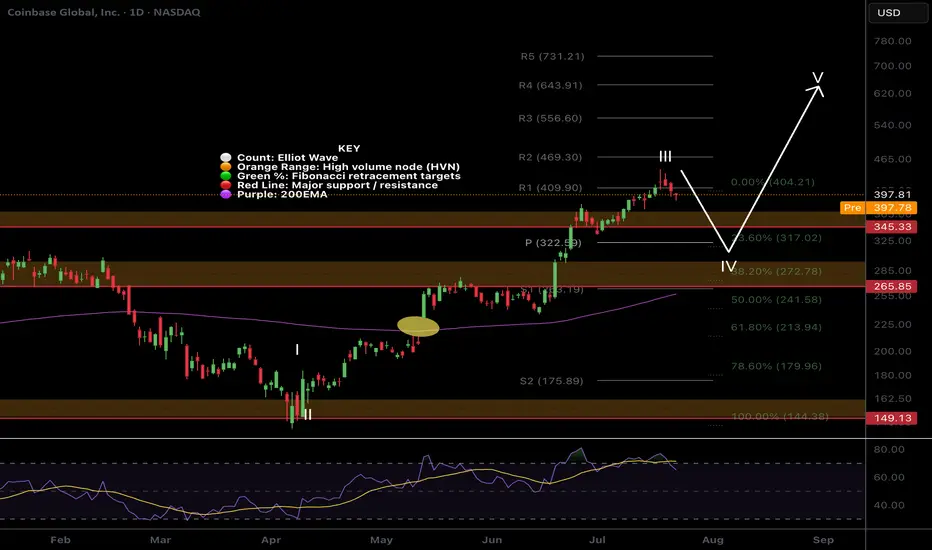
$COIN Wave 4 pullback?NASDAQ:COIN had a tremendous run, a text book Elliot wave 3 but has confirmed bearish divergence on the daily RSI.
The trend is strong so wave 4 could be shallow, only reaching the previous all time high, High Volume Node and 0.236 Fibonacci retracement and daily pivot point between $322-345
Further decline brings up the High Volume Node support at 0.382 Fib retracement and ascending daily 200EMA! Also a highly probable scenario!
Long term outlook remains around $600 target
Safe trading.
Ethusdt buy / long setupEth has a good pullback yesterday. Eth showing strong momentum against all the market. Long at cmp 3641, first tp is 3960 the next is 4.1k. must use sl.

Short swing setup on ETH, targeting 1.5R.It's time for a healthy pullback on ETH. This short setup offers a 1.5:1 risk-to-reward ratio with a target of $3,500.
Entry at $3,725
Stop loss at $3,850
Target at $3,500.
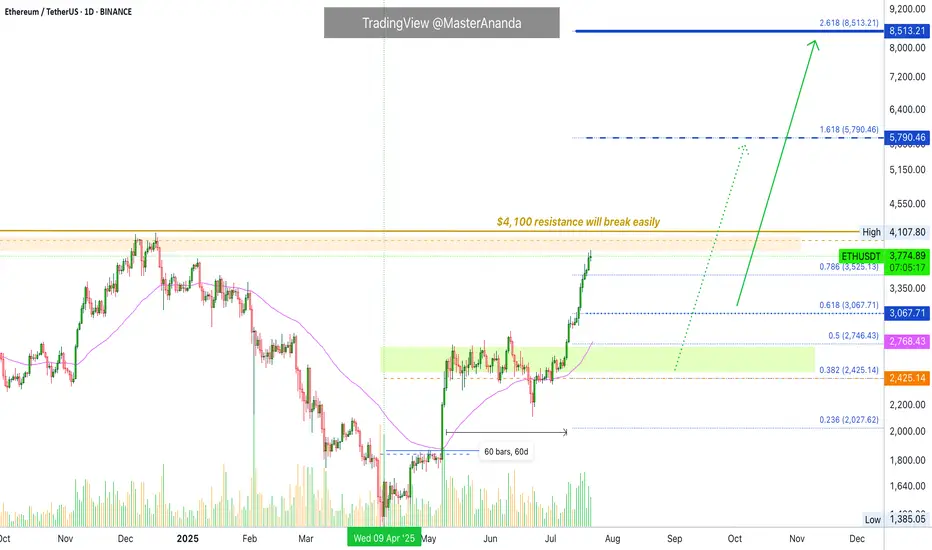
Ethereum Update · Minor Break Below $4,000, Nothing ChangesOk. Straight up has been confirmed but as you already know, the market never moves straight down neither straight up. It seems Ethereum is about to take a small break. This shouldn't alarm you nor be a concern, we are set for sustained long-term growth. When bullish momentum dies down, the market tends to take a break, a pause, before additional growth.
Please remember that these breaks are very tricky, they can last just a few days, say 3-6 days, just as they can go for weeks. It is very hard to predict. In fact, we don't try to predict the duration of those, we simply focus on the bigger picture and know that a new all-time high will be hit in the coming months. This new all-time high will be followed by additional growth.
The short-term can be tricky though. Ethereum will continue rising, but watch out, it can make a pause and this time can be used wisely to profit beautifully from smaller altcoins. Don't let your capital just sit around when it can grow.
Ethereum is awesome but it is also a giant. The smaller altcoins is where the true opportunities lie. The opportunity to quadruple in a matter of months. And this process can be repeated several times for the duration of the bullish cycle.
Namaste.
ETH - Altseason ??ETH has rallied sharply and is now entering the major resistance zone between $3,725 and $4,081, which has repeatedly acted as a local top during previous cycles.
This red zone represents a high-supply area, and historically ETH has struggled to break and hold above it without a significant catalyst.
Rejection here could lead to a pullback toward the $2,300–$2,000 range.
A clean breakout and weekly close above $4,081 would flip this resistance into support and open the path toward the all-time high (ATH) at $4,868.
If ETH reclaims this red zone and flips it to support, it will act as a major trigger for a broad Altseason.
Historically, such ETH strength is a key confirmation that capital is rotating from BTC into the altcoin market.
Currently, momentum is favoring bulls unless this red supply zone causes a strong rejection.

Check if HA-High indicator is forming at 3587.13
Hello, traders.
If you "Follow", you can always get the latest information quickly.
Have a nice day today.
-------------------------------------
(ETHUSDT 1D chart)
HA-High indicator is showing that it is about to form at 3587.13.
Accordingly, if the HA-High indicator is newly created, the support in the 3587.13-3762.33 section is an important issue.
If it falls below 3587.13, it is likely to touch the M-Signal indicator on the 1D chart.
Therefore, we should check whether it touches the area around 3265.0-3321.30 and rises.
-
This can be seen as a time to test whether it will continue the first step-up trend while rising in the important section of 2419.83-2706.15.
ETH's volatility period is around August 6-10, but we should check what kind of movement it shows after passing the volatility period of BTC.
-
Thank you for reading to the end.
I hope you have a successful transaction.
--------------------------------------------------
- This is an explanation of the big picture.
(3-year bull market, 1-year bear market pattern)
I will explain more details when the bear market starts.
------------------------------------------------------

People don't like the truth! Let's be honest, people don't like honesty. They prefer ideas that affirm their own beliefs.
When I read articles and posts from newer traders, it's often from a place of "all in" diamond hands and the notion that things go up forever.
I've been a trader for over 25 years now, and the game isn't about making a quick buck, it's about making money over and over again. This got me thinking, the issue is when you deal with a small account you require leverage, small timeframes and of course the "shit" or bust mindset. If you lose a thousand dollars, $10,000 even $100,000 - what does it matter? That's no different than a game of poker in Vegas.
The idea of being 80% in drawdown, is alien to me. The idea of one trade and one win is also a crazy notion.
Instead of playing with the future, there is an easier way to work. This isn't about slow and boring, it's about psychology and discipline. 10% returns on a million-dollar account isn't all that difficult. Instead of aiming for 300x returns on an alt coin (due to the account size being tiny) You can make less of a percentage gain with a larger account size.
In terms of psychology - the word " HOPE " is used, way too often, it's used when you hope a stock or the price of Bitcoin goes up, it's used when you hope the position comes back in your favour, it's used when you want your 10,000 bucks to double.
This isn't trading, it's gambling.
The truth is, it's not the winners that make you a good trader. It's the way you deal with the losses.
Once you learn proper risk management, a downtrend in a market move is a 1-2% loss coupled with a new opportunity to reverse the bias.
As a disciplined trader, the game is played differently.
Let's assume you don't have $100k spare - prop firms are a great option, OPM = other people's money.
Remove the risk and increase the leverage, all whilst trading with discipline.
The market goes through many phases, cycles and crashes.
You don't always need something as catastrophic to take place, but if you are all in on a position. You need to understand that losses can be severe and long-lasting.
When everyone sees an oasis in the desert, it's often a mirage.
You only have to look at the Japanese lesson in 1989, when the Nikkei was unstoppable-until it wasn't. For that short space in time, everyone was a day trader, housewives to taxi drivers.
Everyone's a genius in a Bull market.
Then comes the crash. The recovery time on that crash?
34-years!!!
I have covered several aspects of psychology here on TradingView;
When it comes to trading, if you are able to keep playing. It's a worthwhile game. If you are gambling, it's a game whereby the house often wins.
Right now, stocks are worth more than their earnings. Gold is up near all-time highs, crypto, indices the same.
All I am saying is if you are all in. Be careful!
Disclaimer
This idea does not constitute as financial advice. It is for educational purposes only, our principal trader has over 25 years' experience in stocks, ETF's, and Forex. Hence each trade setup might have different hold times, entry or exit conditions, and will vary from the post/idea shared here. You can use the information from this post to make your own trading plan for the instrument discussed. Trading carries a risk; a high percentage of retail traders lose money. Please keep this in mind when entering any trade. Stay safe.
Ethereum Breakout Could Spark the Next Altseason!A Massive Altseason Is Brewing… 🚀
Ethereum just flashed a major monthly breakout after printing a clean Morning Star reversal right at key support.
Now it's pushing against the upper resistance zone, a structure that held it back for over two years.
If CRYPTOCAP:ETH breaks and closes above this level, it won’t just be bullish for Ethereum — it could ignite the biggest altcoin season since 2021.
Why it matters:
📌 ETH is the heart of the altcoin ecosystem.
📌Historical breakouts like this led to 1500%+ moves.
📌The pattern and price action are lining up perfectly again.
Once Ethereum breaks cleanly above $4,000, expect altcoins to explode across the board — Layer 2s, DeFi, AI tokens, and even the meme coins could all start flying.
Keep your eyes on ETH. Its breakout is the spark… the altseason fire is coming.
DYOR | Not Financial Advice

ETH/USDT – Weekly Chart Analysis !! ETH/USDT – Weekly Chart Analysis
ETH is testing a major historical resistance between $3,700 – $4,000 (highlighted green zone).
A clean breakout above this level could push price toward the next key resistance at ~$4,660.
Previous accumulation zone around $2,400 – $2,800 (yellow box) now acts as strong support.
Long-term floor at $1,420 and $1,025, though currently far below.
Bullish Breakout Potential: If ETH sustains above the green resistance, it may retest $4,660+.
A failure to break above $4K could lead to a healthy pullback toward the yellow zone (~$2,800).
Stay updated and manage your risk accordingly.
DYOR | NFA

ETH: Eyes Resistance, But Correction Still LoomsEthereum has also seen a modest pullback since yesterday morning, but here too, it’s too soon to confirm a high for turquoise wave B. Accordingly, we anticipate further gains in this corrective rally—potentially up to resistance at $4,107—before the subsequent turquoise wave C takes over and drives the price down into the green long Target Zone ($935.82–$494.15). Within this range, we primarily expect the low of the wave- correction, which has now lasted more than four years, setting the stage for a long-term trend reversal to the upside. According to to our alternative scneario, magenta wave alt.(1) would complete with the next high. The following pullback, attributed to wave alt.(2), would then only extend into the slightly adjusted magenta Target Zone ($2,622–$1,914) before a move to new all-time highs (probability: 35%).
📈 Over 190 precise analyses, clear entry points, and defined Target Zones - that's what we do (for more: look to the right).

gold vs ethIf we follow this fractal, we should top around $4k and then a pullback to $3k followed by news highs in Q4

HolderStat┆ETHUSD approaching $4kOKX:ETHUSDT continues its move after breaking above $2,900. Next resistance sits around $3,500. Uptrend remains intact while above $2,875.

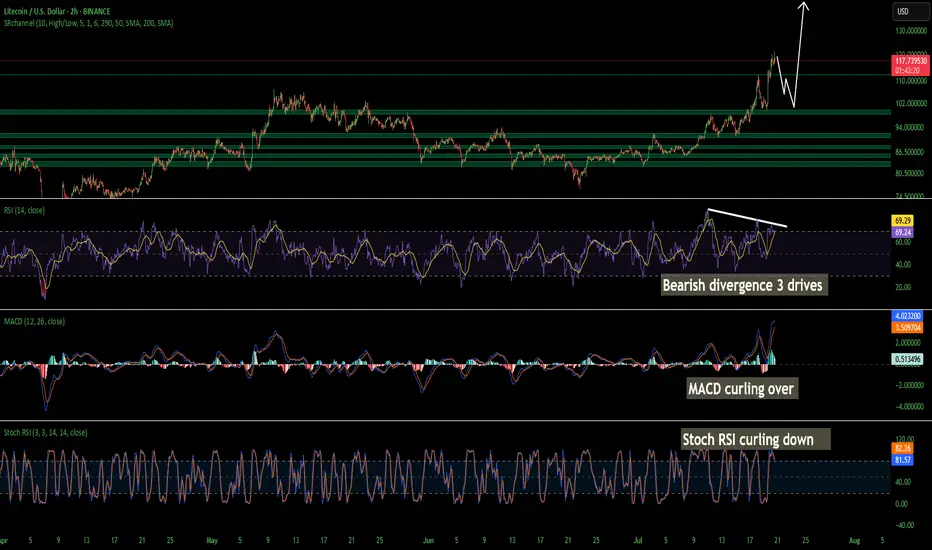
LTC Litecoin Short Term Pull Back Quick and SharpI believe Litecoin Is topping out on the 2 hour. Looks like we may come back down and tap support at around 104 but I wouldn't be surprised a wick hits 100. I have buy orders around 103-106. I am not super confident on a deeper pullback so thats why my buys are there is so i don't miss the dip. Id rather make a little less money than miss a buy in trying to nail the bottom. Litecoin is starting its breakout from a 7 year consolidation and accumulation phase. This should be pretty massive. Litecoin is going to benefit considerably from these new bills that are being signed and many of the favorites in the top 100 will soon disappear!
The time for Litecoin to shine as I have been talking about for years is now. I am almost certain that this is that time. My predictions all still hold if you would like to go read them. I was just off on timing. Timing is the hardest thing to predict especially with how wild this planet has been lately. None of this is financial advice its just my opinion.
ETHEREUM Resistance Ahead! Sell!
Hello,Traders!
ETHEREUM is trading in a strong
Uptrend and the coin has grown
By more than 70% since the last low
So the coin is locally overbought
And after it retest the horizontal
Resistance of 4100$ we will be
Expecting a local bearish correction
Sell!
Comment and subscribe to help us grow!
Check out other forecasts below too!
Disclosure: I am part of Trade Nation's Influencer program and receive a monthly fee for using their TradingView charts in my analysis.

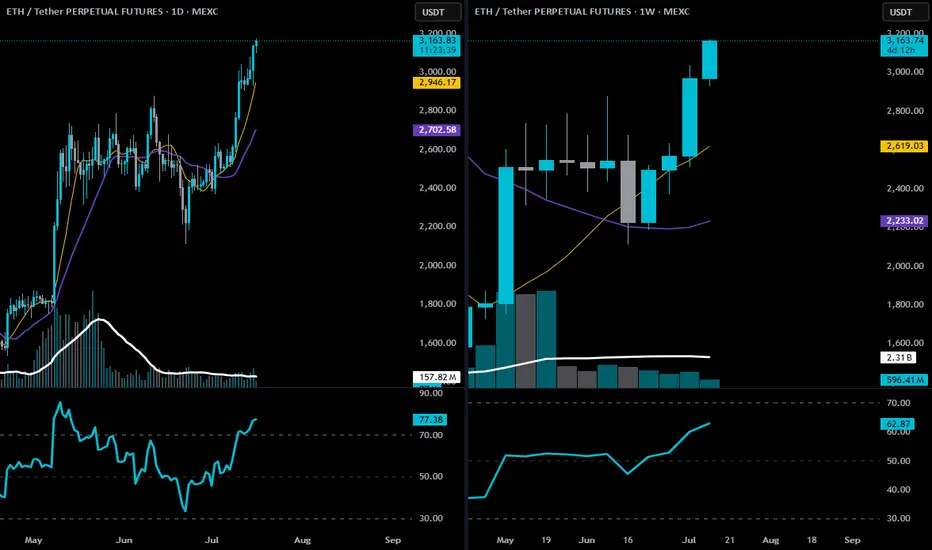
ETH-technical structure, momentum, and confirmation🕐 Daily Chart Analysis
Trend: Clear uptrend. Price is trading well above both the 9 EMA (gold) and 20 EMA (purple), with strong angle and separation.
Price Action: ETH is pressing into multi-month highs with no major resistance between here and the $3,350–$3,500 range.
Volume: Healthy increase in volume on bullish candles; recent bullish expansion looks organic, not low-volume driven.
RSI: At 77.15 — yes, overbought, but in a trending market, this is confirmation, not a sell signal. You want RSI to stay elevated during impulsive legs.
📅 Weekly Chart Analysis
Breakout Structure: This is the second full bullish candle after breaking out of a multi-month base ($2,800 range), following an accumulation period.
9 EMA Just Crossed Over 20 EMA: First time since early 2024 — bullish trend confirmation.
Volume: Large expansion bar from May shows institutional interest; current bar remains strong and building.
RSI: Pushing up to 62.75 — well below overbought, meaning there’s room to run.
🧭 Strategic Trade Plan (Swing Long)
✅ Bias: Long
Targeting $3,300–$3,500 with trailing logic to extend if momentum continues.
THIS IS NOT FINANCIAL ADVICE. Drinkin Smöökëē Whizkee. Edumacational Purpiz Only!
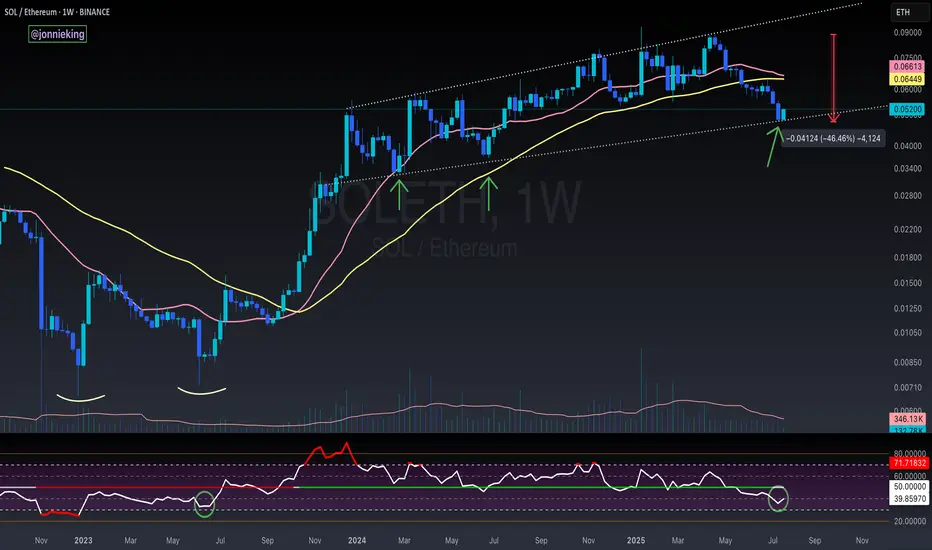
SOL / ETH - Reversal Signs FormingI suspect CRYPTOCAP:ETH has a bit more gas in the tank, but the early signs for the real Alt Season are nearing.
RSI on the weekly is nearing the June 2023 bottom which kicked off the massive bull flag formed on SOL / ETH for the next 2 years.
Still too early to call at this point tho.
Need volume to really burst through in the next week or two.
I’d also like to see BOATS:SOL close the week with a massive bullish engulfing candle.
The bearish cross on the 20 / 50WMA should mark the bottom when it occurs soon.
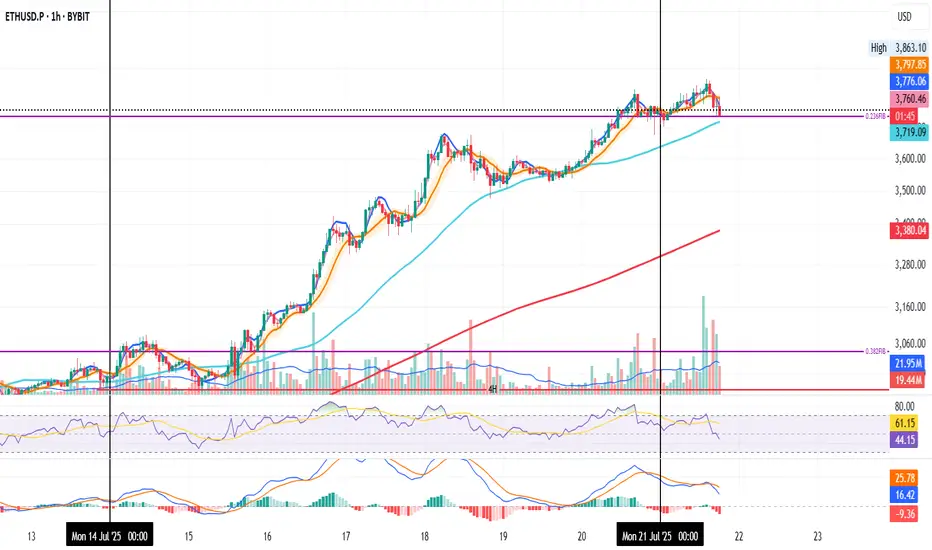
ETH on the 1H and the 0.236 Fib level
Could be a retest. Could be a fakeout. Could be the start of a move down.
RSI and MACD are both dropping.
SMA < MLR < BB Center confirms a downtrend.
50MA is sitting below the Fib level.
200MA is far below at $3,400, but rising quickly.
If tonight’s candles start closing under the Fib level, the warning gets louder.
If not, more upside remains likely.
Always take profits and manage risk.
Interaction is welcome.