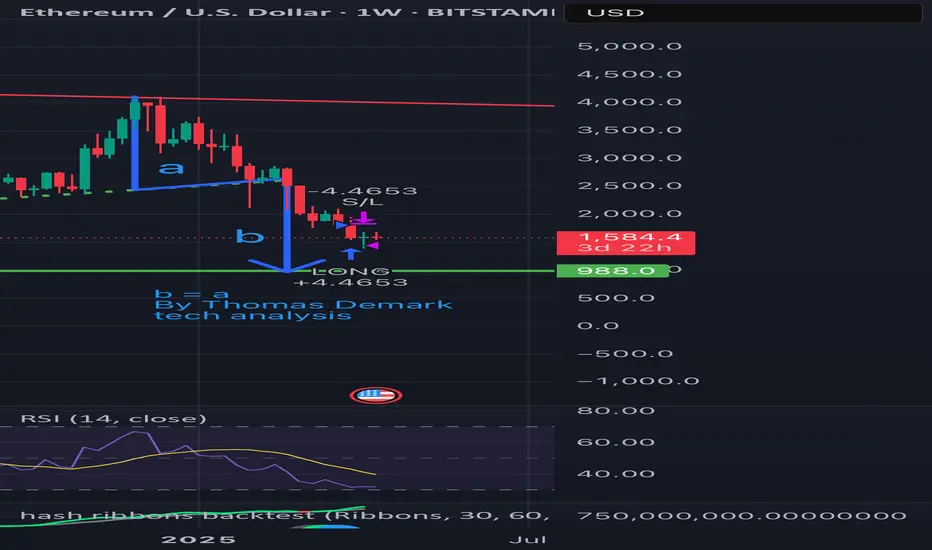
ETH is falling per Demark’s technical analysis: Target at $988?According to Thomas Demark’s method — when b = a, the next target for ETH is around $988.
📉 Price broke the ascending support
🔻 Wave “a” from $4000 to $2500 has already played out
📏 Wave “b” is projected downward — target aligns with a strong historical support zone
📊 Weekly RSI is nearing oversold territory
Conclusion: The $988 area is critical. A reversal may occur there if selling pressure weakens.
Stay sharp.
#ETH #Demark #CryptoAnalysis #TechnicalAnalysis #Ethereum
Eth-trend
ETH over the last year and now todayI wanted to zoom out of the chart that I provided yesterday identifying this potential for buying the dip. We did break down through bottom of ascending channel for just a fast wick but it likely indicates we are breaking out of this ascension. As you see there is a lot of potential for a sideways channel here at the top of the larger (slightly descending) sideways channel, here we could consolidate in the top third of the channel and then build up the courage to try to break out of top of this year long channel again, or break down and potentially trace all the way back to bottom of channel which as you see is as low as $2200. If we break that $3500 support, I will become short term bearish. Market has been strong though so good chance we maintain top of channel and try to break out again in the near future.
IMO daily candle charts are the most important and reliable charts. I do like 4 hour candles as they are more granular for seeing trends and are pretty close to as reliable and I often look at 1 hour candles for a pulse on the now but generally speaking, the shorter candle you use, the less you can rely on it.
Lets take a look at the break down of the daily candle.
---------------------------------------------------------------
# ETH/USD Analysis – Daily Chart 📊
## Structure and Price Action:
**Ascending Channel with Breakdown Risks**
ETH/USD is currently trading within a **parallel ascending channel**, with price oscillating between its upper and lower bounds (green lines). Recently, the price sharply rejected at **$4,100** and is now testing the **lower trendline support** near **$3,500**.
**Bearish Rejection Near Key Resistance**
Sellers emerged strongly at the **$4,100 Bearish Order Block (OB)**, leading to a steep reversal. This highlights a significant supply zone at this level.
**Approaching Key Demand Zone**
The price is nearing **Bullish Order Blocks (OB)** around **$3,500–$3,600** (green zones), where buyers have defended historically. This is a critical support area within the larger channel.
---
## Support and Resistance:
**Immediate Resistance**
- **$3,600–$3,700**: Overhead resistance zone, aligned with EMA 20 and mid-channel range.
- **$4,100**: Major supply zone, previously rejected at this level.
**Key Support Levels**
- **$3,500**: Current demand area reinforced by a key trend line
- **$2,800–$3,000**: Next structural support if breakdown occurs.
---
## Indicators
**EMAs (20/50/100/200):**
- The price has dropped below **EMA 20 ($3,800)** and **EMA 50 ($3,750)**, indicating short-term bearish momentum.
- **EMA 100 ($3,610)** is providing immediate dynamic support.
- **EMA 200 ($3,380)** remains a critical long-term support level.
**Parabolic SAR**
- SAR dots are below the candles indicating an up wave in progress but it seems muted.
**Volume**
- Recent sell-off saw a **volume surge**, confirming active participation in the pullback.
**Stochastic RSI**
- Currently **oversold** (9.30/26.79), favoring a short-term bounce from this zone.
**Money Flow Index (MFI)**
- MFI is sitting at **51.26**, indicating neither overbought nor oversold conditions but showing signs of selling pressure easing.
---
## Pattern Analysis:
**Ascending Channel Breakdown Risk**
ETH/USD is testing the **lower channel boundary ($3,500)**. A breakdown below this level could invalidate the top of channel, leading to bearish momentum targeting lower support levels.
---
## Probabilistic Outlook
**Bullish Scenario (Primary Case):**
If buyers defend the **$3,500–$3,600** zone with rising volume:
- **First Target**: $3,800–$3,850 (EMA 20 and mid-channel resistance).
- **Second Target**: $4,000–$4,100 (upper channel resistance).
**Bearish Scenario (Alternate Case):**
If the price closes below **$3,500**:
- **First Target**: $3,200 (next structural support).
- **Second Target**: $3,000–$2,800 (psychological level and major demand zone).
---
## Key Signals to Watch:
1. **$3,500 Support**: Holding or breaking this level will decide the next move.
2. **Volume Confirmation**: Rising volume on bounce or breakdown strengthens directional bias.
3. **Stochastic RSI Oversold Levels**: Signals a possible bounce unless selling pressure increases.
---
## Order Book Update:
Order books continue to look dirty but with potential for recovery. Both asks and bids tracking a downward trend, asks is staging a potential ascending channel though many times asks have lost a bit more than bids on pullback, indicating negative trader sentiment or fear in the market, it is in a position to change course over the next days but until it does, books are under pressure.
---
## Conclusion:
ETH/USD is at a **critical inflection point**, testing the lower trendline of the ascending channel converting to a sideways channel to consolidate before breaking out or breaking down. Bulls need to defend **$3,500** to sustain the medium term bullish structure. A successful defense targets **$3,800–$4,100**, with anything higher than $4100 starting a new breakout and while failure to maintain $3500 opens the path toward **$2,800** or lower.
🔍 **Monitor volume, key support levels, and stochastic momentum for confirmation.** 🚨

How far ETH will pull back? Potential Future PathIn this chart, all bull trends are in green and bear trends in red, the the longer/ more tested, the stronger the line.
-The dark red line in the bottom corner was a descending trend we had since over a year ago
-We broke out and established a strong ascending trendline and an ascending channel that was about 15 degrees lower slope. And actually at the same time it confirmed the upward channel, it started the downward channel, recently confirmed.
-The other battle here is we lost that strong dark dark green ascending support line and then we came back up and took it back, got rejected and then tried numerous more times to break it before giving up and losing ground.
* Once again we will need to decide which channel we want to maintain, the ascending green channel or the newly formed descending red channel
* I drew some lines of what seems Potential Future Paths, based on my interpretation of the current chart
*Each set of eyes are where you want to be paying attention should we make it to this area.
Roughly this chart infers.
Possible downside
ETH: $3650-$3550 | bullish | If we maintain this green Ascending channel
ETH: ~$3450 | Possible short term bear
Possible Upside:
Look for resistance around $3950 after testing channel bottom.
-------------------------------------
Orderbooks:
Currently orderbooks are strong but we did have the first significant dip in trader confidence we have had in a long minute with the recent sharp pullback but asks are back up to a very stable level. A recent uptick in in bids at 100% DOM, infers traders think there is some more pullback possible though this could be short lived. This is per coinmarketflow, using the new TV charts on ETH.
-------------------------------------
Longer Term:
Note, that is 1 hour candles, here is the same chart with 1d candles:
* Notice we are in a looong term ascending trend and we still have a ways before we test our theoretical top of channel but also there is a lot of room for this to fall, ETH could fall to $2500 in the next days to months and it would still be in an overall longterm ascending pattern with numerous proofs of support over the years.
This is my research based on trend analysis and orderbooks. You should always do your own research, maybe my research will help add to your own and work out as a win.

Not seeing a huge upside to ETHIt looks as though a recent correction for ABC is complete with a new impulse of 5 waves just commencing. Will the 5 waves break through the upper trend line in this impulse or will they correct as it they buffet the trend line down for another short ABC and then push through the trend line in the next set of 5 waves? We have some wonderful upward lunges of late with ETH, but I'm not seeing the size and scale that we're seeing with BTC. Going long, but not aggresively. Follow for more.

BTC to $17,350BTC is about to fall. Check out the last analysis, price is moving as anticipated. Short to $17,350 and lower

#ETH $ETH This is our Technical Analysis on #ETH 1h!
In 1h TF ETH is on BULLISH Market
Give attention to strong levels when price reach there!

Ethereum ottimo ribalzo sull'angolo 8/1 di GannQuadrando il grafico a 10$/Day e tracciando gli angoli di Gann dal bottom dell'ultimo ciclo, otteniamo una serie di supporti "naturali".
Gann ha sempre ritenuto l'angolo 8/1 (8 unità di tempo e 1 unità di prezzo) come l'area piu' vantaggiosa per effettuare acquisti.
Il prezzo di ETH ha rimbalzato sull'angolo in questione con precisione disarmante, e il minimo successivo poggia precisamente sul livello del massimo della scorsa bullrun.
Ci troviamo davanti ad una serie molto robusta di indicazioni di inversione, lo stop loss può essere posto sotto l'angolo 8/1, seguendo il trend fino ad esaurimento.

ETH | It might be the top of the bullish trend | Elliot WavesThere is a divergence between price and RSI indicator, it might mean that impulsive waves are completed.

Bearish Flag Pattern. Bitcoin🔥▪️BTC ascending channel, "Bearish flag" pattern. We are waiting for processing.
💎In order not to miss a buy signal, subscribe and stay tuned for new ideas. Every day I post 10 profitable ideas per day.

Quick update exsamining this 20 precent jump from the 880 ... looks like we have as possible trend reversal but not likley ... it just seems too violent and way that I want a trend reversal to be is a little bit slower very slow trend reversal where we smoothly go on the 9MA and then peek your head over the 9ma and then we start crossing the 50 1000 and 200 in a 100 precent move over 20 days ...

ETH Price action I put it all out there ... follow along but it looks like this is finding the bottom of this leg and we will be going sideways ... If we fast-track the bottom make sure your bottoms are ready ...

Possible Doomsday Scenario for the U.S. Dollar IndexUnfortunately, we will either watch a big slaughter in the markets or relax as soon as possible, I hope this is a fakeout situation...

ETH Bearish WeekThis the new entry level for ETH.
We setting up a Head & Shoulder,
- Broken counter-trend.
- Retesting the back end of that CT.
-------------------------------------------------------------------------------------------------------------------------------------------
Note: If / When you are taking these trades, please trade responsibly for yourself and your account.
It's key to use proper stops, some can even be tight (but not toooo tight) in some cases, depending on your entry.
Good luck.

API3/USDT MAJOR TRENDING/DESCENDING LINES AREA AND MAJOR LEVELS• For recent area (Area 1), chart will face one major level (T1) at around 4.8
• Once 4 hrs. candle body to be closed inside area 5 or 6, we have tow major levels T2=6.1 and T3=7.
• Again, for area 7, after 4 hrs. candle body to be closed inside it, our major levels will be T3=8.5 and T4=9.7

Market Update - 21 Mar 22 - Sunday Retracement, BTC Still StrongBTC had its big retracement for the day on Sunday
4hr flushed out late and weekend longs, but held the
important level of 40.7k.
ETH moved very similarly but rejected its monthly open
Other than that just waiting for the NY open to see what the
general markets are doing, other than that we are still
in this high timeframe range.

IS BITCOIN GOING TO THE 17K ZONE !!hello guys !
i hope you all doing great !!
as you see on the chart : bitcoin broke a solid trendline and it's now on a solid support zone
which means if it did break this zone and close below it (on the Daily TF), there is a high potential that we going to visit the 29k zone !!
be careful guys and have a safe trade !!

Two bullish scenarios for REEF/USDT over the coming week After ETH making consistent ATH's and holding itself together, its time to look for a few tasty ALTs that might out-perform the market in the coming weeks. REEF is a dark horse contender after the price never truly recovered from the mid-March twitter drama FUD. From a fundamental standpoint, buying after a bad news period that did not include the product is generally a profitable play.
However, from a purely PA standpoint, the coming week will be a big one for REEF's hopes of playing with the big boys.
There are two possible outcomes from the recent PA that will result in a bullish set up into the coming ALT-SZN. After the white support trend line was broken it flips to support and needs to be broken before we can confirm full elon sned.
In scenario 1 price will follow the blue candle and the new trend straight through the barrier and confirm destination mars. In this case the break of the cross trend lines will confirm a long signal.
Scenario 2 is a little more reserved and sees us bouncing off the resistance. This bounce could carry us all the way down to the blue support line before coming back for another retest of the weaker white downward trend.
Both scenarios are still bullish so long as the blue floor hodls. Either way, the future looks moonish for REEF.

ETHUSD long-term outlook - I see a massive double bottom that is forming and the last consolidation zone at the second bottom after breaking up from this MC curve.
-The target of the double bottom is the ATH that was in 2017
-Since 2017 we are in a bear market, and we are making lower highs but also we are making higher lows so for the breakout we will not wait to much.
Give me a like and follow to support my work i will appreciate it.Thank you!
-This is not a financial advice.This is just my analysis.So make sure to analyse for your-self and you are responsible for your trade or investment
Have a nice day!

Introducing “Trend King”. The alpha generating strategy built fTrend King
“Trend King” combines 4 proprietary indicators. It buys and sells based on:
Short-term momentum
Long-term momentum
Volume compression
Volatility breakouts
The strategy was built on 2 years of BitMEX data (XBTUSD) and backtested on 9 years of Bitcoin data (BLX). Finally, the strategy was validated on multiple large market cap cryptocurrencies, including Ethereum (ETHUSD), without parameter adjustment.
Strategy backtesting checks include:
Used 0.12% fees. 60% more than the actual BitMex/Binance fees of 0.075%.
No Heikin-Ashi Candles (to avoid fake results)
No Stop-losses (to avoid fake order execution)
Market Orders Only (to avoid fake order execution)
The results speak for them self.
See the positive excess return from the “Trend King” strategy returns versus a simple Bitcoin “Buy-and-Hold” strategy. Best functionality on the Daily and 4HR timeframes.
**For Access: Contact me on TradingView or Twitter.

[Reading notes] : chapter 13 how & when to sell shortHello, everyone
This is a threads of my reading notes for the great book: [ Technical analysis using multiple timeframes ]
And here is the notes of chapter 13, how & when to sell short
I will go through all of key points of this book, and find proof from the bitcoin chart.
Why to selling short?
from the book : bear markets occur every 39 months on average and typically last for about 18 months. that is a lot of time where the odds are stacked against long trades and where selling short makes sense to generate market profits for the purpose of current income.
And let's have a look at the bitcoin market for the bear market times:
02.Dec 2013 ~ 24.Aug 2015 last 21 months.
18.Dec 2017 ~ 28.Jan 2019 last 14 months.
In the long time of bear market, shorting is a good tools to catch great profit.
Measures of sell short
By selling short, the trader expects to profit by repurchasing the shares at a lower level and profiting from the difference.
And cutting losses must be taken very seriously when selling short since the unlimited losses.
Shorting takes the right mindset
Selling short is a skill that every serious trader learns to utilize during stage 4 market declines.
The best time for sell short is during a bear market, but there are always stocks in a stage 4 decline that can be sold short regardless of the overall market environment.
What is a bear market?
The most obvious sign of market bearishness is when the majority of stocks are in established downtrends or when the overall market indices are below key moving averages. the best way to define a bear market is an environment in which markets where the 200-day MA is declining.
Let's look at the chart pattern of bitcoin in bear market 2014 and 2018 with 200 day MA.
From the chart above, we can see in the bull run, bitcoin will not touch the 200 day MA, if bitcoin drop below the 200day MA, then it's high possibility we enter the bear market, and 200 day MA will become a major resistance line of bitcoin.
But is it the best indicator of bear market? how can we measure we are near the peak of ATH? find the bear market indication in in early stage is very profitable and very risky also
another clue is the price of stock/bitcoin drop below the long term support line. such as in 2017 bull run, the 20 week MA is the most important support line for bitcoin, but it drops below the 20 week MA on 29.Jan 2018. This may indicate the bear market is coming!
And I found another indication is the bitcoin is not correction in healthy range (20 week MA) and resume to advance again, this means the final ATH will be very soon.
Sentiment of bear market
In the bull market, everyone is very confident, but in bear market, stock tend to drop much quicker than they advance and it has a great deal to do with emotion. bear market are characterized by a stronger emotion response than bull markets because people are complacent when they are winning and become frightened when they are losing. fear is a much stronger motivator than complacency, and emotional liquidation from frustrated long holders can lead to quick declines.
Choosing shorts
Timing need to be more accurate when it comes to shorts, in bear environment, try to concentrate only on the highest probability setups, and keep overall trading activity low relative to your trading volume in a bull market. you need to have the patience to let the market present you with the lowest-risk opportunities. This occurs when the trend are aligned on multiple timeframes .
Some of sharpest rallies experienced by stocks occur during a downtrends, and while these rallies usually fail to hold up in a down trending stock.
Trend trading is the safer way to consistent profitability, so do not allow yourself to be enticed by the rapid movement.
Short alignment
Trend alignment of short trading positions is the lowest-risk, highest-profit potential trade scenario. Whether we trade long or short, the basic cyclical structure of the market never changes.
Find the candidate with daily timeframe
The first step in trading short is to find a stock in an established stage 4 downtrend. when trading from the short side, we ideally want the overall market, the sector and the stock to be in a decline.
In digital currency market, we hope the bitcoin is in decline when shoring the alt coins.
And if the daily MA 10-, 20-, 50- stacked below each other 10<20<50 is another bonus for shorting. let apply these rules.
Shorting choose in bear market
07. Feb 2014, lower high formed in Jan 11, and consolidate in the neck line range ~ 790, but after 1 month, the market choose downside direction, when 07.Feb 2014, we can see obvious MA stacked 10<20<50, it's a sign of bear formed, good point to start short.
13.Aug 2014, lower high formed in 01.July 2014, and break the neck line in 14.Aug 2014, with daily MA 10<20<50 stacking, good point to shorting.
05.Mar 2018, daily double top seems formed, this chart pattern in bear market have strong power to drive the price down. we can setup shoring with stop loss in here.
05.May 2018, daily double top formed, we can shorting with stop loss from here:
29.July 2018, bitcoin price formed lower high in daily chart. shorting!
14.Nov 2018, bitcoin break the major support which support bitcoin ~ 1 year. the longer the hold, if breaks, the large dump will happen. shorting without reasons!
Shorting in bull market
I have to say shorting in bull market is very risky, bulls driven by FOMO of crowd. Don't short in bull market otherwise you're very experienced in trading. And one rule we should always keep in mind is we should ride the trends, not try to violate or control it.
So in bull market, just find the right position to long, don't try to stand on the oppose/low possibility position.

bitcoinbtc is in the triangle structure and is going to complete last wave of triangle to upside
there is a wedge and abc wave of that wedge is complete and doji candle can be print on 4h for reverse.
trade is counter trend and have high risk.
good luck

BNBUSDT (Volume Analysis Prediction 7/13/2018)Ticker: BNBUSDT
Exchange: BINANCE
Mid term signal: buy
The coin moves irrespective of the market
Now the coin is on global support
We buy after the reaction of buyers
Stop put below lower point of the current wave
From this support, price unfolded several times
And the reasons to be sure that now the price will break down this point, we do not have
We have an excellent risk-profit ratio
After completing the first goal, move the stop to the break-even point
Enter: 12.45
Take profit 1: 13.50
Take profit 2: 14.65
Take profit 3: 15.60
Stop: 11.77

BTC :- Heading Lower Bitcoin as expected move up closer to 8800 faced resistance and is now making a 2 day bearish engulfing.
Keep in mind we have an uptrendline in place - we need to see if those prices can be held.
A break below 8120 will take us lower to 7800 and then 7433 where we would find support at the purple moving average.
