Bitcoin Remains Stagnant Despite Testing Key Resistance BarrierBitcoin continues consolidating without providing any clear signs of where its price is heading next. The ongoing stagnation phase was mostly felt on July 14th as the flagship cryptocurrency mostly traded within a $90 range.
BTC opened the day at $9,251.6, but a few hours later its price dropped to $9,163.4. The bulls were able to step in throughout the middle of the day and helped it recover the losses incurred. The buying pressure was significant enough to send Bitcoin just above the daily open providing a daily return of only 0.13%.
Regardless of the lackluster price action, the pioneer cryptocurrency seems to be contained within a descending parallel channel that began to take shape in the beginning of the month. Since then, each time Bitcoin hits the lower boundary of this technical formation, it rebounds to the upper boundary, and from this point, it pulls back down.
Over the past week, Bitcoin has been testing the overhead resistance signaling that it wants to break out of this consolidation pattern. A spike in the buying pressure around the current price levels may allow this to happen, which could propel its price towards $10,000.
Failing to do so, however, might see BTC get rejected by the $9,300 resistance level and plummet to the lower boundary of the descending parallel channel that sits around $8,800.
Ethereum Prepares For Strong Breakout
Like Bitcoin, the smart contracts giant is also going through a period of low volatility.
Its price opened on July 14th at $239.9 to then take a 1.09% nosedive that saw it hit the $237.3 support level. A significant number of buy orders were triggered around this price zone, which pushed Ether up by 2.11% to hit an intraday high of $242.31. As the day closed, ETH went down to $240.56.
From a technical perspective, the price action seen over the past few days forced the Bollinger bands to squeeze on ETH’s 4-hour chart. Squeezes are indicative of stagnation and are usually succeeded by strong breakouts. Since this technical indicator does not provide a clear path of where Ethereum is headed next, the area between the upper and lower band is a reasonable no-trade zone.
These critical hurdles sit at $245 and $237, respectively. Only a clear candlestick close above or below these price levels will determine the direction of Ethereum’s trend.
Market Participants Worry About the Future
Low-cap altcoins have stolen the spotlight of the cryptocurrency market after the massive gains they have posted recently. Meanwhile, Bitcoin and Ethereum have failed to breakout of the consolidation period they entered since the beginning of the month.
This market behavior has investors worried about what the future may hold. Although sizable opportunities are generally presented when fear reigns, BTC and ETH have yet to provide a clear roadmap of the direction of their trends. For this reason, a small dose of patience may help investors benefit from the next significant price movement.
ETH-USD

ETH close to breakout!Hi Traders!
If we look at the ETH/USD chart we see an increase in RSI. The Ascending Triangle in the RSI is narrowing its end and is close to a breakout. -> bullish
Buy-limit: 240-244 USD
Target: 288 (0.7861) FIBretracement
Happy Trading!
BTW: This is my first chart published her on Tradingview.
Please leave comments and subscribe to my telegram-channel, if you like the shown data.
t.me/AndiniableSignz


eth usd medium term - updateif btc will give a dip in range 7200 - 7600 usd, it is posisble to see something similar among the eth usd pair. Just an idea, not financial advice.

ETH|USDHello, everyone. Thanks for reading.
You can sell, risk reward is good.
Thanks for reading
Dont foreget to leave a like if you liked my idea

ETH/USD - Limited upside, a corrective pullback is due.Note: We are utilizing the Elliott Wave Principle.
ETH/USD may have registered a temporary high near 251, where wave 5 equals wave 1 - a common wave relationship. This implies a corrective pullback, which would provide a buying opportunity. A key zone to watch near term is the 225 - 218 Fibonacci area. Overcoming this zone will likely then target channel support near 200. Closing price action below this level would confirm a bearish reversal is underway and probably then lead to a larger decline towards wave 4 extreme near 175, a common target for second-wave pullbacks. Near this level, we will ideally see a bullish reversal.
Bottom line: The big picture is bullish, however, near term, a corrective pullback is likely to precede the next five-wave advance in ETH/USD. Ivo Z

ETH|USDHello, everyone. Thanks for reading.
You can sell, risk reward is good.
Thanks for reading
Dont foreget to leave a like if you liked my idea

ETH|USD Ethereum price drop.Hello, everyone. Thanks for reading.
You can sell, risk reward is good.
Thanks for reading
Dont foreget to leave a like if you liked my idea

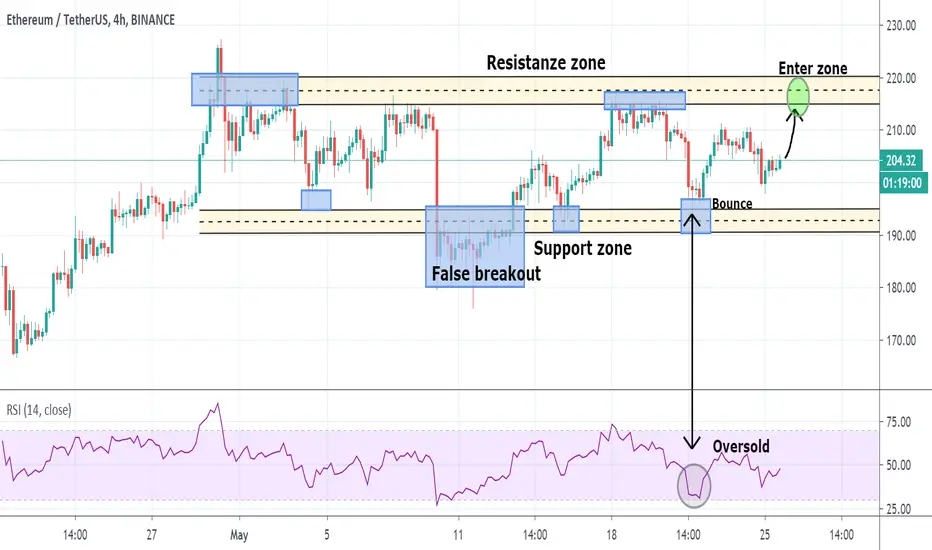
ETH/USD to COME BACK!According to the RSI 14 indicator the price for ETH/USD has recently been slightly oversold , so we are expecting its renewal trend. Though we are not observing the proper uptrend , the recent bounce of the support zone also provides ground to expect the rise in the price.
RETRACEMENT FIRST...Before breaking out of this structure, there is a high probability of re-testing it's lower levels. Few days of support has this evening been broken, now we are witnessing confirmation. Target in the green box.

Short Idea - ETH USD - Coinabase - Daily I dont know about you guys, but this looks like the perfect short setup to me.
Topped out RSI, topped out Oscillator, 618 retracement, it has hit a trend line, we just finished a pump, it's at key resistance/support level from previous price action across the chart.
I don't really have anything else to say. It is what it is.

ETHEREUM : FELL IN LOVE💘💘💘Hey, guys!❤ I want to tell you a few words!😚
I'm glad of your feedback.💙 Your comments, private messages make me very happy. 😇 They charge me with energy, I, like a battery recharging and ready to work again and again !!!🔋🔋🔋 Thanks a lot!😚
Thats my last analysis for today!🤗 Let's consider ethereum.👁🗨
Take a look, it's a pleasure.😌
👀Look at the figure, that I marked on the chart👀 Yes, yes, this is Adam and Eve ... such mercy))))💘💘
Now the price is rising, so let it be )))🤗
😍😘Guys, thank you for your suppor !!! I love you!🥰
Everyone, who has recently folloed me - welcome 🌞!!! I'm very glad to see you!😘
✔Stay with me!✔
Your Rocket Bomb🚀💣

[$ETH] Triangle de consolidation avant impulsion baissière ? Bonjour à tous,
Joyeuses Pâques à tous ! J'espère que vous allez bien et vous vous goinfrez pas trop de chocolat :)
Ce week-end sur les marchés c'est assez calme, même si hier nous avons eu une séance assez volatile sur le Tezos, les investisseurs ont solder leurs positions avant le week-end de Paques et nous avons assisté à une belle baisse sur tous les assets.
L'$ETH présente une structure de faiblesse après avoir bien évolué pendant un mois ( +105%)
Des volumes en baisse, des acheteurs qui sont entrain de chercher les oeufs, et nous arrivons à la fin du triangle de consolidation qui pourra casser par le bas et aller naturellement retesté les supports inférieurs.
Je n'ai pas trop l'habitude de prendre partie sur une position, pour autant, tous les facteurs d'analyse me renforcent dans cette interprétation.
En H1, le gros Kumo baissier fait office de rempart et le prix compresse sur la SSA + un magnifique twist baissier ( direction du twist vers le bas)
En H2, Le prix , la Tenkan et Kijun viennent de passer ensemble le kumo ( signal baissier fort )
En H4, on est dans le Kumo mais le prolongement de la Kijun a rejecté le mouvement haussier précédent. ( renversement de tendance => baissière).
Tout cela avec un RSI qui est bloqué sous le plafond de verre des 50, ca ne sent pas bon.
Je vous laisse le chart en H1 :)
Zone de vigilance si breakout baissier entre 154 $ et 156 $ sur l'exchange FTX.
Target : entre 146$ et 139$
Si vous désirez vous essayer sur un exchange simple et avec de la liquidité : ftx.com
Encore joyeuses paques à tous!
Stay Safe
PEACE !

ETHEREUM: WILL IT GOES UP?💥Welcome people!💥
There is an opinion, that all Altcoins follow Bitcoin. Have you ever heard this?
Let's see🧐🧐🧐
⁉How are you doing with ethereum?
Will we long it or you are not sure?
✍🏻✍🏻Write me about this in the comments🌸
💋Subscribe and put like💕
Your RocketBomb🚀💣


ETH Moving closer to the Supply ZONE!!After a decent 20% move in the last 24hrs can we break this resistance and make it up to the supply zone?
In my opinion this looks like a key level and could be a hard level to break.
we could consolidate just below this resistance for a few days before a re-rest.
ETH/USD 4hr

ETHUSD technicaly based forecast
📌Short intro:
I am full time trader - analyst * High accuracy of ideas * Technicaly and Fudnamentaly side in analysis * Comment if have any questions or want to send support
📌Why DepaDigitalTrading:
*Analysis based on my program and tactic readings
*Fundamental side in analysis
*Price action - FIBO - Candl pattern
*FX - STOCK - CRYPTO
*Day trader - Swing trader - Position trader - "Sniper"
*Simple ideas
💡 ETHUSD technicaly based idea, technicaly indicators showing we can expect higher push up in price, we can see strong bulish candels formed, technicaly picture good, expecting to see push in price till FIBO 0.6
📌Have on mind, trading involves risk, check idea on your own tactic, if have questions pls comment!
Thanks on supporting!
All best, good luck!


🧐ARE YOU INTERESTED IN ETHEREUM??💰😉🤩Good mood for everyone. Hope, you're good!🧐
For ethereum lovers💕 1 hour chart⏳
Guys, ethereum's in a ascending wedge, it will make somemore movements in it, then there we'll see a breakdown to the width of the beginning of the wedge.
❓Do you trade ethereum?Are you good with it?
✔Share your success💪🏿
I’m glad to see your likes and subscribe)🕊
Yours RocketBomb💣🚀


ETH Short term forecastEthereum is moving in a specific channel and for the moment seems to be still fluctuating in that channel and eventually fall to $ 100
