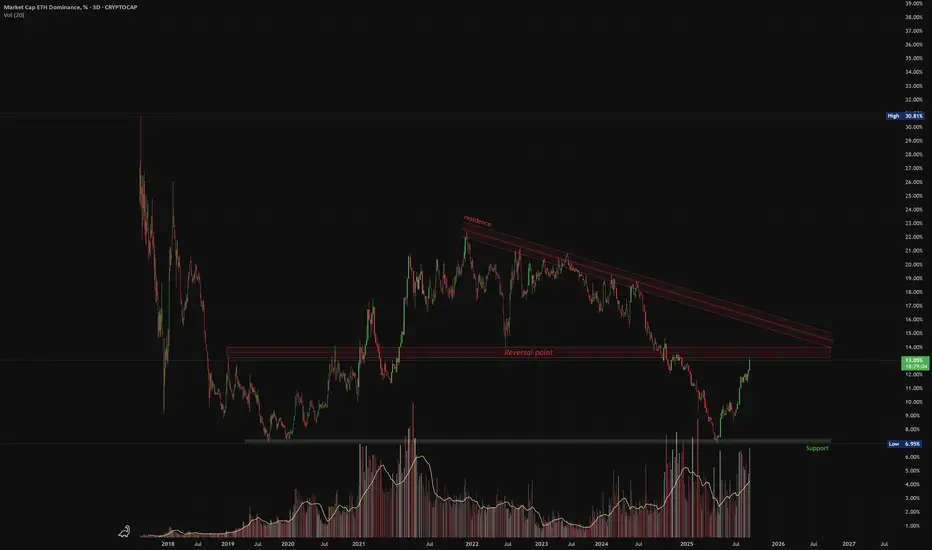
ETH Dominance – Possible Pullback at Key ResistancePair: ETH Market Cap Dominance (%)
Timeframe: 3D
Structure: Descending Trendline + Horizontal Resistance
Volume: Rising on approach to resistance
📉 What’s happening?
ETH dominance has rallied from support and is now approaching a historically strong resistance zone marked by multiple rejection points. Price is also near the long-term descending trendline, which has acted as a ceiling for over a year.
🔻 Caution Zone:
Resistance between 18.5%–19.2%
Historical reversal area (marked as “Reversal Point”)
📌 Pullback Triggers:
Bearish candle formation at resistance
Declining volume on further push up
Failure to close above the descending trendline
Bias: Short-term pullback likely unless ETH dominance breaks and closes above resistance with strong volume.
ETH
$ETH - Secondary Upthrust CRYPTOCAP:ETH | 2h
Possible LTF setup:
- Bounce around 4.1k–4k
- Initial supply retest at 4.2k–4.3k
- Retrace at 4.1k
- Secondary upthrust towards 4.4k–4.5k
local support 4k - holds for bullish continuation
Break below - likely test of 3.8k–3.7k

ETHUSDT 12H chart uptrend1. Breaking out of the downward channel
• Black lines show an earlier inheritance channel.
• The course struck the mountain and it is quite dynamically, which is a strong upward signal.
2. Current price
• ETH is around USD 4,274, just below the resistance at USD 4,304.
• Another resistance is 4,484 USD (potential target if the upward trend persists).
3. Support
• The next support: 4,048 USD - if the course is corrected, then there may be the first "test".
• stronger support below: USD 3,930, $ 3,709, $ 3,487.
4. Indicators
• MacD: MacD line strongly above the signal, the histogram is growing - confirms the upward trend.
• RSI: around 75 - close to the purchase zone, which can mean a short -term correction, but with a strong RSI trend can stay high for a long time.
5. Scenarios
• Bull: Punction and maintenance above USD 4,304 can open the road to 4,484 USD and possibly higher.
• Bear: rejection from USD 4,304 and a descent below 4,048 USD may cause a deeper correction in the direction of $ 3,930 or even $ 3,709.
📌 The short -term market is warmed up, so a small pullback is possible, but the structure looks very bullshit after this burst from the downward channel.

Ethusd breaking above invh&sEthusd chart has a similar set upas the total2 chart, a cup and handle that is breaking up from a smaller inverse head and shoulders that will complete the handle to the cup. Ethereum actually has two potential to trendlines for its cup and handle and I wouldn’t be surprised if both are valid. The breakout target for the inverse head and shoulder pattern will take price action above both of them. Once we solidify the top trendline for the cup and handle patterns as support the breakout target for it is $7161. Ethereum just recently had a golden cross on the daily which adds to the probability the inverse head and shoulder pattern breakout will be validated. *not financial advice*
ETH - The long call Man this took forever. On this way up, its likely to handily exceed the previous target of $4383 after some resistance. $6375 is definitely in the cards. Will this be Eths big year?

ETH/USDT 12h chart1. Punction of the downward trend
• The black inheritance trend line has been broken up - this is a strong signal of Bycza.
• Breaking was confirmed by a strong candle movement and high growth dynamics.
⸻
2. Key levels of support and resistance
• Support:
• 3930 USDT - previous resistance, now the defensive zone with possible correction.
• 3709 USDT - deeper support.
• 3488 USDT - critical support, below which the upward trend would be negated.
• resistance:
• 4048 USDT - current local resistance (the candle touched and lightly reflected).
• 4304 USDT - another strong resistance.
• 4484 USDT - long -term resistance and potential goal when continuing to grow.
⸻
3. RSI
• RSI is around 70 - close to the purchase zone.
• suggests the possibility of a short correction or consolidation before the upward trend continues.
⸻
4. Scenarios
Bycza (continuation of growth)
• Maintenance above 3930 USDT.
• Breaking over 4048 USDT opens the road to around 4300–4480 USDT.
Bear (correction)
• Rejection to USDTT 4048 and a decrease below 3930 USDT may bring a rate to around 3709 USDT.

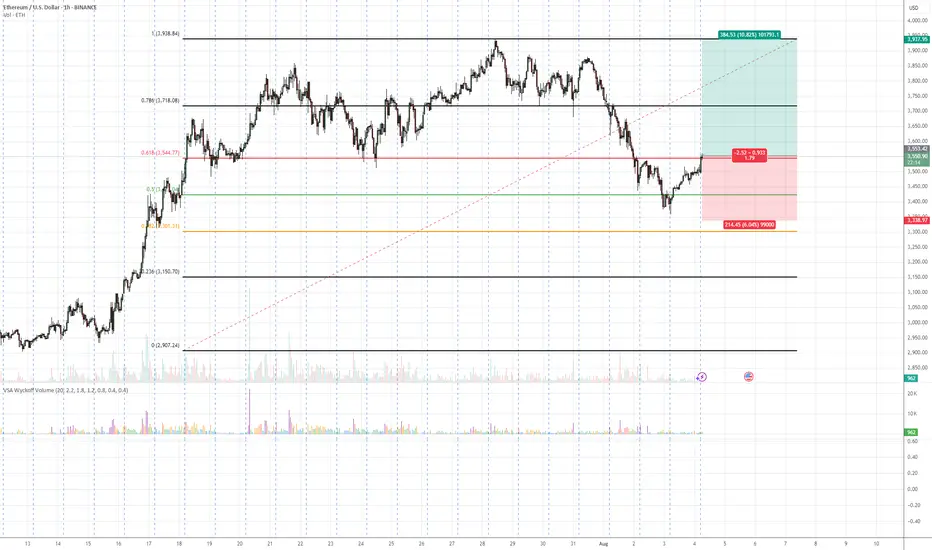
ETH/USDT – Bullish Reversal Potential from Fibonacci Confluence 💡 Idea:
Ethereum is showing signs of demand absorption at a critical Fibonacci support cluster (0.5 – 0.618 retracement). VSA patterns confirm that selling pressure is being absorbed, hinting at a possible markup toward previous swing highs.
📍 Trade Setup:
Entry: Current levels near 3,551
Target: 3,937 (+10.82%)
Stop Loss: 3,338 (below last absorption zone)
R:R Ratio: ~1.79:1
📊 Technical Reasoning (VSA)
1. Stopping Volume at Fibonacci Support
ETH tested the 0.5–0.618 retracement zone from its prior bullish impulse.
Wide spread down-bars on high volume failed to produce significant downside progress, signaling professional buying.
2. No Supply Confirmation
Following the stopping volume, the market printed narrow range candles on decreasing volume, indicating supply exhaustion.
3. Demand Emergence
The recent push above short-term resistance came with increasing volume and wider up-bar spreads, suggesting the start of an accumulation-to-markup transition.
4. Structure & Fibonacci Confluence
Current rally aligns with the Fibonacci golden zone and past structural support.
📌 Trading Plan:
Enter on confirmed breakout above minor resistance with volume expansion.
Scale out partial profits near 3,800 and let remainder ride toward 3,937.
Keep stop below 3,338 to avoid being shaken out by false breakouts.
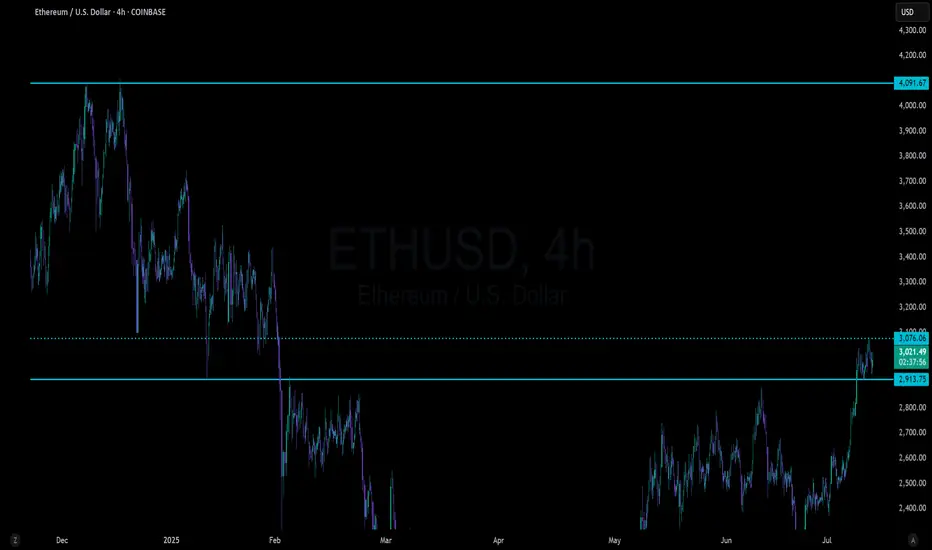
ETH broke a nearly 4 year resistance levelLooking at Ethereum on the daily or weekly Logarithmic chart you can see resistance being consistent since Nov 8th, 2021.
Today, Ethereum has broken through. It was brief, it was fast and it was so small that you can't even see it when zoomed out so far to see the multi year down trend.. However, if you take a look at ETH on the 4hr chart you can see it.
I don't know how ETH will react when breaking such a long downtrend and I look forward to finding out. A retest of the all time high from here seems plausible after such a long downtrend.

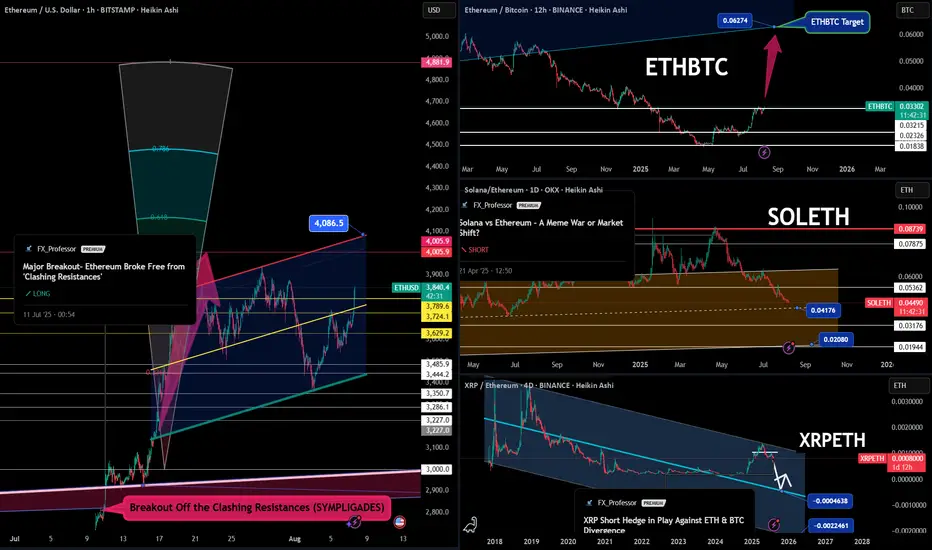
Ethereum Outperforms Majors as Crypto Sentiment Shifts Again 🌐 Ethereum Outperforms Majors as Crypto Sentiment Shifts Again 🔄📊
Trump talks 401(k) crypto 🗞️, BTC reclaims the key $115,800 level 💪, but today we zoom into what the charts are screaming — and Ethereum is leading.
While headlines fly, structure never lies. Let’s compare ETH against other majors 👇
🔷 ETHUSD – The Breakout That Sparked It All
📈 ETH broke free from the "Clashing Resistances" zone (SYMPLIGADES).
It’s now targeting $4,086.5, with potential expansion toward $4,881.9 if momentum holds.
🟨 Key zones:
$3,744 = retest zone
$3,830 = resistance-turned-support
$4,005 = psychological milestone
The 1-2-3 model is alive and well.
And ETF news + BTC support is the fuel ETH needed. 🔥
📊 ETHBTC – The Hidden Strength Ratio
This is what most traders miss:
➡️ ETHBTC has been in stealth accumulation mode.
Now aiming for 0.06274 — a huge reclaim zone not seen since mid-2022.
This ratio matters because it signals altcoin rotation, not just price action.
💀 SOLETH – The Bleed Continues
We called it months ago:
Solana may have great tech (Rust, speed), but it’s paying the price for memecoin mania and diluted narrative.
SOLETH is in freefall — currently below 0.045, with support at 0.04176 and 0.02080 next if weakness continues.
ETH is eating market share back.
📉 XRPETH – Short Hedge in Play
XRPETH structure remains bearish.
Even after multiple divergence plays, XRP continues to underperform against both BTC and ETH.
Target zones:
🧊 0.00004638
🧊 0.00002246
XRP fans — this is not personal. This is chart-based reality.
🗞️ Don’t Forget the Macro Backdrop:
SEC just greenlit direct BTC/ETH usage in ETF flows
Trump hints at crypto-friendly 401(k) policies
China is brewing something (rumor or tumor — still unclear 😅)
BTC just reclaimed $115,800, setting sights on $122,795 → $132,595
This market isn’t waiting for confirmation — it’s moving based on structure.
🚫 What I Avoid in This Cycle:
❌ Memecoins (low trust, no ETF tailwind)
❌ GameFi (zero relevance right now)
❌ Ghost L1s (no users = no bids)
🧠 Final Take:
Ethereum is clearly leading the pack.
BTC is reclaiming its throne.
Solana is bleeding relative to ETH.
XRP is stuck in divergence hell.
So we trade the structure, not the hopium.
📈 Alt season won’t be a meme — it will be rotation-driven, narrative-backed, and ETF-aligned.
📽️ Full explanation in my previous video post — check it out if you want full breakdown on ETFs, ETH’s structural strength, and the geopolitical backdrop with China.
One Love,
The FXPROFESSOR 💙
Disclosure: I am happy to be part of the Trade Nation's Influencer program and receive a monthly fee for using their TradingView charts in my analysis. Awesome broker, where the trader really comes first! 🌟🤝📈
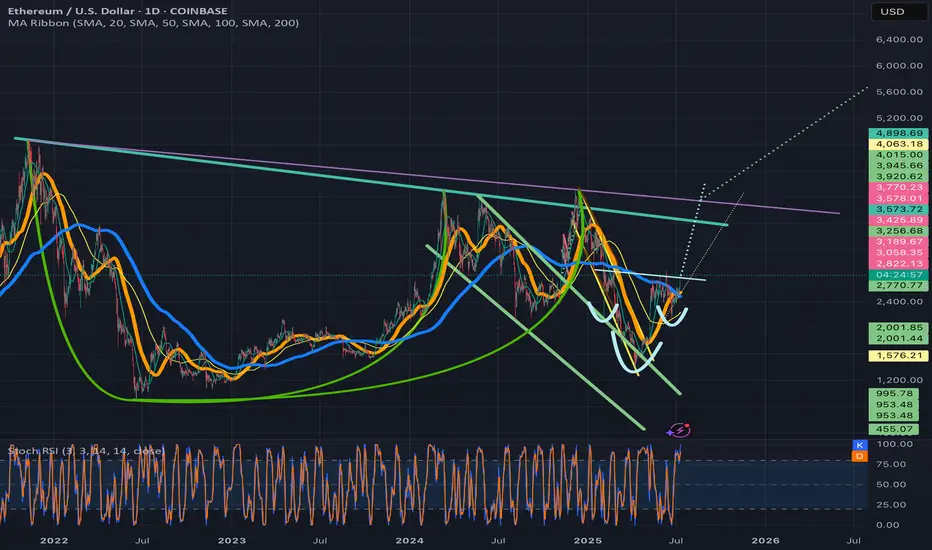
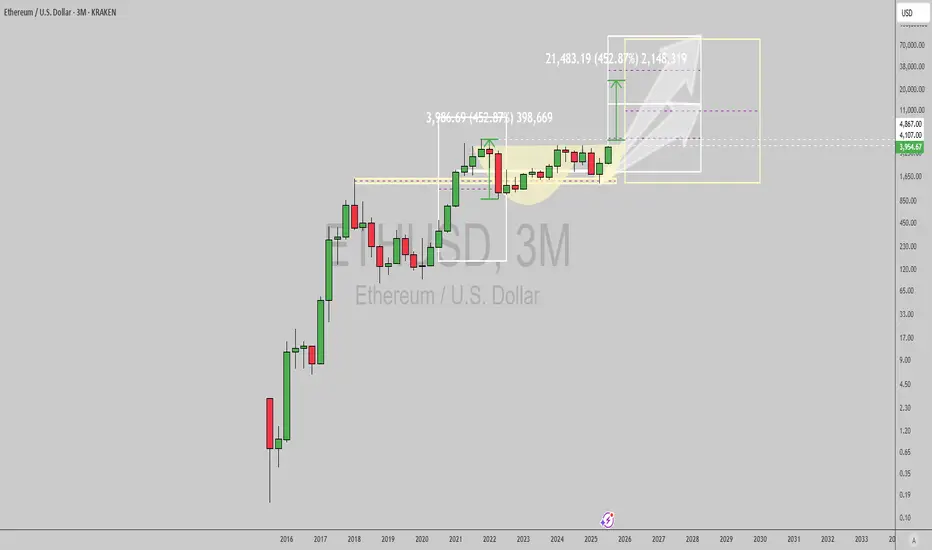
$ETHUSD: Long term trend and cup and handle pattern...Ethereum is finally very close to breaking out into a new 52wk high following a long term basing pattern that looks like a classic cup and handle. Timemode signals warned us of its bullishness earlier, as the daily, weekly, monthly and now quarterly trends turned bullish one after the other since April this year.
If you're sidelined or short, join the bulls and go long ASAP. Risk is a drop under $1715 for the long term patterns at play here, projected targets range from 10k to 95k long term. Fundamentals as you probably know favor a massive bullish trend as ETH transaction count breaks ATH, institutions race to acquire more ETH day to day, ETF flows are steadily bullish and regulations have become favorable for the growth of defi via stablecoin and RWA adoption, as well as potential for new defi primitives and existing ones to gain traction with widespread use.
Ethereum defi now is secure and solid enough, and can handle the required throughput, and the wheels are in motion for a spectacular move from here.
Best of luck!
Cheers,
Ivan Labrie.
ETH | Ethereum Game Plan - Swing Long IdeaETH | Ethereum Game Plan - Swing Long Idea
📊 Market Sentiment
Market sentiment remains bullish, supported by expectations of a 0.25% rate cut at the upcoming FOMC meeting. The weakening USD and rising risk appetite across global markets are favoring crypto assets in particular.
📈 Technical Analysis
Price swept the range low (Weekly Fair Value Gap), resulting in a deviation.
It then aggressively reclaimed higher levels and closed above key resistance.
A 12H demand zone was formed during this move.
We’re now seeing a retracement towards that 12H demand zone.
📌 Game Plan
I’m looking for price to hit the 12H demand zone at $3,530 and show a strong reaction.
This level is also below the 0.5 Fibonacci retracement, placing it in the discount area — an ideal entry zone for me.
🎯 Setup Trigger
After price taps the demand zone, I want to see a 1H–4H bullish break of structure to confirm the reversal before entering.
📋 Trade Management
Stoploss: Below 1H–4H swing low
Targets:
• TP1: $3,872
• TP2: $4,090
I’ll trail my stop to lock in profits aggressively as price moves in my favor.
💬 Like, follow, and comment if this breakdown supports your trading!
More setups and market insights coming soon — stay connected!

Ethereum | ETH | Long at $2,598.77Currently within my historical simple moving average area and consolidating. I suspect a move up is imminent, but 100% speculation. Crypto "bros" know more than I do.
Targets into 2028:
$4,000 (+53.9%)
$5,500 (+111.6%)

ETH | NEW ATH or DUMP ?Ethereum recently peaked at $3900. And allthough this is not a new ATH (close by a few hundred dollars), it is a local high for the year.
My last update was on an inverse Head and Shoulders pattern on ETH, which has since increased over 50%:
(The original idea here:)
The question now, is what's next for ETH - further increase, or are the increases over for the near term and is a correction more likely?
I'm going to say that the increases for ETH are over for now. This is because we correction is most definitely due after such a large increase in a fairly short timeframe. I'm not saying we're heading into a full out bearish cycle, but a 20-25% correction would be most normal at this point.
Additionally, XRP has also made it's peak and lost the high, now trading just under $3. This is a strong sign that the alts have likely already rallied, since XRP used to be the last to increase (if it increased at all, historically. (Thanks Jedd).
I was very lucky to call that top here:
Either way, buyers may use this correction to scoop up on smaller alts over the next few weeks. This ultimately depends on whether the market has ONE MORE pump, and if the correction will bounce back from a 20-25% pullback.
_________________
BINANCE:ETHUSDT

Ethereum is seeking to break through the $4k ┆ HolderStatKUCOIN:ETHUSDT recovered from a swift correction into rising trend support and is pressing back toward the 3.76–3.80k pivot. The broader pattern shows sequential triangle breakouts and a strong sideway accumulation that launched the last vertical leg. If 3.55–3.60k holds on dips, targets sit at 3.85k, 3.95k and the round‑number magnet at 4k. Only a decisive daily close beneath 3.50k would threaten the higher‑low sequence and re‑open 3.35k–3.40k. With breadth improving, the bias remains upward while price consolidates beneath resistance.

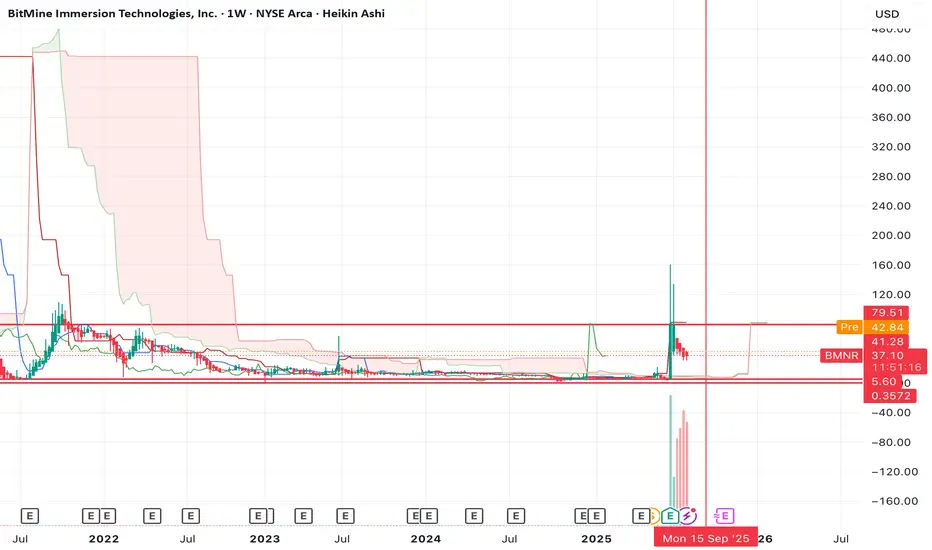
ETH is not having its "2017" moment, neither is BMNRDespite Tom Lee calling for ETH to $18k (which I happen to agree on btw), I think his timing is completely off. He's thinking that ETH is bullish here and that we're going to go to new highs this year.
I think the opposite. I think the top is already in for the year and that we're going to head to new lows first before we make our way to new highs.
BMNR doesn't look good either. The chart is bearish on the 3W and 1M timeframe with a bearish divergence on the RSI.
I think it's more likely that BMNR retests the lows before it sees any large pump.
Let's see how the chart plays out over the coming weeks/months.
DOGE Breakout?After a 13 day rally and a 12 day pullback, could DOGE be breaking out and confirming a new 4H trading range?
After a bounce off the bullish orderblock DOGE has broken out of the diagonal downtrend, then pulled back to retest the previous diagonal resistance level as new support. This is a textbook breakout play & retest but this doesn't 100% guarantee the breakout will be successful. Should it be a successful breakout Local Resistance is the first clear level of interest for the bears to fight back.
This type of setup does give a clear invalidation should price fall back into the downtrend with acceptance. A fakeout could also lead to a loss of the Major Support level, that would introduce a potential revisit of $0.166.

ETH Charging at $4K
ETH on the 4H
And just like that, ETH is knocking on the $4K door again. This move is absolutely beautiful.
After losing the 0.236 Fib last week and bouncing from the 0.5, ETH made another attempt earlier this week — got rejected — then broke above 0.236 like it was nothing.
Now, price is retesting yesterday’s close (black dotted line), which aligns with last week’s highs and is acting as short-term support. It’s gathering strength for the next push at $4K.
All signals align:
• MLR > SMA > BB Center
• PSAR flipped bullish
• RSI is cooling off
• MACD is fully bullish
Structure remains strong. Momentum is building.
ETH-related bullish news and stablecoin narratives are flooding the timeline.
I’ve started scaling back in and am watching how price reacts to the $4K resistance.
This part takes patience and focus — I’ll keep updating this idea as it evolves.
Always take profits and manage risk.
Interaction is welcome.

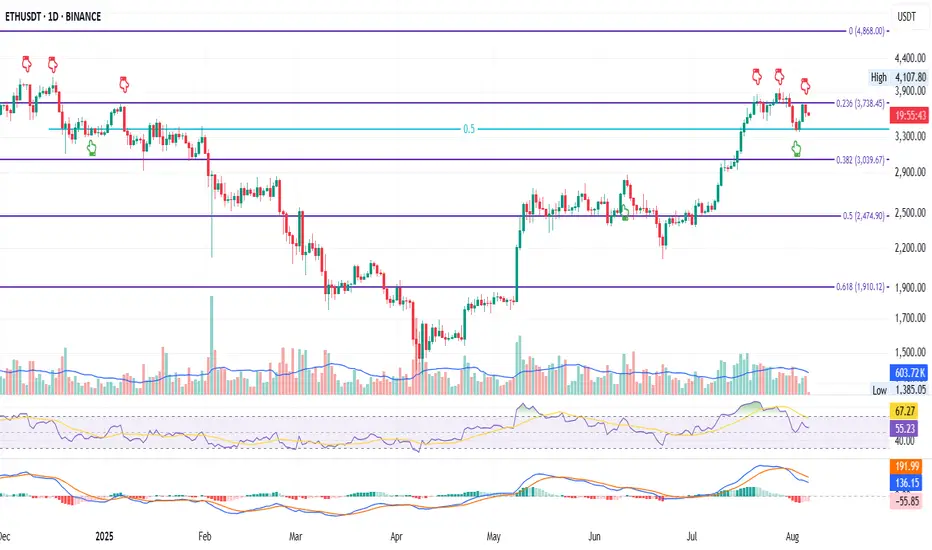
ETH Daily: Lower High, Lower Low. That Was My Signal
This is ETH on the Daily
Price action today looks very similar to December 2024.
Back then, ETH attempted twice to flip the 0.236 Fib level at $3378.45 — first on Dec 6, then on Dec 12. Both failed. Price found support at the 0.5 (midpoint between the 0.236 and 0.382), bounced, got rejected again at the 0.236, then went lower.
Now, we’re seeing a near-identical pattern:
– First attempt to reclaim the 0.236 Fib on July 21
– Second attempt on July 27
– Both failed
– Price found support again at the 0.5 middle level
– Bounced back to the 0.236
– Got rejected again
What will happen this time?
For me, the answer already came: we’ve now seen a lower low followed by a lower high — a temporary break of bullish structure. That’s my cue to scale out of my long and reduce exposure so I’m not caught off guard overnight.
Now that I’ve done that, I can observe the chart objectively without emotional bias or panic-selling.
Technically, ETH is in a short-term downtrend.
Fundamentally, however, I believe we’re in the early stages of a larger uptrend, driven by strong bullish news around crypto (happy to list them if you're curious).
But until those bullish narratives start kicking in and price moves up again, I have to be extremely careful not to get wiped out — so I’ll stay closely aligned with price action.
Like I said: short-term downtrend, long-term opportunity.
Always take profits and manage risk.
Interaction is welcome.
$ETH \ $BTC GONNA SEND INCOMING!The Ethereum-Bitcoin parity saw a local bottom after a long-term correction phase and began to move upward. The upcoming process will continue with a sharp upward trend.

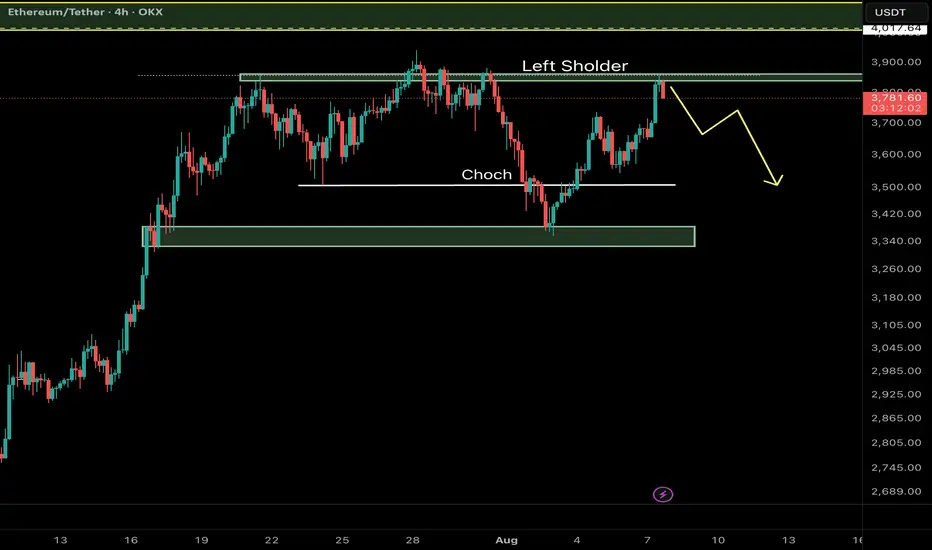
Ethereum (ETH/USDT) – Key Reversal Zone RetestAfter a major CHoCH (Change of Character) on the 4H timeframe, Ethereum has shown a strong bullish move from a high-probability demand zone and is now retesting a critical resistance area aligned with the Left Shoulder of a classic RTM pattern.
⸻
🔍 Key Technical Elements:
• CHoCH confirms the shift from a distribution phase to accumulation.
• Strong reaction from a demand zone near $3,340–$3,380.
• Price is now testing the Left Shoulder, which often acts as a reaction zone before continuation.
⸻
📌 Potential Scenarios:
🔼 Bullish Case (Primary):
If ETH breaks and closes above $3,870, a move toward the next liquidity pool around $4,010–$4,050 is likely.
🔽 Bearish Case (Alternative):
Failure to hold above the current resistance may lead to a pullback toward the $3,340–$3,380 demand zone for another accumulation attempt.
⸻
💡 Educational Note:
In RTM methodology, retests of the Left Shoulder after CHoCH are considered one of the most efficient entry zones — especially when confluence with liquidity voids or imbalance exists.
Follow for more Smart Money & RTM insights.
ETHSimple chart :
- Don’t fight the trend, just stick to your strategy.
- follow the signs.
- Never go all in and always DCA.
Only this way we will learn to master our emotions.
Happy Tr4Ding !

Ethereum Not Dead- i know some peoples think ETH will go to 250$ or 500$, so wait for it...
- I've always maintained that I'm not a fan of ETH because of its scalability limitations and centralization, for that reason ETH needs some messy L1...L2...etc..
- That said, my opinion doesn’t matter much, ETH is here to stay. The Ethereum ecosystem hosts thousands of projects; I’d say it’s too big to fail.
- i used Bitstamp exchange to look further back in the chart's history.
- i simplified this monthly chart so much that even a 10 year old kid could understand it, just check the RSI low levels and compare it with previous years. Again, check the max RSI level for the previous ATHs.
- i won't discuss where to buy because, whether you get ETH at $1,800 or $1,500, the bull run for ETH and Altcoins hasn't started yet.
Happy Tr4Ding !
