ETH Price Action Explained – What the Charts Are Really Saying?🔍 Taking a look at Ethereum ETH right now across multiple timeframes…
On the lower timeframes ⏱️, we’re seeing a bullish break 💥 that might spark some enthusiasm 🚀, but when you zoom out and get that macro perspective 🌐, my outlook shifts from to one of caution ⚠️.
📊 ETH is currently trading into a key resistance level 🧱, and if we step back and view the bigger picture, we can clearly see that it’s been range-bound 🔁 for quite some time.
On the lower timeframes, there might be an opportunity to squeeze a bit out of the range 🎯 by trading between the highs and lows—but keep in mind, this approach is not for the feint hearted ⚡.
📹 This video is purely analysis 🧠, not a trade idea. I’m sharing my thoughts and market view 📈, and I hope you find it helpful and insightful 💡.
🚫 Not financial advice.
ETH

ETH is still bearish (4H)This analysis is an update of the analysis you see in the "Related publications" section
Ethereum has now reached a support zone after sweeping the liquidity pool and the supply area at the top of the chart, as marked in the previous analysis. It has lost the trendline, and a slight upward recovery is expected before potentially being rejected again toward lower levels.
A daily candle closing above the invalidation level would invalidate this analysis.
For risk management, please don't forget stop loss and capital management
Comment if you have any questions
Thank You

Pending for a big moveEthereum (ETH) has been trading within a sideways range since May 10, fluctuating between $2,400 and $2,700.
Recently, it has established a new support level around $2,500, suggesting that higher lows are forming.
A confirmed breakout requires a daily candle close above the $2,700 resistance level (200Days MA).
DYODD

ETH showing strength is a good sign for alts.ETH flagging out here is a good sign of a healthy exchange of hands before a continuation. However, the bearish thesis should be considered, there is a volume gap below that defines an imbalance in price. A drop to $1.8k is very possible.
Full TA: Link in the BIO

ETHUSD short-term🔍1. Technical situation
ETH/USD is in a consolidation phase — the price is moving in a rather narrow range, without a clear upward or downward trend.
📊
The upper limit of this consolidation is the resistance zone of USD 2,664–2,717 (green rectangle on the chart).
The lower limit is the support zone of USD 2,495–2,446 (red rectangle).
2. Potential formation
A potential double bottom formation can be seen on the chart, which is a classic trend reversal formation to an upward one.
The lows occurred around May 25–31 and at the end of May.
Confirmation of the formation would be a breakout of the resistance zone of USD 2,664–2,717.
3. Technical indicators
RSI:
Currently, the RSI has rebounded from zone 40 and is heading up. Exceeding the 50 level may be a signal of buyers' strength and support for the bullish scenario.
On the chart: "Potential rebound signal - watch break above 50"
MACD:
MACD is close to generating a momentum change signal (potential intersection of the MACD and signal lines).
On the chart: "MACD near signal - watch for momentum shift"
4. Scenarios for the coming hours/days
Bullish scenario (up):
✅
If the price breaks above USD 2,717 (exit from consolidation upwards), a dynamic move towards USD 2,800 can be expected.
Support for this scenario will be signals from RSI and MACD.
Bearish scenario (down):
🔻
If the price rejects the resistance zone and returns below USD 2,446, the risk of going down to the next support in the area of USD 2,300 increases.
🧠
Summary
Key Levels:
📌
Support: $2,495-$2,446
Resistance: $2,664-$2,717
Currently, the market is in consolidation with an attempt to break out to the top.
Watch for: Resistance breakout (potential bullish signal) and support reactions (potential bearish).
Pattern: Potential double bottom - needs confirmation.

$ETH Analysis — Correction Incoming?Summary:
After a strong ~100% rally in ETH, price hit a major resistance zone near $2734.78, triggering a significant sell-off, likely driven by algorithmic profit-taking. Now, the market is poised for a healthy correction before another potential leg up.
📉 What's Next for Ethereum?
🔍 Expecting a Correction of 7% to 25%
Based on technical structure and indicator behavior, ETH is likely to retrace to one of the two key zones:
✅ Primary Buy Zone ("Most Likely"): $2297.20
This zone aligns with previous structure support.
It’s where the price may form a higher low and resume its upward trend.
Ideal for opening a swing long with a tight risk-reward ratio.
🔥 Deeper Correction Opportunity: $1779.58
While less likely, a drop to this level would be a major long opportunity.
Aligns with historical demand and long-term support levels.
Also intersects with the yellow trendlines suggesting trend-based support zones.
📊 Why This Correction Makes Sense:
Weekly Money Flow Index (MFI) is Dropping:
MFI divergence suggests money is flowing out, weakening bullish momentum.
A trigger wave is forming, often preceding price corrections.
Algo Profit-Taking is Done:
Smart money likely exited around $2734.78 (highlighted in chart).
They’ll need to accumulate again at lower levels before the next rally.
📈 Potential Upside Targets:
If ETH respects the structure and finds support around $2297 or deeper, we could see a rally toward $3296.85 — a key Fibonacci extension and psychological level.
🧘♂️ Reminder:
No emotional entries. Let the price come to you. Trust the setup and stick to your plan.
📌 Disclaimer: This is not financial advice. Just a breakdown of my trading thesis. Always manage your risk.

Ethereum Vs Bitcoin —Bare Minimum, 222.22% Profits Bullish WaveEthereum's current move vs Bitcoin —ETHBTC— is over-extended:
1) The drop has gone way beyond the 0.786 Fib. retracement level, almost reaching 1 (which means a 100% correction).
2) Trading volume is non-existent. Which means that this move is not supported by real people.
3) The RSI is oversold. Which means that the current action is very likely reaching its end.
4) Ethereum (ETHBTC) is trading at, and activated, the lowest prices since late 2019. The main support zone for this pair.
The current bearish move is over-extended and is showing many weaknesses, a trend reversal can happen any day. ETHBTC has been dropping since December 2021. A market can only take so much.
The minimum target for the reversal is the baseline level. Just as ETHBTC went down to test its 2019 support but with a higher low, as soon as this support zone is reached the reverse becomes true. Now ETHBTC needs to test its late 2023 early 2024 resistance zone. This level is likely to break and price reach higher but this is the bare minimum.
» The bare minimum is a nice 222.22% profits potential bullish wave.
Namaste.

Bearish drop?Ethereum (ETH/USD) has rejected off the pivot and could drop to the 1st support.
Pivot: 2,687.43
1st Support: 2,304.68
1st Resistance: 2,856.33
Risk Warning:
Trading Forex and CFDs carries a high level of risk to your capital and you should only trade with money you can afford to lose. Trading Forex and CFDs may not be suitable for all investors, so please ensure that you fully understand the risks involved and seek independent advice if necessary.
Disclaimer:
The above opinions given constitute general market commentary, and do not constitute the opinion or advice of IC Markets or any form of personal or investment advice.
Any opinions, news, research, analyses, prices, other information, or links to third-party sites contained on this website are provided on an "as-is" basis, are intended only to be informative, is not an advice nor a recommendation, nor research, or a record of our trading prices, or an offer of, or solicitation for a transaction in any financial instrument and thus should not be treated as such. The information provided does not involve any specific investment objectives, financial situation and needs of any specific person who may receive it. Please be aware, that past performance is not a reliable indicator of future performance and/or results. Past Performance or Forward-looking scenarios based upon the reasonable beliefs of the third-party provider are not a guarantee of future performance. Actual results may differ materially from those anticipated in forward-looking or past performance statements. IC Markets makes no representation or warranty and assumes no liability as to the accuracy or completeness of the information provided, nor any loss arising from any investment based on a recommendation, forecast or any information supplied by any third-party.

BRIEFING Week #22 : Still waiting for OilHere's your weekly update ! Brought to you each weekend with years of track-record history..
Don't forget to hit the like/follow button if you feel like this post deserves it ;)
That's the best way to support me and help pushing this content to other users.
Kindly,
Phil

ETH >>> Inverse Head & Shoulders Breakout Sets Stage for RallyHello guys!
Ethereum has formed a textbook inverse head and shoulders pattern on the 15-minute timeframe and just confirmed a breakout above the neckline. This bullish reversal formation comes after a sharp downtrend, signaling a potential shift in short-term momentum.
📌 Breakout Level: ~$2,645
🎯 Potential Target: ~$2,730–$2,750 based on the pattern height
🟦 Retest Zone: ~$2,620–$2,640
We’re currently seeing a healthy breakout followed by a possible retest of the neckline, which could offer a solid entry for continuation toward the upper boundary of the channel.
If bulls hold this structure, ETH could accelerate higher in the coming sessions.

ETH (Daily) Holding up significantly wellETH is holding up its motif wave 1 rally significantly appearing to have completed an ending diagonal for wave 5 after finding a bottom at the major support high volume node (HVN).
Wave 2 is expected to retrace to the S1 pivot, 61.8 Fibonacci retracement and HVN at $1930 but may be front run at the daily pivot and wave 4 bottom $2300.
Safe trading

Ethereum: $2,000 Entry LONG Opportunity: Advanced Trading TipsBe careful when SHORTing here. The downside is limited but the upside is unlimited. Ideally, we trade with the trend. With the bottom being set 7-April, it would be wiser to wait for the higher low and go LONG. Now, bears are bears and bears are going to SHORT and that's ok. Just don't do it if you lack experience because it is harder than a LONG trade.
So here is the chart. The exact support level I cannot say but a bearish continuation looks high probability.
A $500 drop equals 20%. If you are doing 5X, this caps your profits potential to 100%. This isn't bad considering that it can happen within days. Experts only.
On the other hand, 3-10 days should be the maximum but of course, it can extend—these are just rough estimates.
This is how it is done from the bullish side, my side.
We wait patiently for the market to complete its retrace. We know it is a retrace because it is short-lived and because it ends in a higher low compared to the last major low.
We wait patiently for the drop and for clear reversal signals to show up on the chart. Once we have clear reversal signals, we go LONG. Very simple.
If you bought the LONG from the $1,570 level, then of course, nothing needs to be done. Sell a bit at each resistance, buy more at support. You can reduce your position even now. Remember, no need to get the exact top nor exact bottom. So you can sell some now, take profits; great. Then buy some more when prices are low. Your buy price can be $1800, $2000, $2100, it doesn't make much difference. What matters is selling high and buying low.
The first step is to get the great entry. Done. We did this back in April. The second step is to play the market as the bull market unravels. See how much time there always is to take action. Plenty of time to buy we had, plenty of time to sell.
For this to be profitable and successful we have to plan beforehand.
Here I am giving you live step by step instructions and this can also be done. But the truth is, people went LONG at resistance with high leverage and ended up losing everything, because we tend to trade based on an impulse. No, no, no.
Instead, detach, wait for the perfect moment and go LONG/SHORT.
Which one you prefer, bull?
Then wait for support and go LONG. Do not trade against your preferred bias.
Are you a bear?
Wait for resistance SHORT the retrace or wait for the correction. But this is many times harder of course because the downside is limited.
I hope you find this information useful and if you do...
Good luck.
Namaste.

Important Turning Point: M-Signal Indicator on 1M Chart
Hello, traders.
If you "Follow", you can always get the latest information quickly.
Have a nice day today.
-------------------------------------
(ETHUSDT 1M Chart)
The key is whether the price can rise above the M-Signal Indicator on 1M Chart and hold it.
Accordingly, we need to see if it can rise with support near 2498.60, which is the 20 point of StochRSI.
If not, and it falls, we need to see if the HA-Low indicator is generated.
If the HA-Low indicator is generated, we can create a trading strategy based on whether there is support near that area.
-
(1D chart)
The key is whether it can rise with support near the M-Signal indicator on the 1D chart.
In other words, we need to see if it can rise with support near 2498.60-2609.74.
If not, it is expected to fall to the M-Signal indicator on the 1W chart and determine the trend again.
-
The current important support area is the 1647.06-1861.57 area.
The resistance zone is 3265.0-3321.30.
However, if the HA-Low indicator is newly created as the price falls, it is important to see if there is support around that area.
In any case, the price must be maintained above the M-Signal indicator on the 1M chart to continue the upward trend in the medium to long term.
Therefore, when it falls below the M-Signal indicator on the 1M chart, you should not forget that a short and quick response is required when trading.
-
Thank you for reading to the end.
I hope you have a successful trade.
--------------------------------------------------
- This is an explanation of the big picture.
(3-year bull market, 1-year bear market pattern)
I will explain more details when the bear market starts.
------------------------------------------------------

ETH looks good and bullish dont , its just ranging if Eth break level above (2800) its next target its 3300-3400 usd,

ETH's situation+ Target PredictionCurrently, ETH is forming an ascending triangle and cup and handle, indicating a potential price increase. It is anticipated that the price could rise, aligning with the projected price movement (AB=CD).
Continued strength could lead to upward movement toward targets at $2700, $2900, and $3.100
However, it is crucial to wait for the triangle to break before taking any action.
Give me some energy !!
✨We spend hours finding potential opportunities and writing useful ideas, we would be happy if you support us.
Best regards CobraVanguard.💚
_ _ _ _ __ _ _ _ _ _ _ _ _ _ _ _ _ _ _ _ _ _ _ _ _ _ _ _ _ _ _ _
✅Thank you, and for more ideas, hit ❤️Like❤️ and 🌟Follow🌟!
⚠️Things can change...
The markets are always changing and even with all these signals, the market changes tend to be strong and fast!!

SEIHead and Shoulder Pattern is seen in the chart,
Breakout of Neckline will give a huge pump 🚀🚀🚀
Can grab some here 💰

Altseason is cancelled for now. But Should resume soon.If you're interested in altcoins, be sure to check out my ideas. I’m closely tracking CRYPTOCAP:BTC.D and CRYPTOCAP:OTHERS , and you’ll find plenty of valuable insights in those analyses.
So, what’s going on? My CRYPTOCAP:OTHERS prediction played out — May was bullish. But was it the real altseason? Not quite. The true altseason typically begins at the end of the Bitcoin cycle, and we’re not there yet.
Right now, we’re seeing price action reminiscent of December 2024. Bitcoin maximalists are aggressively buying BTC during a time it should be correcting, which is inflating BTC dominance and crushing any momentum for an altseason. They appear to be using altcoins as exit liquidity to pump BTC, especially as retail investors hesitate to buy Bitcoin above $100K.
What’s next?
The daily MACD suggests we’re entering a correction phase that could last around two weeks. A drop toward $1.2T is likely, as there's a major order block between the current level and that target. However, the real support lies below $900B — my "green box" — which I view as the ideal buy zone.
Historically, entries in this green box have offered 2x–3x returns on high-volatility altcoins from the top 100, especially in sectors like memes, DeFi, and AI.
I expect altcoins to correct into that zone in the coming weeks — keep an eye on it.
DYOR (Do Your Own Research).
#Crypto #Altcoins #Bitcoin #BTC #BTCdominance #Altseason #CryptoMarket #CryptoTrading #MACD #TechnicalAnalysis #DeFi #MemeCoins #AIcoins #AltcoinSeason #DYOR

SUSDT - 1WThe previous bullish analysis failed and I currently expect a correction to the range of 0.3 to 0.33 cents...


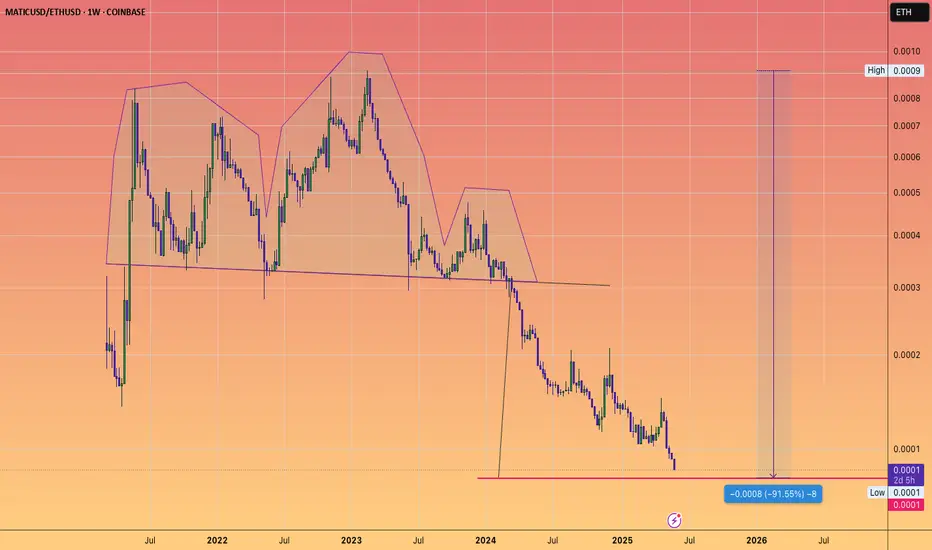
MATIC approaching Head and shoulders target...versus ETH
which would be a -91% loss of value versus the second most important crypto
ETHEREUM can reach $10000 if 2017 is repeated.Ethereum / ETHUSD is consolidating under the 1day MA200 (resistance) and over the 1day MA50 (support).
The 2025 correction has been quite similar so far to 2016, both bearish Channels bottoming on a Triangle pattern and then rebounding.
In 2017 that rebound resulted in an insane rally above the 3.0 Fibonacci extension.
Even if the market doesn't rise this time this aggressively and that quickly, it can still approach the 3.0 Fib at 10000 and form the top for this Cycle.
Follow us, like the idea and leave a comment below!!

ETHEREUM Wedge Breakout! Sell!
Hello,Traders!
ETHEREUM was trading in an
Uptrend but then the coin
Formed a bearish wedge pattern
And we are now seeing a bearish
Breakout so we are locally
Bearish biased and we will be
Expecting a long awaited
Bearish correction
Sell!
Comment and subscribe to help us grow!
Check out other forecasts below too!
Disclosure: I am part of Trade Nation's Influencer program and receive a monthly fee for using their TradingView charts in my analysis.

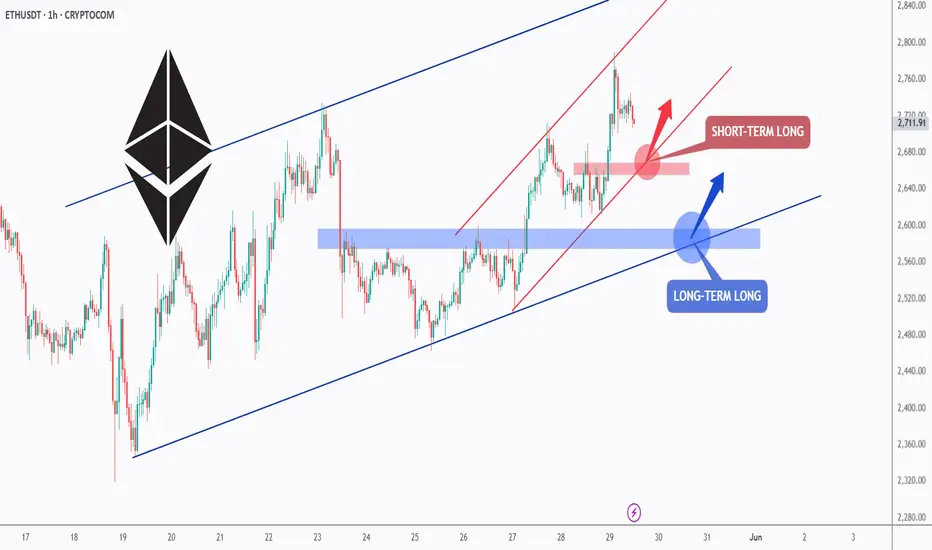
ETH - Long Anyway, Short-term and Long-term!Hello TradingView Family / Fellow Traders. This is Richard, also known as theSignalyst.
📈ETH has been overall bullish trading within the rising blue channel from a long-term perspective and within the rising red channel from a short-term perspective.
Moreover, the red and blue zones are strong support and structure!
🏹 Thus, the highlighted blue and red circles are strong areas to look for buy setups as it is the intersection of the lower zone(s) and trendline(s).
📚 As per my trading style:
As #ETH approaches one of the circles, I will be looking for bullish reversal setups (like a double bottom pattern, trendline break , and so on...)
📚 Always follow your trading plan regarding entry, risk management, and trade management.
Good luck!
All Strategies Are Good; If Managed Properly!
~Rich