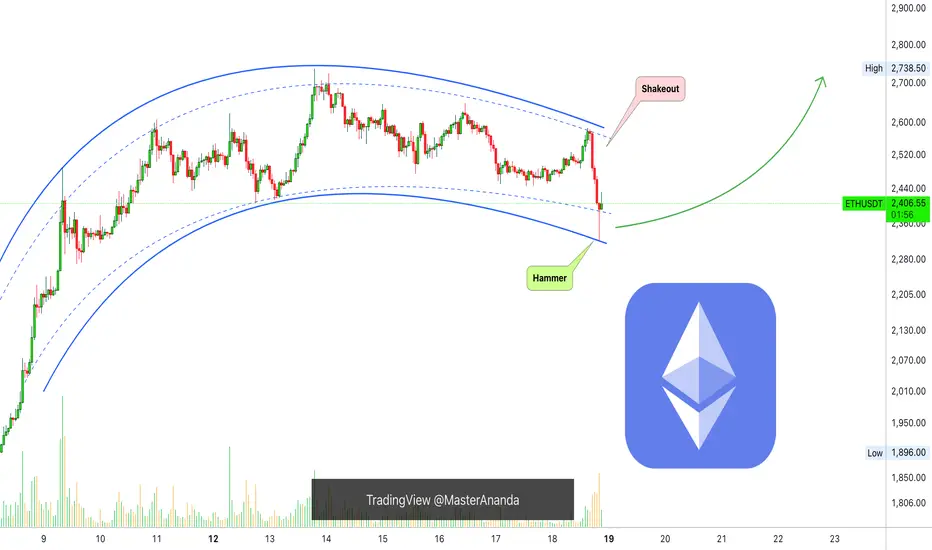
Ethereum Short-Term, Bullish Or Bearish?Notice this recent shakeout on the chart, this is a major move and surely removes lots of over leveraged positions. It also traps the bears, a bear-trap.
If this move continued lower it would be bad news but the 1H candle ended with a long lower wick, producing a hammer which is a reversal signal. This candle produced the lowest price since 9-May, 9 days ago, and the current candle is green, this tells us that a shakeout is confirmed.
The bearish move is a failed signal so the next move is up. With a very small bullish continuation, the current candle closing at current price or higher, it is confirmed ETHUSDT to continue rising.
(If the current candle were to close red and lower this would be a bearish confirmation.)
Short-term bullish structure intact. It is normal to see the market shaking before a major move. Remember, Bitcoin is about to close its 6th consecutive week green, the most bullish development of the decade. This affects Ethereum of course and the entire Cryptocurrency market.
Namaste.
ETH
LINK/USDT - Long trade LINK / USDT Update 🔔
I couldn’t be more bullish on the LINK trade we’re holding right now.
We’ve got a textbook inverse head and shoulders playing out... neckline broken, perfect retest, and now a bullish engulfing candle confirming the move. Structure couldn’t be cleaner. This is exactly what you want to see after a breakout. Now could be a good idea to add to your position size on the LINK trade.
Holding strong here with eyes on the $18.20 and $19.53 short term targets. As long as price holds above the neckline zone, this setup remains high-conviction.
Big upside potential from here. Let’s ride it. 🔥

SEI breaks the downtrend targets 30cThe SEI network is currently displaying positive price movement after recently breaking out of a downward trend channel that had been in place since the peak on December 5th. On the daily chart, it has been trading sideways within the upper channel, indicating a potential retest of that breakout. However, the momentum isn't particularly strong, especially since Ethereum, the frontrunner in the altcoin resurgence, isn't exhibiting explosive upward movement either.
Should the situation shift and Ethereum regain its leading position, I believe that many struggling smart contract platforms, which have seen their prices plummet by over 80%, could also experience a robust recovery.
If Ethereum manages to climb back into the $2,000+ range, I anticipate that SEI will reach its target on the chart, which is approximately 30 cents.

eth buy midterm"🌟 Welcome to Golden Candle! 🌟
We're a team of 📈 passionate traders 📉 who love sharing our 🔍 technical analysis insights 🔎 with the TradingView community. 🌎
Our goal is to provide 💡 valuable perspectives 💡 on market trends and patterns, but 🚫 please note that our analyses are not intended as buy or sell recommendations. 🚫
Instead, they reflect our own 💭 personal attitudes and thoughts. 💭
Follow along and 📚 learn 📚 from our analyses! 📊💡"

ETH/USDTAlt Market on Watch — All Eyes on ETH ⚠️
Despite a strong start to the week, some red flags are starting to show up on the horizon.
The spotlight is on ETH — it’s the key to what’s next for the altcoin market.
In the last update, I shared altcoin levels to work from,
but right now ETH should be your primary reference.
📍 $2400 is a major zone — I’m watching for a reaction there to get aggressive on alt entries.
❌ If that zone doesn’t hold, we’re likely heading down to $2200–2100, possibly even $1900.
No need to overexpose — I’m sitting mostly in cash, waiting for clear signals.
🚫 And most importantly — this is not a short setup (yet).
Let’s wait for the new weekly open before making any big moves.

$ETH quick longWe have in a demand zone while we are on a weekend, so I expect a push to test the trendline
Targets in chart.
ETHUSD - Support Line Reestablished A major support line has been recovered on this ETH daily chart
One that previously led to a strong breakout
From here price will find support on this line and then pop off again
Good time to buy ETHUSD
Daily chart

ETHBTC Is it repeating its first Cycle?I know that the timeframes are not the same but don't tell me that the structure between then and now isn't similar.
The biggest difference is that in 2016 ETHBTC made a deeper low than now, but the current rebound is showing signs that we might have a similar parabolic rise.
Now will that be enough to give a new All Time High?
We will see, but don't tell me that this can't target 0.0900 byu the end of the year.
Follow us, like the idea and leave a comment below!!

BDP. Deep Underrated Value.Market veteran and remains in business - building, researching for five years. The chart is global - weekly and a global downward channel is visible, in which the price can move x50 - amazing. Possible channel breakout will send the price to x360 and capitalization to 500 million, which is not unattainable given the niches in which the project positions itself. Me in game, sirs, prepare.

ADAUSDT IDEAI think chart looks pretty clear now. Red supply area properly laid down. Along with price properly taking buys from demand area in blue with higher lows. So obvious path will be the movement above supply till next supply (red area). Remember the supply is selling area (no retest concept) so strong selling could also originates. so trades are only after breaking out with clear price marching above supply zones.

ETH is still Bullish!!Hello TradingView Family / Fellow Traders. This is Richard, also known as theSignalyst.
📈This week, ETH has been in a correction phase. However it is still overall bullish long-term trading within the rising channel marked in blue.
Moreover, the green zone is a strong demand and structure.
🏹 Thus, the highlighted blue circle is a strong area to look for buy setups as it is the intersection of structure and lower blue trendline acting non-horizontal support.
📚 As per my trading style:
As #ETH retests the blue circle zone, I will be looking for bullish reversal setups (like a double bottom pattern, trendline break , and so on...)
📚 Always follow your trading plan regarding entry, risk management, and trade management.
Good luck!
All Strategies Are Good; If Managed Properly!
~Rich

ETHBTC: Ethereum to gain massively against Bitcoin.Ethereum is overbought on its 1D technical outlook (RSI = 72.854, MACD = 228.230, ADX = 38.542) due to the rebound it initiated last week. Even though it is still on its very early stages, this rebound and statement of its strength is better viewed on the ETHBTC pair against Bitcoin. As you can see, ETHBTC bottomed on a level that it hasn't seen since January 6th 2020. The massive downtrend since 2023 is comparable to the one that started in 2018. Similar bottoms, similar 1W RSI sequences. We expect this rebound to be the main driver all the way to the 7 year Resistance level (R1). Traders of this pair can target 0.0800 on the long term.
## If you like our free content follow our profile to get more daily ideas. ##
## Comments and likes are greatly appreciated. ##

2 possible scenariosEthereum may continue to rise after correction waves. I showed 2 possible scenarios on the chart. If you zoom in a little bit more on the graph you can see the ABCDE waves more clearly. I think at least these waves will be completed.
* The purpose of my graphic drawings is purely educational.
* What i write here is not an investment advice. Please do your own research before investing in any asset.
* Never take my personal opinions as investment advice, you may lose your money.

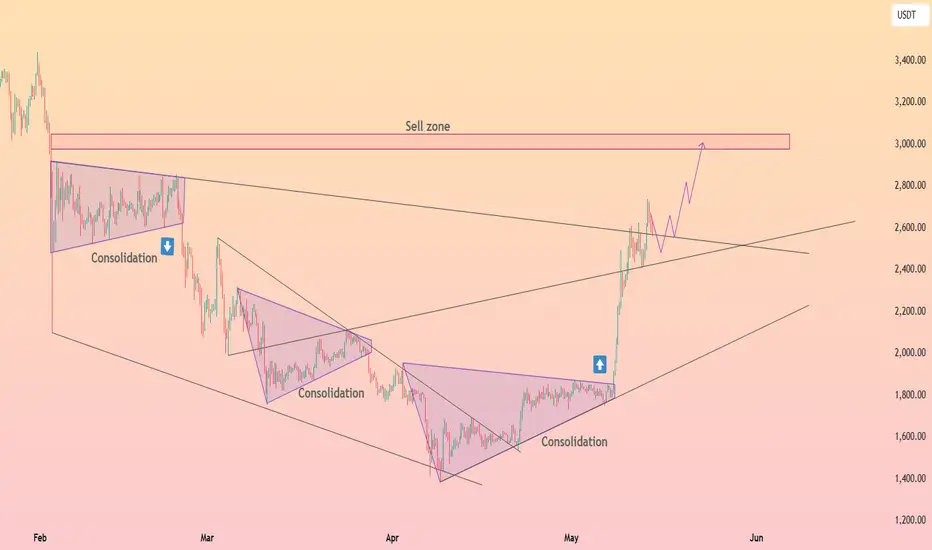
HolderStat┆ETHUSD wedge catapult toward 3kEthereum price tore out of its multi‑month falling wedge and smaller consolidation triangle, blasting through the mid‑2 k range before pausing around 2.7 k. As long as price respects the former wedge roof as trendline support, bulls retain scope to probe the highlighted 2.8‑3.1 k sell zone. A soft pullback into 2.4‑2.5 k would be viewed as a constructive retest rather than trend failure.

Ethereum - Short Term Buy IdeaH1 - Strong bullish move.
No opposite signs.
Currently it looks like a pullback is happening.
Expecting further continuation higher until the two Fibonacci support zones hold.
If you enjoy this idea, don’t forget to LIKE 👍, FOLLOW ✅, SHARE 🙌, and COMMENT ✍! Drop your thoughts and charts below to keep the discussion going. Your support helps keep this content free and reach more people! 🚀
--------------------------------------------------------------------------------------------------------------------
Disclosure: I am part of Trade Nation's Influencer program and receive a monthly fee for using their TradingView charts in my analysis.

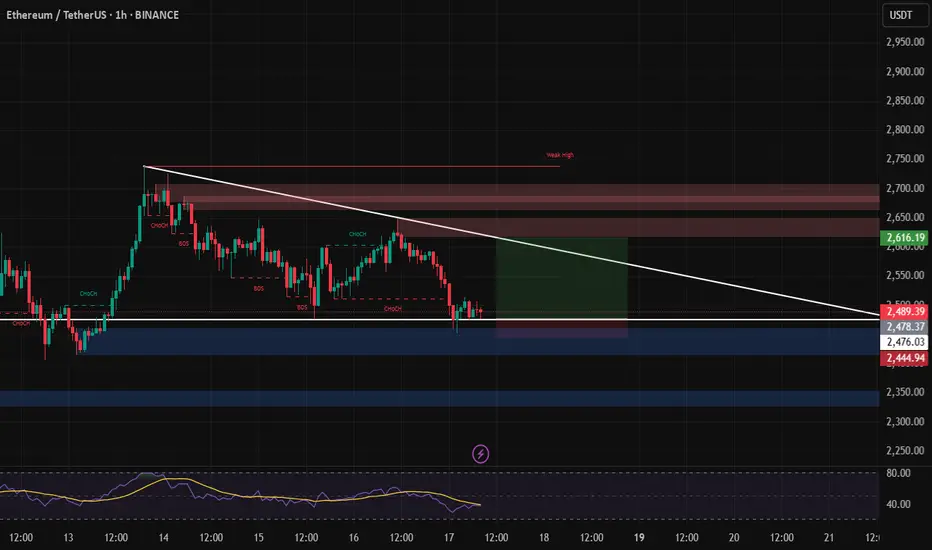
ETHUSD: First red day, day 2 on the backsideHello traders and welcome back on my profile, here is Gianni, and I hope you can enjoy this detailed analysis on ETHUSD.
As always, I don't use technical analysis for market prediction, because predicting is 50/50, but I use it to calculate my risk reward in case I would position myself in the market.
My general thesis for the day is pretty short, and following, the logic behind this thesis.
Monday, opening range of the week, established the current monthly high, breaking into the low of Friday (lower low) at the end of the day. Other time frames/big players might be in play and potentially the week can setup for a pump and dump.
Tuesday performed a strong pumping day, breaking through the Monday high and expanding the range higher, closing as well in breakout long.
Wednesday the market pretty much consolidated for the whole day, coming back inside the opening range high, and closing as first red day.
First red day is only a bearish signal, it doesn't mean that the market will drop certainly, but it gives you a signal the potentially long might be trapped in the wrong direction, increasing the chances of reversal, the day later or few more days later.
Today, Thursday, the market kept breaking lower, and it looks like coiling into the yesterday low of day, definitely a sign of weakness which I will keep in consideration.
8:30am and 8:40am NYT major red news are on schedule, I would not touch this market before that time, avoiding any possibility to be stuck in the trade.
How would I take this trade?
Simply I will be looking for any sell high opportunity after the news, reinforced with bearish price action, as triple tops, double tops and any kind of reversal patterns into the most recent high in place.
What about a long view?
Actually I'm not interested today, it can go higher, it can retest the weekly high, it can consolidate, it can do EVERYTHING, I don't care, my only focus is aligning my bearish thesis with a bearish setup.
I won't take in consideration any long opportunity for the day.
Overall, the market strongly pumped up during the previous week, I do not expect any crazy move, I do not think that this market trapped volume enough for a huge bearish collapse.
The potential opportunity of today, if presented, will be targeting the current weekly low (Monday low).
Stay tuned for further update during the NY session

Ethereum: 96% of Hedge Funders Were Short on Monday!FenzoFx—Ethereum is trading bearishly, having broken below the 50-SMA. Currently, 96.0% of hedge funders are short, while 52.0 percent of institutional traders were long at the beginning of the week.
If ETHUSD remains under the 50-period moving average, the downtrend may persist, with a potential dip toward the 2,420-dollar support. Retail traders should watch for bullish signals, such as a candlestick pattern, near this level.

ETH sub $1k coming soonCRYPTOCAP:ETH is rejecting resistance here. Unless we can flip it as support, then it looks like new lows are coming.
I think the most likely level to find support is at $753, however I marked off other levels that are important incase we find support there.
You'll want to bid these levels because they'll be the buy of the decade, should we get down there.

Ethereum Monthly: Bull-Bear Market & Transition Until 2029Ethereum closed five months red, something seen only once in the past in 2018 in a bear market. Needless to say, after such a strong bearish period the market produced an equally strong bull market.
Back in 2018 Ethereum went beyond five months red but this is the only time ever in its history, then now in 2025 this is the longest stretch of continued bearish action. This is good because we know that the market will produce a bull market that is many times stronger, just to balance things out.
These five red months resulted in a long-term higher low.
The bottom was hit at $1,385 in April, last month. This month we already have a full green candle going mid-way through February. All the loses incurred in April and March have been recovered.
The low last month hit levels not seen since March 2023. In March 2023 ETHUSDT was rising but produced first some bearish action; the month closed green. After more than eight months of consolidation it produced a major advance and the highest prices since the 2021 All-Time High.
This time it will be different. Ethereum will be rising steadily, month after month. Rather than sideways-neutral, up-up.
In 2024 there was a double top. March 2024 and December 2024.
In 2025 we will have one top, a blow-off top. So there will be only one chance to sell when prices are really high up.
It will grow steadily month after month as bullish momentum builds up. After several months, we will have a bull run reaching mania levels, euphoria, excitement and a very strong new All-Time High. After this phase is over, the classic bear market in 2026.
The bear market will produce a multi-year low price, then a period of consolidation, sideways-neutral, and then back again bullish, a major bull market in 2029. There will be growth in the transition years, 2027 and 2028. You can equate these with 2023 and 2024.
2022 was the last bear market.
2026 will be the next bear market.
2021 was the last bull market.
2025 is the next bull market.
2023-2024 were the transition years.
2027-2028 will be transition years.
Thank you for reading.
Namaste.

I'm calling for $10,000 per Ethereum.I think Ethereum could reach $10,000 or even $20,000 if we really go parabolic in wave 5.
We are potentially gearing up for the biggest crypto bull market in human history, and Ethereum should be a major player in this move.
As always, stay profitable.
– Dalin Anderson

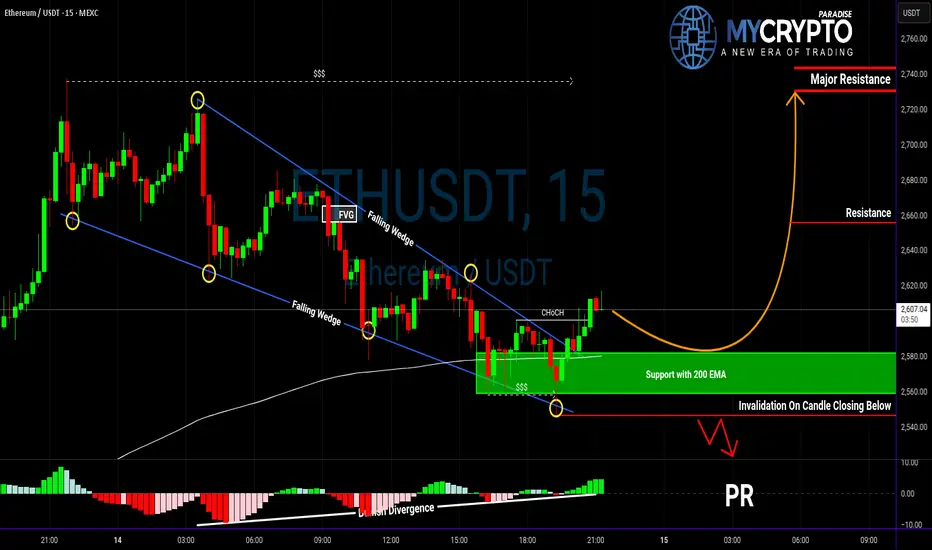
ETH Bulls on Alert: Is This the Move We've Been Waiting For?Yello Paradisers, did you catch that bullish breakout on ETH or are you still stuck waiting for confirmation?
💎Ethereum has officially broken out of its falling wedge pattern, which is a well-known bullish structure often signaling a trend reversal. What gives this breakout even more weight is that ETH has established a support zone exactly at the 200 EMA—an area that historically acts as a key level for institutional traders.
💎Adding to the bullish case, we’ve also identified a bullish divergence on the momentum indicators, which often suggests weakening selling pressure and the potential for upside. More importantly, there has been a clear bullish CHoCH (Change of Character), confirming that market structure is shifting in favor of the bulls. With all of these signals aligning, the probability of a continued bullish move is significantly higher.
💎However, the most disciplined traders understand that no setup is perfect without confirmation. A pullback to the support zone would offer a textbook opportunity for a high-risk-to-reward entry—ideal for bulls who are patiently waiting for a safer entry point rather than chasing the move. This kind of setup allows us to manage our risk properly and act only when the odds are clearly in our favor.
💎That said, if the price breaks down and closes below the support zone, the bullish idea is completely invalidated. This is the level where we draw the line and step aside. Being able to invalidate your own bias is what separates traders who survive from those who don't.
🎖We are playing it safe right now. If you want to be consistently profitable, you need to be extremely patient and always wait only for the best, highest probability trading opportunities.
MyCryptoParadise
iFeel the success🌴
ETH => Shift In Momentum Almost Done!Hello TradingView Family / Fellow Traders. This is Richard, also known as theSignalyst.
📉 Since breaking below its last major low in December 2024, Ethereum (ETH) has been stuck in a bearish trend.
But don’t lose hope, bulls! 🐂
⚠️It’s evident from the last correction phase, marked in blue, that it's larger than the previous ones — a clear sign that the bulls are stronger than ever.
A growing correction phase is often the first signal of an upcoming momentum shift.
This shift will be confirmed once ETH breaks above the last major high marked in red at $2,100.
📈A break above $2,100 would flip ETH’s trend from bearish to bullish, signaling the potential start of the Altcoin season!
Until then, patience is key. 🧘♂️
📚 Always follow your trading plan regarding entry, risk management, and trade management.
Good luck!
All Strategies Are Good; If Managed Properly!
~Rich
