Ethereum Ready to Attack Resistances — Time to Long ETH?Ethereum ( BINANCE:ETHUSDT ) fell to the Support zone($3,538-$3,442) and Support lines as I expected in the previous idea .
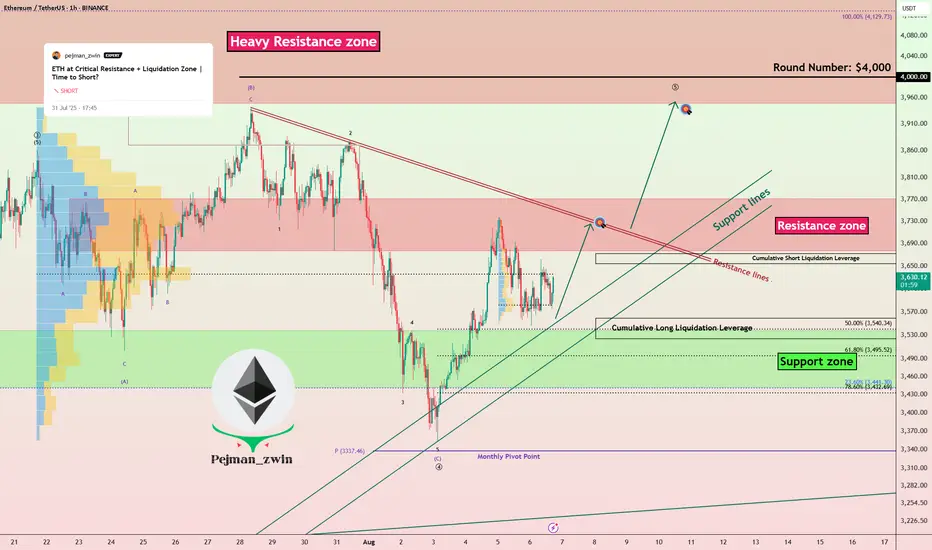
Ethereum is currently trading near the Support zone($3,538-$3,442) , Support lines , and Cumulative Long Liquidation Leverage($3,559-$3,524) .
In terms of Elliott Wave theory , it seems that Ethereum has completed the main wave 4 . The main wave 4 has an Expanding Flat structure(ABC/3-3-5) . To confirm the main wave 4, we must wait for the Resistance zone($3,771-$3,677) and Resistance lines to be broken.
I expect Ethereum to trend higher in the coming hours and attack the Resistance lines and Resistance zone($3,771-$3,677) .
Cumulative Short Liquidation Leverage: $3,672-$3,645
Note: Stop Loss: $3,450 =Worst
Please respect each other's ideas and express them politely if you agree or disagree.
Ethereum Analyze (ETHUSDT), 1-hour time frame.
Be sure to follow the updated ideas.
Do not forget to put a Stop loss for your positions (For every position you want to open).
Please follow your strategy and updates; this is just my Idea, and I will gladly see your ideas in this post.
Please do not forget the ✅' like '✅ button 🙏😊 & Share it with your friends; thanks, and Trade safe.
Ethanalysis
ETH/USDT Bearish Setup – Rising Wedge Breakdown & RetestEthereum (ETH/USDT) has broken down from a rising wedge — a classic bearish pattern — and is now showing signs of rejection after a clean retest of the broken trendline around $3,679.
Structure:
Rising wedge pattern on the higher timeframe
Breakdown confirmed with retest of lower trendline as resistance
No bullish follow-through after retest
Trade Plan:
Bias: Bearish below $3,680
Entry Zone: Anywhere below $3,670–3,680 if rejection is confirmed
Stop Loss: Above $3,720 (invalidation)
Targets:
Target 1: $3,298
Target 2: $2,880
Target 3: $2,640
Key Notes:
If ETH reclaims and holds above $3,680, the setup gets invalidated
Watch BTC behavior — ETH tends to follow
Volume shows no strength from bulls post-breakdown
This setup presents a high-risk, high-reward opportunity if the price continues to decline from this zone.
Conclusion:
Stay cautious, as the market could see more downside if ETH stays below $3,680. Manage risk accordingly.
DYOR | Not Financial Advice

Ethereum (ETH/USDT) – Bearish Channel Structure Developing
⸻
🔍 Technical Overview
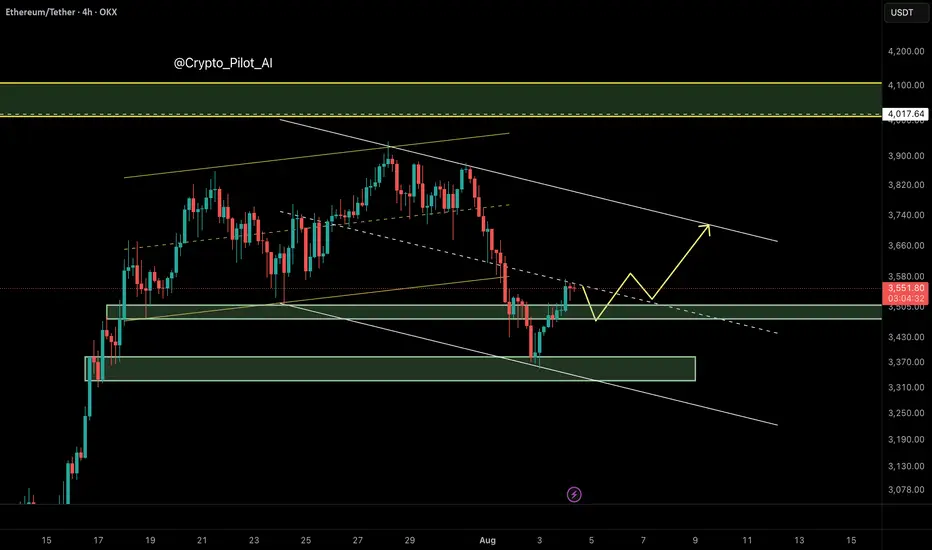
Ethereum has broken down from its ascending channel, invalidating the earlier bullish projection toward $4,000. After failing to hold the channel midline around $3,577, price dropped sharply to $3,360, forming a new bearish descending channel.
Currently, ETH is trading near the midline of this bearish channel, which typically acts as a decision point — not a buying zone — in smart money models.
⸻
🧠 NEoWave Interpretation
We may be inside a Complex Corrective Wave, possibly a Running or Contracting Flat evolving after the March top. The current structure resembles a B-wave trap, where price fakes out the upside before shifting momentum sharply downward. The break below the ascending channel midline confirms this bearish shift.
⸻
📊 Smart Money Summary
• 🟥 BOS confirmed on 1H and 4H (lower highs and lower lows)
• 🔻 Midline failure acted as a smart money trap, followed by a liquidity sweep below $3,490
• 📦 Bullish Order Block around $3,490–$3,520 has been tapped, prompting a minor reaction
• 🟡 Current resistance sits near the channel top ~ $3,715
⸻
🎯 Trade Scenarios
📌 Bearish Continuation:
If price fails to reclaim above $3,715, a retest and rejection from the channel top could trigger continuation toward $3,300–$3,250.
📌 Bullish Reversal (less likely for now):
Only a clean break and hold above $3,720 would suggest that bulls are regaining control, opening path toward $3,900–$4,000 — though this scenario is weakened after structural damage.
⸻
⚠️ Trader Tip:
Avoid buying into midline reactions in weak channels. Better long setups form after stop-hunts, ideally near bullish OBs + internal BOS confirmations.
⸻
✅ Conclusion
Ethereum remains under bearish pressure after losing its ascending structure. Unless price reclaims the $3,715 resistance zone with momentum, downside continuation remains likely.
⸻
📌 Save this analysis
💬 Share your thoughts or alt wave counts in the comments.
ETH Looks Bearish (3D)Ethereum approached the weekly trendline and experienced a correction. It seems likely that we may see one more push upward to create a false bullish sentiment on this coin. There is even a possibility of a fake breakout above the descending trendline. However, before any major move, a significant correction toward the green zone appears likely | after which the main bullish move is expected to occur.
On higher timeframes, this is currently our outlook on Ethereum.
A daily candle closing above or below the invalidation levels would negate the current buy or sell bias.
For risk management, please don't forget stop loss and capital management
Comment if you have any questions
Thank You

Ethereum at Crucial Resistance – Will the Bulls Hold or Fade?Ethereum at Crucial Resistance – Will the Bulls Hold or Fade?”
Ethereum is currently trading near a key resistance zone around $3,800, as marked on the chart. After a strong bullish rally with clear Break of Structures (BOS) along the way, ETH has now reached an extended point where price may face selling pressure.
The Bollinger Bands are stretched, showing overextension, and the marked arrow suggests a possible correction or pullback from this level. A retest of previous support zones (~$3,400–$3,200) could be expected if the resistance holds.
⸻
Key Levels:
• 🔼 Resistance: ~$3,800
• 🔽 Support: ~$3,400 / ~$3,000
• 🔄 Price Action: Watching for rejection or breakout confirmation
This is a textbook case of price approaching a strong resistance level after a bullish wave, where caution and confirmation are key for the next move.

ETHUSD Smart Money Breakdown – Price Rejection from Premium ZoneEthereum has shown a strong impulsive rally after multiple Breaks of Structure (BOS) from early June, signaling a clear shift in market sentiment from bearish to bullish. Each BOS indicates that demand zones have been respected and liquidity has been efficiently used to fuel higher prices — a classic signature of institutional involvement.
🧠 Smart Money Insight
As price aggressively rallied into the resistance zone ($3,600–$3,800), the market entered a premium pricing area, where smart money typically offloads positions and hunts liquidity from late buyers. This area has historically been a high reaction zone — and as seen on the chart, ETH shows signs of buyer exhaustion, suggesting a possible short-term reversal.
🔁 Anticipated Market Behavior
A corrective move is likely from this resistance, and the first target for retracement lies in the support zone around $3,000–$3,200. This level aligns with:
Previous BOS retest area
Fair value imbalance fill
Mid-range equilibrium
If momentum continues downward, the next zone of interest will be the strong support region at $2,200–$2,400, which served as a major accumulation zone. That’s where large orders previously entered the market — and a strong reaction is expected again.
📊 Market Structure Summary:
BOS Confirmations: Validated bullish structure
Liquidity Grab: At resistance – potential sweep and reversal
Premium Zone Rejection: Smart money short opportunity
Discount Zone Targets: Support & strong support zones
✅ Conclusion
ETH is at a critical decision point. If price holds below resistance with continued bearish pressure, a retracement is not only healthy — it's expected. Traders should wait for confirmation of lower timeframe structure breaks before entering shorts, and target the $3,000 zone first, with eyes on $2,200 if momentum persists.

ETH - Back at the Level Everyone Forgot.Everyone’s watching ETH pump right now like it’s something new. It’s not. Look closer:
This is a look back in time to the breakdown that started to slide in Jan 2025.
That clean base around $3300 was holding for months in late 2024. It failed in January Q1, dragged us to sub-$2K by March, but now we’re right back under it.
This isn’t a random pump, it’s ETH revisiting the exact area it broke down from.
• White line = previous floor that gave out
• Dotted line = current price climbing back up into that structure
A move above $2960–$3300 flips the entire structure from resistance to reclaimed floor.
Market memory’s short, but price tends to remember everything.

Ethereum Analysis – Vitalik’s Gas Cap Proposal Adds PressureToday, I want to show you the possible moves for Ethereum ( BINANCE:ETHUSDT ) this week.
Please stay with me .
Let’s first take a look at the important news that has come for Ethereum in the last 24 hours :
Ethereum’s Gas Cap Proposal Sparks Concerns
Ethereum co-founder Vitalik Buterin recently proposed EIP-7983 , introducing a gas limit cap to prevent potential DoS (Denial of Service) attacks on the network.
Bearish Takeaways:
This proposal reveals a current vulnerability in Ethereum’s infrastructure. If gas limits grow unchecked, nodes may fail to sync, leading to possible network instability.
Imposing a gas cap could temporarily reduce transaction throughput, affecting DeFi protocols and NFT platforms that rely on Ethereum’s scalability.
The market tends to react cautiously to core protocol changes, and this uncertainty could trigger short-term selling pressure.
Bullish Counterpoints:
The cap aims to strengthen the network’s long-term stability against spam and DoS attacks.
It’s still in the proposal stage, with no immediate impact on users or network performance.
Conclusion:
While the long-term impact may be positive, the short-term uncertainty and exposed risks provide a bearish narrative for Ethereum, especially amid growing competition from alternative chains.
--------------------------------------
Now let's take a look at the Ethereum chart on the 4-hour time frame .
Ethereum is currently trading near the Heavy Resistance zone($2,929-$2,652) and Resistance lines , and is also trying to break the Support line .
In terms of the Elliott Wave theory , it seems that Ethereum has completed the Zigzag Correction(ABC/5-3-5) , so we can expect the next bearish wave .
I expect Ethereum to fall to at least $2,433 AFTER breaking the Support line, and if the Support zone($2,491-$2,323) is broken, we should expect further declines.
Second Target: $2,374
Note: Stop Loss (SL) = $2,689= Worst Stop Loss(SL)
Please respect each other's ideas and express them politely if you agree or disagree.
Ethereum Analyze (ETHUSDT), 4-hour time frame.
Be sure to follow the updated ideas.
Do not forget to put a Stop loss for your positions (For every position you want to open).
Please follow your strategy and updates; this is just my Idea, and I will gladly see your ideas in this post.
Please do not forget the ✅' like '✅ button 🙏😊 & Share it with your friends; thanks, and Trade safe.

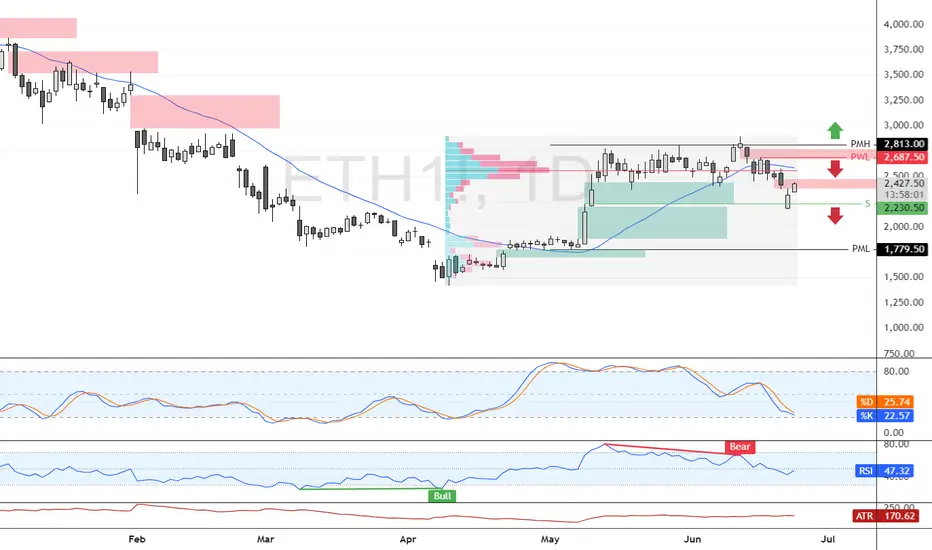
Bearish Wave Builds Below Key ETH Supply ZoneFenzoFx—Ethereum failed to break above $2,813.0 and is now trading around $2,430 after trimming nearly 5.0% of recent losses.
The $2,687.0 area, backed by the 50-period SMA, acts as a premium supply zone. A bearish wave could follow, targeting $1,779.0, supported by prior monthly lows and RSI divergence.
The bearish outlook is invalidated if ETH/USD closes above $2,813.0.
ETH - ORDER BOOK - BIG LEVELS Ethereum Order Book Analysis | Key ETH Levels Revealed (Real-Time Liquidity Zones)
In this video, we dive into the Ethereum (ETHUSD) order book to uncover major liquidity levels that could influence price action in the short and medium term. By analyzing real-time data, we identify where whales and institutions are placing large orders, which often act as strong support and resistance zones.
What You’ll Learn:
• How to spot large buy/sell walls on the ETH order book
• Why these levels matter for short-term traders
• Real-time reactions to major liquidity zones
• Potential long/short trade setups around key areas
This is essential viewing if you’re trading ETH intraday or swing, and want to anticipate where the next major move may come from.
⸻
Tools Used:
• ETHUSD price chart
• Real-time order book data
• Volume heatmaps
• Liquidity zone mapping
• Sentiment Tool
⸻
Stay ahead of the crowd by understanding how the market reacts to big players’ order placements. Don’t forget to leave a comment with your ETH target, and follow for more pro-level crypto analysis.
⸻
#Ethereum #ETHUSD #ETHAnalysis #CryptoTrading #OrderBook #ETHOrderFlow #LiquidityLevels #CryptoTA #PriceAction #WhaleWatching

Ethereum Rejected By Strong Resistance, A Bearish OutlookFenzoFx—Ethereum is consolidating around $2,525 after being rejected by the $2,813.0 resistance, a strong supply zone. Immediate support lies at $2,446.0. If ETH closes below this level, a move toward $2,080 is likely.
The bearish outlook is invalidated if ETH stabilizes above $2,813.0.

ETHUSDT.P H1 : Short-Term CorrectionBy analyzing the 1-hour timeframe, we can see that the price may drop from the 2780–2820 zone down to 2600

ETH Bullish Setup: Pullback to 200_SMA(D) May Launch Next Rally Ethereum ( BINANCE:ETHUSDT ) seems to have finally managed to break the Resistance lines and the 200_SMA(Daily) in the fifth attack . However, the number of Resistance lines inside the Heavy Resistance zone($2,929_$2,652) is high, and Ethereum will find it difficult to break through them.
In terms of Elliott Wave theory , it seems that Ethereum is completing microwave 4 , and we should wait for this wave to complete. Microwave 4 could act as a pullback to the resistance lines and 200_SMA(Daily) .
I expect Ethereum to start rising from the Support zone($2,745_$2,650) again and rise to at least the Potential Reversal Zone(PRZ) .
Note: If Ethereum touches $2,537 , we can expect further declines.
Please respect each other's ideas and express them politely if you agree or disagree.
Ethereum Analyze (ETHUSDT), 1-hour time frame.
Be sure to follow the updated ideas.
Do not forget to put a Stop loss for your positions (For every position you want to open).
Please follow your strategy and updates; this is just my Idea, and I will gladly see your ideas in this post.
Please do not forget the ✅' like '✅ button 🙏😊 & Share it with your friends; thanks, and Trade safe.

ETH New Update (4H)After being rejected from the higher levels and losing the trigger line, Ethereum now appears to have pulled back into the range zone and the trigger line.
It is expected that the price will be rejected once again from the red zone to the downside, and then turn bullish again from one of the two green zones and move upward.
This is our current outlook on Ethereum. The analysis will be updated accordingly.
Keep in mind that taking short positions in these zones is not low-risk either!
For risk management, please don't forget stop loss and capital management
Comment if you have any questions
Thank You

Ethereum's Downtrend Pauses—Reversal or Further Drop?FenzoFx—ETH/USD currently trades around $2,480, ranging between $2,336.0 support and $2,797.0 resistance. Given the recent break of structure, the bearish trend may resume, targeting $2,336 as the next liquidity trap.
This level may offer a discounted entry for long positions. Traders should watch for bullish signals like candlestick patterns and fair value gaps on lower timeframes (M5, M15) during the NY session.

Quasimodo Pattern + Validator Support = Bullish Signal for ETHToday I want to analyze Ethereum ( BINANCE:ETHUSDT ) for you, many tokens are on the Ethereum network , and the increase or decrease of Ethereum directly affects most tokens.
So please stay with me.
Ethereum is trading in a Heavy Resistance zone($2,929_$2,652) near the Resistance lines and 200_SMA(Daily) . It is worth noting that Ethereum is preparing itself for a third attack on 200_SMA(Daily).
In terms of Price Action Analysis , Ethereum could start to rise with the help of the Bullish Quasimodo Pattern and break out of 200_SMA(Daily) and Resistance lines .
In terms of Elliott Wave theory , Ethereum appears to have completed a main wave 4 near Important Support lines . The structure of the main wave 4 is a Double Three Correction(WXY) . By breaking the 200_SMA(Daily) and Resistance lines , we can confirm the end of the main wave 4 .
The ETHBTC ( BINANCE:ETHBTC ) chart conditions are bullish , so it seems like investing in Ethereum could be better than Bitcoin . At least if the market falls , Ethereum is likely to be less likely to suffer a decline .
Note : Over 150,000 Ethereum validators, representing approximately 15% of the network, signaled support for increasing the gas limit from 36 million to 60 million units. This proposed change aims to enhance network capacity, reduce transaction fees, and improve scalability. While this development could positively impact ETH's price by making the network more efficient, it's essential to monitor potential technical risks and ensure that decentralization is maintained.
Note: If Ethereum touches $2,547 , we can expect further declines.
Please respect each other's ideas and express them politely if you agree or disagree.
Ethereum Analyze (ETHUSDT), 1-hour time frame.
Be sure to follow the updated ideas.
Do not forget to put a Stop loss for your positions (For every position you want to open).
Please follow your strategy and updates; this is just my Idea, and I will gladly see your ideas in this post.
Please do not forget the ✅' like '✅ button 🙏😊 & Share it with your friends; thanks, and Trade safe.

ETH ANALYSIS (12H)This analysis is an update of the analysis you see in the "Related publications" section
Ethereum has finally reached the flip zone.
Pay close attention: Ethereum dominance is sitting on monthly support, which is a level with strong bounce potential.
We have two possible scenarios for Ethereum | either it breaks through the flip zone, or it makes a correction and turns bullish again from around the bottom.
⚠️ What’s clear is that shorting Ethereum is risky and doesn’t make sense!
For risk management, please don't forget stop loss and capital management
When we reach the first target, save some profit and then change the stop to entry
Comment if you have any questions
Thank You

Why Ethereum Could 10x in the Next Few Years🚀
1. Ethereum ETF Approval
ETFs are approved in the U.S. (similar to the Bitcoin ETFs in early 2024), institutional money will flood in.
Grayscale, BlackRock, and others have already filed.
Ethereum’s price jumped significantly after similar events in the past.
2. Deflationary Supply (Post-EIP-1559)
Since EIP-1559, ETH has been burned with every transaction.
Combined with Proof-of-Stake (The Merge), ETH is now net deflationary during periods of high network activity.
3. Layer 2 Ecosystem Is Exploding
Rollups (Arbitrum, Optimism, Base, zkSync) are scaling Ethereum.
These L2s settle on Ethereum L1, driving fees and activity.
Vitalik’s "rollup-centric roadmap" is playing out — this benefits ETH long-term.
4. Real Yield from Staking
Ethereum now offers a real, sustainable yield from staking (~3–5%).
Institutions love yield. ETH becomes more like a productive asset, not just a speculative token.
5. Ethereum as the Base Layer of Web3
DeFi, NFTs, gaming, DAOs — Ethereum is still the dominant smart contract platform.
The most secure, battle-tested, and widely adopted chain.
Developers and enterprises continue to build on Ethereum over competitors.
6. Macro Tailwinds
As the U.S. moves toward looser monetary policy, risk assets (including crypto) historically benefit.
Crypto adoption is growing globally — from Latin America to Asia — and Ethereum is often the entry point.

Ethereum Consolidates Near the 50-SMAFenzoFx—Ethereum remains in a bull market above the 50-period simple moving average, though momentum slowed after testing resistance at $1,857.0. At the time of writing, it trades around $1,812.0, consolidating near the 50-SMA.
As long as the price stays above $1,690, the outlook remains bullish. A close above $1,857.0 could push ETH/USD toward the next resistance at $1,957.0.
Bearish Scenario: A break below $1,690.0 would invalidate the bullish outlook and could trigger a drop toward $1,538.0.
***
>>> No Deposit Bonus
>>> %100 Deposit Bonus
>>> Forex Analysis Contest
All at FenzoFx Decentralized Forex Broker

Ethereum Trades Sideways: Bulls Need a PushFenzoFx—Ethereum is trading sideways but remains above the 50-period simple moving average, signaling a bullish market. ETH is currently priced around $1,785. A close above $1,835 could trigger a move toward the $1,950 resistance.
Bearish Scenario:
If Ethereum falls below $1,690, supported by the 50-period simple moving average (4-hour chart), it could decline toward the $1,565 support level.

"ETH Breakout Watch: Holding Support for a Push Toward $1900+"ETH 4H chart par price apne key support (purple box) ke upar consolidate kar raha hai. Jab tak yeh support hold karta hai, $1900 - $1920 ka target active rahega.
Agar support toot jata hai to next major demand zone 1660-1680 ke aas paas hai. Tab tak structure bullish hai.
Trading plan simple hai:
✅ Support hold = Buy dips for $1900+
❌ Support breakdown = Wait for lower entries.
Chart clear path dikhata hai, risk manage karte raho! 🚀

Ethereum is Overbought at $1,835FenzoFx—Ethereum remains bullish, trading near $1,800 after a momentum slowdown at this level. A long-wick bearish candle has formed on the 4-hour chart, though resistance here is limited. Overbought readings on the Stochastic and RSI 14 suggest short-term saturation.
ETH is holding above key support at $1,755. Caution is advised—buying into an overextended market isn't ideal. A pullback toward $1,755 or $1,690 may offer better entry points if bullish signals appear.
The trend stays intact above the 50-SMA, with potential to reach $1,950. However, a drop below $1,565 could shift the bias to bearish, eyeing $1,470 and $1,370 next.

Risky Scalp Short | $ETH @ CMP 1778 | 5x–7x LeverageHigh-risk scalp short on ETH based on intraday price action and overextension signs.
Trade Plan:
Entry 1: CMP ~1778
Entry 2: 1812
Leverage: 5x to 7x
SL: To be updated (Max 3% risk)
Quick scalp — watch closely for volatility & potential fakeouts.
⚠️ High-risk trade. Not financial advice. For educational purposes only. Use proper risk management.
