ETHUSDT Explanations what happend past couple weeksTechnical Analysis Summary
ETH /USDT
Today I will be explaining what has happened in the past couple of weeks simply buy using 2 tools (TRENDS,SUPPORT AND RESISTANSE LEVELS).
Green levels are levels of support
Red levels are levels of resistanse
yellow old trend (no longer active)
Green trends (active trends)
Most of my explanation can be found on the chart
If you need any aditional explanation or help don't hesitate to send me a message or comment
Trading Involves High Risk
Not Financial Advice
Exercise Proper Risk Management
Ethanalysis

ETH New ATH & Price Discovery!!Ethereum is continuing to run in beast mode almost making new ATH's everyday, we are still travelling up and respecting our ascending channel as we are once again pushing that 0 FIB or our ATH! We could be considered in price discovery mode right now but i think with some big momentum we could be blasting off to go on a huge run to the upside, facing currently no resistance levels once we break above our ATH! We have a bunch of very solid support levels underneath us with the bottom of the ascending channel aswell as uptrend support inside the ascending channel we got the R1 Level which is now support and then aswell as the midline coming from the bollinger bands, if we do see a couple down days i really don't expect us to go very far. Now something else very interesting with the bollinger bands is our price action is currently sitting directly ontop of the top band, and now we haven't seen an explosive climb up this band yet in this ascending channel we could be looking at a mega one coming up soon, our daily close is looking like we will close directly ontop of this band which is always a very very good sign and could send us flying to the upside, plus pair that with our current situation of being in price discovery mode and having little to no resistance above us.. seems like a recipe for a massive run up coming soon! Now the MACD is starting to look good, we have been seeing lots of tight movement from the MA's with a flat histogram but we could be getting ready for another bullish MACD cycle, we are yet to create a bearish cross and if you actually look at the histogram starting from the verticle line i drew we are seeing something very positive, a daily increase in our green bars, this is a very good sign and could be signalling the start of another bullish cycle on the MACD, we gotta see this continue though day after day increasing green bars showing a rise in bullish momentum, we can't see a flat histogram or a decreasing one, this would likely result in a bearish cross putting downside pressure on ETH. Now the MA's are starting to show some positive signs, the blue MA is ticking slightly to the upside which is what we wanna see, we gotta see that separation in the MA's lessening the chance of a near term bear cross and allowing for a little downside without triggering a bear cross! Overall no matter what we do in the coming days i am extremely bullish on ETH and altcoins going through this month, also should point out BTC dominance is currently slightly rising putting some pressure on the altcoins but once we see a rejection or a bit of a drop i think the altmarket is going to start exploding with many coins likely too create new ATH's! Not financial advice just my opinion!

ETH LONG!!Based on my TA, ethereum is currently forming its 3rd motive wave.
I’m going long.
SL: $3747
TP1: $4945
TP2:$5484
TP3: $7385

Ethereum going to breakout!!?Ethereum has been performing so well against bitcoin with us having a huge climb to the upside and we are currently at the apex point of this bullish triangle and we are looking for a breakout! Likely to the upside i personally think, following a breakout upwards i think we could definitely see a rejection off of the next resistance level and then there is some possible sideways movement that will follow, i think that there is a good chance after the rejection we will be coming back down to test the resistance we are currently at as shown by my path, and keep in mind that is a rough path and we could see a longer period of sideways movement. We are also looking at regaining the last pivot point which is shown to the left slightly above our current resistance which would be huge, and then the R1 resistance level and that is part of why i think we will most likely see a rejection once we reach that point. Also should point out that ethereum created a new ATH today on its USD pair and that definitely brings lots of bullish momentum to the table and puts us into price discovery mode which is mega bullish! Another scenario that i should point out is if by chance we see a breakout to the downside we have very solid support coming from the 0.2 FIB where a fakeout scenario could come into play, many traders will think heavier downside is coming if we breakout of this triangle bearish but we will almost certainly bounce off the 0.2 FIB before then taking on the same sort of path just on a longer timeframe, as shown by the yellow path. Now the MACD is looking good we have good spacing inbetween the MA's which is key and lessens the chance of a near term bear cross but the main thing is that id say we still have some momentum to get a nice break to the upside here and once we see that R1 rejection that will likely be the point of a bearish cross but will allow our MACD to reset and cool down a bit before taking off again! Not financial advice just my opinion!

ETHUSD - Ethereum is going down!My TA on 1D shows that:
1. Price came out from the ascending wedge at its peak.
2. Vertical volume decreased while price went up.
3. RSI shows divergence against price.
4. MACD confirms RSI's divergence.
5. Based on horizontal volumes liquidity for MM is concentrated on given level on the chart.
Correction for the last impulse is logical. Correction can fly down Fib starting from 38.2% to 50% and 61.8%. That would be your TP.
It is common for ETH to lag behind BTC, but in the end it follows BTC's trend. There is more fundamental analysis on Bitcoin in my article linked below.

ETH/USDTB 4HOUR UPDATEWelcome to this quick ETH/USDT analysis.
I have tried my best to bring the best possible outcome in this chart.
ETH/USDT analysis is head and shoulder and after Trend and break and inverse head and shoulder 100MA bounce and bullish signal and 100MA break after ETH/USDT is bearish
Sorry for my English it is not my native languages.
Do hit the like button if you like it and share your charts in the comments section.
THANK YOU...

Ethereum Set To Outperform BTC!!Checking out Ethereum vs Bitcoin on the daily timeframe we see a confirmed Bullish Divergence! This pattern signals a reversal coming ETH, we have been in a clear short term downtrend from the highs in the beginning of september and we are finally set to explode against BTC, pair this with Bitcoin dominance starting to slide we could be looking at a mega run for the altcoins! We are currently holding the 0.3 FIB level and we do have support from the bollinger bands midline right below the 0.3 FIB. Something else to take note of is we are pretty close to that top bollinger band and i think if we see a grab onto here we could be sent flying to upside taking out key resistance on the way! Any way you want to look at this bullish divergence it is very very clear, we have been seeing multiple lower highs on price action shown by the green trendlines, we have them from the beginning of september all the way until now! Now that we just got confirmation from the stoch RSI we are set for a massive breakout to the upside in a matter of time, The way you can find divergences is simply by seeing lower highs on price action or higher highs or higher lows or lower lows and then seeing the opposite on an oscillator, i personally like using the stoch RSI. Basically if you see a uptrend line on price action and a downtrend line on the oscillator or vise versa, but keep in mind there are different meanings for each divergence so that is up to you to find out which one you are seeing! Taking a look at the MACD we are seeing on the histogram yet another increase for our daily bar which is a good sign and shows growing bullish momentum, we want to see this continue for that reason, if we do see a decline a bearish cross looms but always remember there is a chance it is a fakeout and we could see a rebound with another bull cycle on the MACD, Notice the MA's we are seeing good separation with the blue continuing to push upwards and moving further away from the orange MA, we also want to see this continue to play out because it lessens the chance of a near term bearish cross and it also shows an increase with the bull momentum! We have many targets we could talk about but the main one for me that i will talk about in a later TA when we actually see a breakout is the highs we saw at the beginning of september, this reversal along with the grabbing of the top bollinger band could most definitely send us up that far but that will be for a later TA as we still have a ways to go! But things are starting to look very very good for ETH and the altcoins and i woulnd't be surprised if we saw a mega altseason coming up in the near future! Not financial advice just my opinion!

ETHLooks good here guys, next up is $4800. Check my account page I been using the same chart since Aug now , maybe even earlier.

MKROrange line is weekly ETH chart. I think MKR is ready to play catch up real quick.. We bought spot.

Ethereum Climbing Back Up!!Since we were trading withing the bullish triangle a little while ago i talked about some very nice looking upside on the horizon and we have seen just that with a strong breakout and a steady climb back to the upside! PS. This drawing was not the Bullish triangle i am referring too i erased it to clean up the chart a bit, we have taken out the 0.2 FIB level and we have had multiple retests with us being successful everytime, another key level we have successfully regained is the 3667$ and again we have had multiple retests succeeding. The next big test we are facing is the 4k level or aprx 3990-4000K level we have had one touch so far and we're rejected but we are still looking strong and seem to be taking a little cooldown resting on our current support level until we make our next move upwards! We also have uptrend support coming from around 2800$ and we have respected it all the way up till now, i see us holding onto this level following it upwards and ultimately i am looking for a reentry of our ascending channel shown above and then eventually the 0 FIB of course coming from our ATH! Looking at our Bollinger bands we seem to be inna very nice spot with price action well above the midline and not far away from that top band, i think we could be in for a rollercoaster ride up the top BB since we have not seen one in quite some time and we keep on wicking too the very top, likely just a matter of time before we have a nice upside day then eventually grabbing onto that top band taking it for a ride likely up towards that 0 FIB level, if the momentum is there i don't see us having too many problems shredding through this level and creating a new ATH and aswell entering price discovery mode! Looking at the Reversal Momentum Indicator we are in a slight downside right now but we see the orange curling heavy to the upside and coming towards the blue, we don't want too see a bearish reversal with the blue going under the orange but we could definitely see a little fakeout where we get a nice bounce off of the orange to continue this upside climb! Checking out the ADX we are looking good and seem to have found some footing a decent bit below our previous high, we are starting to turn to the upside with the direction looking to start an overall reversal after having some significant downside. A must watch for Ethereum is price action grabbing onto that top bollinger band, the RMI getting a bounce and keeping the blue ontop, and aswell the RSI which isn't currently on the chart, we need to stay above the midline to continue the uptrend, we are significantly above the midline currently near the top of the zone so thats why i decided to leave it out of this TA but always keep an eye on that! Not financial advice just my opinion!

ETH has formed a wedge pattern!ETHUSDT seems to have a correction soon. It has creat a wedge pattern and the price could act similar to the chart and have a correction.
It also is on the support now, its better to see the reaction of the market. you can wait for confirmation.
Agree or disagree? comment below
Goodluck

ETH USDTETH currently having a potential cup and handle on the weekly chart with resistance around 4013. So, if ETH could break 4013 and became a strong support on that area, the next target will be around 6000-6300 based on the cup and handle target and fibbonaci 1.618.

ETH/USDT - Potential 44% setupHello Traders!
At the moment, ETH looks weaker than the index (Bitcoin), lagging behind on the growth and correcting stronger on the decline of the index.
The market is in a classic situation: participants are in no hurry to open positions in altcoins, waiting for Bitcoin to continue growth.
As soon as the index gets a significant correction, the liquidity will start to flow into other instruments. In that case, we will see a correction in ETH.
Of course, we can miss one wave of growth waiting for a correction, but entering from the current levels will not give comfortable points of entry.
Consequently, it's better to wait and look for purchases on correction of the instrument.
You can make an entry in buying in the range of $2950 - $3110.
It would be better to place the stop loss under the level of $2625
Buying targets: Price levels of $3970 and $4372
Good luck and watch out for the market
P.S. This is an educational analysis that shall not be considered financial advice

Ethereum Big Upside On The Horizon!!Ethereum recently had a very strong breakout of this pennant and has been pushing the 0.2 FIB for the last 4 days, we want to continue to see momentum pushing upwards and ultimately a daily close above the 0.2 FIB at some point soon, none the less we are looking very good and very bullish! A daily close up and above the 0.2 FIB opens the door back up for us to regain the ascending channel which we fell out of somewhat recently and also as i said opens the door for big upside! Taking a look at the Wavetrend we are just starting to pass the midline and still have quite a bit of room to keep pushing up, and we are showing no signs of stopping, we see the red crosses are below our wave pushing us upwards with bullish momentum and we want to keep seeing our wave push vertically, lessening the chance of us having a bearish crossover and ultimately ending our current bullish wave. Now lets take a look at our squeeze momentum indicator, just today we have crossed over the midpoint and putting out our first green bar in quite some time and after a long drawn out bearish period! Things are really starting to look good, noticing the black crosses which indicate a current squeeze we haven't seen any grey crosses in awhile showing a squeeze release, all this momentum building up could be absolutely huge for Ethereum, once we see those grey crosses and more green bars we likely will be on the verge of a huge run upwards, just like what we saw nearing the end of July, we had a decent red period squeeze and shortly after we turned bullish we got that squeeze release which sent us flying as you can see in the ascending channel. (Remember, keep an eye out for those grey crosses) Now lets look at the ADX or the average directional index, we have been seeing a bigger downslope in the ADX but i have some positive news, it looks like we are catching some longterm support here and we are seeing the ADX starting to curl upwards which is a very great sign! If we can get a bounce off here we could be looking at the next upside "wave" for Ethereum, all things are pointing to this happening, and keep in mind this indicator is very smooth and we don't see any jagged movement or sharp turns up or down, its a gradual move and we could be seeing the beginning of that big move! Not financial advice just my opinion!!

Ethereum Looking very Bullish!!A little bit ago i posted a TA on ETHBTC and we were trading inside of this descending wedge which is a very bullish pattern and i talked about seeing an upcoming breakout and that is exactly what happened! We are starting to gain some nice momentum coming out of this falling wedge and we are coming up on some very important daily closes for ETH against BTC! We are getting a little stuck right underneath this resistance line at aprx 0.0714 and the reversal pivot point just above there, if we can successfully see a strong push above both of these levels at some point soon we can expect Ethereum and altcoins to really start to move, a close above the pivot point in the coming days is key for us, we will likely see a reversal back into an uptrend coming out of our current short term downtrend. Looking at the bollinger bands we have regained a crucial level and that is the midline on the bands, we definitely want to stay above here and keep this level as support and this opens up the window for us to keep moving strongly upwards and eventually getting to that top band, whenever we see price action up and around the top band there is a high chance we grab onto it and go for a big move to the upside, but that'll be for a future TA as we got some work to do before we see that happen. Now checking out the RSI, we have slightly broken up and above the midline after remaining below in a confirmed short term downtrend for a week or two, we want to make sure to hold this level and even see a retest and be successful before really jumping the gun, but personally i think we are going to see at some point soon some big rallies in the overall crypto market, i believe its just a matter of time everything all around is looking pretty great and if you havent already i highly suggest checking out my recent BTC.d divergence TA's! There is something huge coming! Not financial advice just my opinion!

ethZooming out a bit on ETH I maintain my W5 count which has ETH finishing W2 and now in the larger W3 heading towards $5k with the LTF 5 up currently in W1 and a retest to $3200 to confirm the break out as support

Ethereum ready to take off!!?Looking at Ethereum vs Bitcoin we see a clear descending wedge which is very bullish in itself and as you can see to the left of our current wedge we had another descending wedge which blasted us upwards once we brokeout. Think we are looking very good overall and wouldn't put it past ETH to pull this off again! We have a very heavy support area below us shown by the rectangle, we have the pivot point which acts as support and then aswell as the bottom of the wedge which is also support, on the other hand though we do have a fair amount of resistance above us, the top of the wedge, the 0.2 FIB level, resistance at 0.0741 sats and then the R1 resistance. the beauty of this and the positive is the fact that we have had quite the correction and cooldown across the whole market and plus once we do start to see bullish momentum it is going to be explosive, plus don't forget the very bullish pattern we are currently in, once we start to take off i would say we can most likely easily blast through most of these levels because they are so close, and i would expect us to reach the R1 level before we start to see some pushback from the bears, even at that point though i think we could shred right through there after a couple attempts at the level. Looking at the MACD we are seeing a steady decline in the red bearish bars day after day and thats exactly what we want, bearish momentum draining out and giving the bulls that chance to really takeover. On the MA's we are seeing them getting pretty close together which is a good sign, meaning we are getting closer to a bullish cross, however there could still be a couple or few more days of decline due to the fact that the blue MA is slightly turning to the downside. The Wavetrend overall looks great, we are nearing the bottom zone which is the buy zone and we are seeing what looks like a sort of bottom out from this downtrend wave, like i said with the MACD we could still see a bit of a decline on the wavetrend but i really doubt we go much further, we want to keep an eye on those red crosses and as you can see we are pretty close to getting them underneath our wave to start giving us that push back up! Not financial advice just my opinion!

ETHJust a friendly reminder that ETH is going to $8k soon guys. Big Mike loves you all even stupid bears. ;)

eth/usdt 1hour quick updateeth/usdt long :- cmp
target:-10% to 15%
stoploss:-2910$
Remember: This is not a piece of financial advice. All investment made by me is under my own risk and I am held responsible for my own profit and losses. So, do your own research before investing in this trade.
happy trading...
thank you...

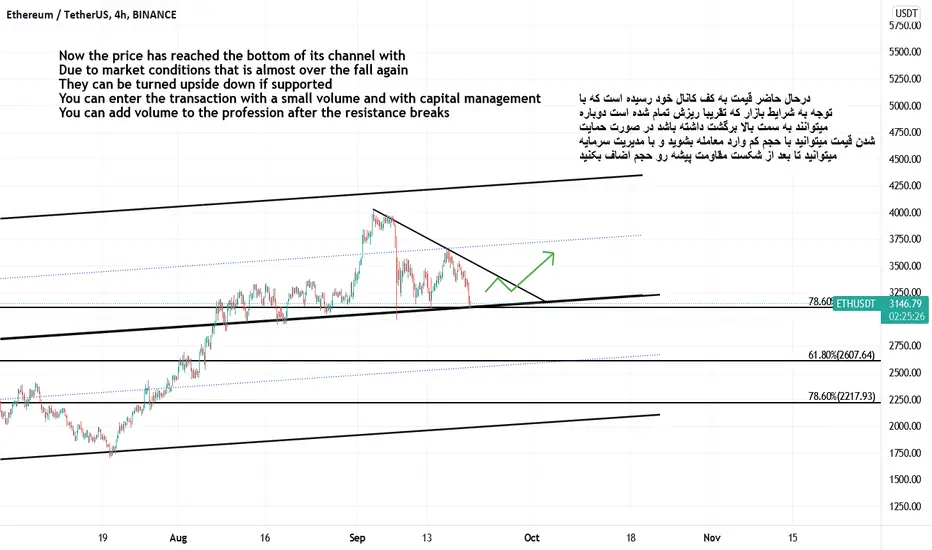
Ethereum/UsdtBINANCE:ETHUSDT
Now the price has reached the bottom of its channel with
Due to market conditions that is almost over the fall again
They can be turned upside down if supported
You can enter the transaction with a small volume and with capital management
You can add volume to the profession after the resistance breaks
Ethereum New ATH!??Ethereum has been holding up very well during this pullback with us still able to hang onto some key levels, including this ascending channel, we are currently sitting on the bottom of the channel holding on strong and i think the market is starting to rebound, if you take a look at my last TA talking about the BTC hidden bullish divergence the same thing actually applies to Ethereum currently, ill let yall check that out for yourselves, refer back to my BTC TA and throw on the Stoch RSI on Ethereum and see if you can find it. Other than the divergence the market i think is ready for another leg up since we just saw a significant healthy pullback. Some key levels we are looking at here are the 0.2 FIB which we need to break soon, the R1 resistance slightly above the 0.2 FIB and the midline coming from the bollinger bands which is currently acting as resistance, if we can get above atleast the 0.2 and the BB midline we are going to be looking super bullish and the good thing is they aren't far away at all so our indicators like the MACD and RSI will barely be affected by a move like this. On the RSI we slightly took a dip below the midline but barely really an we are now seeing some upwards direction here with us just right underneath this midline, i think we aren't going to have any problems getting above here with ease and we can continue our confirmed uptrend! Also gotta keep an eye on ETH's Domiance in the market, we have had significant upside in the dominance and that definitely correlates with the big upswings in price action, we are likely going to see another big pump in price action and dominance level we are seeing respect on this uptrend support line and i think even if we fall a little bit more we are likely going to get a nice bounce which afterwards i would expect us to have a solid move to the upside! And remember ETH's dominance is a big deal with the Altcoins the higher ETHs dominance goes the more altcoins will follow ethereum rather than BTC! Not financial advice just my opinion!

ETH Dominance Pushing 20%Ethereums dominance is looking fantastic pushing upto the 20% level! igniting alt season as BTC dominance continues to fall! The MACD looks very good we are seeing a healthy green bar for our first on of this cycle after very recently getting that bullish cross! We are already seeing some good separation in the MA's and we will need to continue to see this if we want to have a big run up, lessening the chance of a near sighted bear cross. Now checking out the bollinger bands as you guys know i always talk about grabbing onto that top band, if we continue our push up there is a very good chance we will see this play out in the coming days, this will likely shoot up the dominance level to 20.74 aprx which is our recent high from back in early May. We are seeing good momentum coming from the wavetrend, we are almost pushing out of the bottom zone as we approach the midline soon, i personally think we have tons of room to run up here and it doesn't seem like anything is in our way! Not financial advice just my opinion!

ETHBTC Explosive Breakout!ALTseason could be upon us, ethereum just had a beautiful breakout against BTC out of this descending wedge! We are currently facing some resistance at the 0.2 FIB but we did have a nice wick pretty well above here! We notice on the MACD we are in and out of a bullish cross and we gotta look for separation in the MA's once the bull cross happens, we need to see that momentum pick up, also the histogram looks great we are coming to an end with the red cycle and we are very close to breaking into that bullish territory, we want to see increasing green bars each day! Now checking out the bollinger bands, we are looking very good our current candle has touched the top band which is always very bullish and if we see this continue im sure we are going to melt up pretty hard, we do have some light resistance halfway through the 0.2 FIB and im sure if we take a ride up the bollinger bands it'll take us right there! Not financial advice just my opinion! ps. very important that we get a daily close above the 0.2 FIB, then we will be looking mega bullish!
