#Ethereum - thoughts out loud #2 Good afternoon, dear colleagues!
I am glad to welcome everyone and wish you to get acquainted with my vision of the current situation on this instrument.
The situation is similar to the stage of accumulation (local) asset that began on 09.11.2022, where we are in the final phase before entering the trend movement (bullish). But I have some doubts, because the formation that we observe is obvious, most market participants may prefer long positions because it is "accumulation from here to the moon". Therefore, there may be several scenarios for the continuation of the movement:
1) We confidently break through the level of 1441 and rapidly move up until we run out of fuel (before that, we remove the stop loss by a rapid downward movement of 1211-1311).
2) "False accumulation" and the return of the price to the trading range after which we will see the depreciation of the instrument from the range of 1441 - 1551 to 999 - 888.
That is, professional market operators give the opportunity to realize the potential of the movement and expect how the crowd will pick up their idea and vision of the market. After all, we all understand that the market is created to 80% of participants lose money, but now not about that, let's return to the analysis. It is today that a number of important economic indicators are released and the volatility is expected to increase and why not implement our plans using the news background, the prospect is excellent and the scheme is worked out.
Dear colleagues, I sincerely thank you all for your attention and wish success to everyone!
And remember one thing:
"sometimes you win/sometimes you learn"
Ethanalysis

ETH/USD 1DAY UPDATE BY CRYPTO SANDERS !!Hello, welcome to this ETHEREUM /USDT update by CRYPTO SANDERS.
CHART ANALYSIS:- Ethereum (ETH) also posted gains at the start of the week, as it surpassed the $1,800 mark in today's session.
ETH/USD reached a high of 1,834.94 on Monday, after falling down to 1,787.54 in less than 24 hours.
This is the second day that ETH has gained, and it comes after a recent eight-day losing streak.
This resulted in Ethereum falling to its weakest point since March, however, it now appears that momentum has now shifted.
Price strength has also increased on Ethereum, climbing above a key point of resistance at the 44.00 level.
The index is now tracking the 45.85 mark with the next range at the 50.00 level.
I have tried to bring the best possible outcome to this chart.
Hit the like button if you like it and share your charts in the comments section.
Thank you

ETH/USDT 1DAY UPDATE BY CRYPTO SANDERS !!Hello, welcome to this ETHEREUM /USDT update by CRYPTO SANDERS.
CHART ANALYSIS:-Ethereum Analyzing the daily chart, the price previously formed a higher pattern before experiencing a significant decline. The 50-day moving average at $1.8K acted as a support level, casting a significant shadow on the daily charts and substantial volatility on the lower time frames.
Currently, ETH is confined within a narrow dynamic range between the 50-day EMA, which is currently at $1931, and the key resistance area at $2K.
If the price manages to overcome the $2K resistance and surpass its previous high at $2.1K, it could potentially trigger an extended rally. Conversely, if there is a break below the 50-day EMA, the 100-day moving average at $1.7K will become a primary support level.
Hit the like button if you like it and share your charts in the comments section.
Thank you

ETH/USD 1DAY UPDATE BY CRYPTO SANDERS !!Hello, welcome to this ETHEREUM /USD update by CRYPTO SANDERS.
CHART ANALYSIS:-Ethereum (ETH) also made a comeback on Hump Day as the bulls started re-entering the market.
ETH/USD reached a peak of 1,879.76 on Wednesday, having dropped below nearly 1,800 the day before.
This move allowed Ethereum bulls to briefly propel the price above the 1,875 ceiling before retreating as the session matured.
Earlier gains were pared down as price strength was unable to overcome a key point of resistance at 48.00, with the index now tracking at 46.99.
Despite this, there is still some optimism that Ethereum could move above 2000 later today,
ETH is trading at 1,900.
Hit the like button if you like it and share your charts in the comments section.
Thank you

ETH/USD 1DAY UPDATE BY CRYPTO SANDERS !!Hello, welcome to this ETHEREUM /USD update by CRYPTO SANDERS.
CHART ANALYSIS:-Ethereum (ETH) After hitting a high of 1,851.19 to start the week, ETH/USD fell to a low of 1,809.19 at the start of the day. Yesterday's decline saw the world's second-largest cryptocurrency down from its long-term price bottom at 1,830.
ETH has rebounded from this floor, as the sentiment remained relatively stable despite the earlier decline.
This happened despite the RSI trading under its own support point at 45.00 with a current reading of 44.30.
More moves could follow after the Fed's decision, with a possible move above 1,900 still on the cards.
Hit the like button if you like it and share your charts in the comments section.
Thank you

ETH is preparing for a BIG BOUNCE!!!Technical Analysis:
- In weekly, ETH is doing wave ((1)) in black
- In short term, ETH is doing wave 2 in red
- H1 right side is turning down
- H4 right side is up
Technical Information:
- If you're a Swing Trader, you can buy wave 2 in red around 1,670
- If you're a Position Trader, you must wait for wave ((2)) in black around 2,000

ETH/USD 1DAY UPDATE BY CRYPTO SANDERS !!Hello, welcome to this ETHEREUM /USD update by CRYPTO SANDERS.
CHART ANALYSIS:-Ethereum (ETH) was also in the red, as prices plunged for a second consecutive session.
ETH/USD dropped to a bottom at 1,829.41 earlier in the day, less than 24 hours after trading at a peak of 1,938.42.
Similar to BTC, today’s slippage sent ethereum below its own point of support at the 1,830 level.
ETH has since rebounded from this floor, as bulls opted to buy the dip, rather than continuing to flee positions.
This was helped by the fact that the RSI here also collided with a support zone at 45.00, and it continues to track beyond this point.
Bulls will likely be targeting re-entry above 1,900 in the upcoming days.
Hit the like button if you like it and share your charts in the comments section.
Thank you

BTC/USDT 3DAY UPDATE BY CRYPTO SANDERS !!Hello, welcome to this ETHEREUM /USD update by CRYPTO SANDERS.
CHART ANALYSIS:-Ethereum (ETH) Ethereum is determined to not give up and has found good support at 1,800. Despite this show of force from buyers, ETH still lost 1.8% of its valuation this past week.
The current target and key resistance are at 2,000, which is a psychological level where the price was rejected in the past. Therefore, if buyers are successful in pushing this cryptocurrency higher, then they will likely face stiff resistance at that level
Looking ahead, Ethereum has managed to maintain its uptrend by making a higher high and a higher low. Market participants should only get concerned if the key support at 1,800 is lost. Unless that happens, ETH has a good chance to test the key resistance at 2,000.
Hit the like button if you like it and share your charts in the comments section.
Thank you

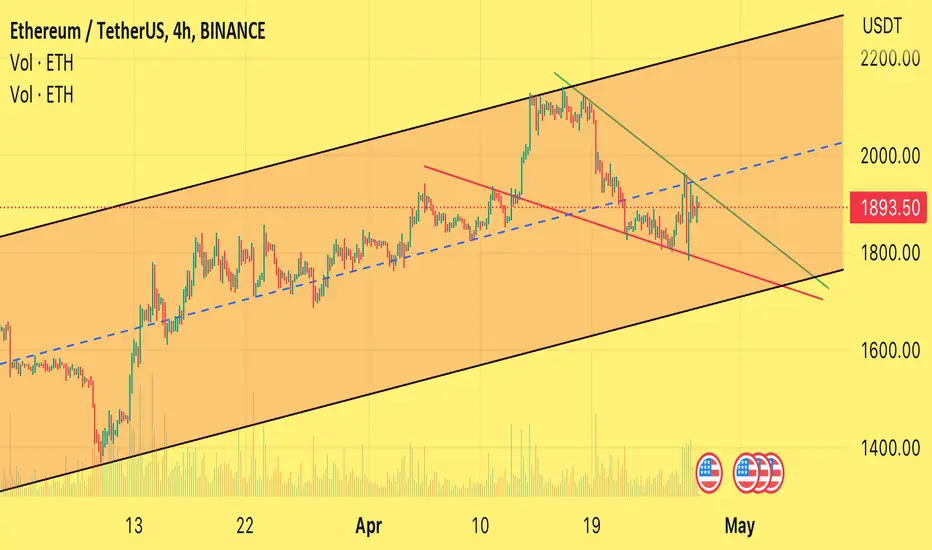
Eth falling wedge and ascending channel Eth is consolidating in ascending channel and falling wedge. It will stay in this range for some days. Btc will pump more than Eth these days. It’s not ETH time.
ETH/USD 1DAY UPDATE BY CRYPTO SANDERS !!Hello, welcome to this ETHEREUM /USD update by CRYPTO SANDERS.
CHART ANALYSIS:-Ethereum (ETH) was in the green as prices snapped a three-day losing streak.
After a low of 1,805.32 on Tuesday, ETH/USD rose to a peak of 1,919.72 at the start of the day.
As a result of this move, Ethereum has reached a five-day high, with the price now hovering around the 1,915 resistance.
The last time ETH bulls broke this ceiling was on April 13, and on this occasion, the price soared to an 11-month high above 2,100.
For something similar to happen in this round, the RSI would need to clear a barrier at the 53.00 level.
At the time of writing, the index is tracking at 51.64.
Hit the like button if you like it and share your charts in the comments section.
Thank you

ETH/USD 1DAY UPDATE BY CRYPTO SANDERS !!Hello, welcome to this ETHEREUM /USD update by CRYPTO SANDERS.
CHART ANALYSIS:-Ethereum (ETH) also started the week in the red, with prices hovering close to a key point of support.
Following a high of 1,888.19 on Sunday, ETH/USD slipped to an intraday low of 1,831.16 earlier in today’s session.
As a result of this move, ethereum fell close to its long-term price floor at 1,830, however, bulls have so far rejected a breakout.
One of the reasons that a break has yet to occur seems to be due to the RSI, which continues to trend above support at 44.00
Price strength is now tracking at 45.58, with a ceiling at 52.00 a potential target for bulls hopeful of recapturing the 1,900 mark.
Hit the like button if you like it and share your charts in the comments section.
Thank you

ETH/USD 1DAY UPDATE BY CRYPTO SANDERS !!Hello, welcome to this ETHEREUM /USD update by CRYPTO SANDERS.
CHART ANALYSIS:-Ethereum (ETH) continued to trend lower on Saturday, as the world’s second-largest cryptocurrency dropped below 1,900.
Following a high of 1,926.30 on Friday, ETH/USD fell to an intraday low at 1,827.79 earlier in the day.
As a result of this move, ethereum started the weekend by declining to its weakest level since April 9.
Today’s price slippage also resulted in ETH briefly breaking out of an interim support point at 1,830.
Bulls swiftly reentered the market seemingly buying the dip, and this has resulted in ethereum now trading at 1,848.66.
Although there is likely to be further declines in the coming days, once this current red wave passes, there may be a significant reversal.
Hit the like button if you like it and share your charts in the comments section.
Thank you

ETH/USD 1DAY UPDATE BY CRYPTO SANDERS !!Hello, welcome to this ETHEREUM /USD update by CRYPTO SANDERS.
CHART ANALYSIS:-Ethereum (ETH) also edged lower, with price nearing a breakout below the 1,900 mark.
Two days after hitting a peak at 2,105, ETH/USD dropped to a low of 1,904.42 earlier in today’s session.
This decline has resulted in the world’s second-largest cryptocurrency now trading at its lowest level in eight days.
Overall, ethereum is trading nearly 10% lower than at the same time last week, when it rose above 2,000 for the first time since last May.
The RSI has also significantly dropped, with the index breaking out of a floor at the 53.00 level, and it is now at a reading of 49.46.
Should momentum continue to fall, bears will likely be targeting a point of support at 44.50.
I have tried to bring the best possible outcome to this chart.
Hit the like button if you like it and share your charts in the comments section.
Thank you

ETH/USD 1DAY UPDATE BY CRYPTO SANDERS !!Hello, welcome to this ETHEREUM /USD update by CRYPTO SANDERS.
CHART ANALYSIS:-Ethereum (ETH) slipped to a one-week low in today’s session, as traders attempted to find a point of support.
Following a high of 2,005.44 on Wednesday, ETH/USD dropped to a bottom at 1,928.58 earlier in the day.
As a result of this drop, ethereum fell to its weakest point since April 13, a day which saw ETH hover marginally above 1,900.
At the time of writing, ETH has rebounded, which appears to be due to its RSI bouncing from a floor at 52.00.
Ethereum is currently trading at 1,945.58, with the index at the 54.54 level, below an upcoming ceiling of 58.00.
If bulls were to take price strength to, or above, 58.00, there is a good chance that ETH will be back over the 2,000 level.
I have tried to bring the best possible outcome to this chart.
Hit the like button if you like it and share your charts in the comments section.
Thank you

Eth buying setup its might be a risky one i am not that much shore the price will come to our entry point but i am worried due Eth upgrade. the investors are getting there EThs it might create some fear in those investors heart when the see Eth price down by 3 percent so may be in FOMO they start selling and we may see a massive dump and we will hit our stop loss. that's why stop loss should be used at such kind of trades

ETH/USD 1DAY UPDATE BY CRYPTO SANDERS !!Hello, welcome to this ETHEREUM /USD update by CRYPTO SANDERS.
CHART ANALYSIS:-Ethereum (ETH) continued to climb higher as the price climbed above 2100 following its recent Shepela update.
After a low of 1,987.05 on Thursday, ETH/USD rose to a high of 2,126.32 in today's session.
As a result of today's increase in price, the world's second-largest cryptocurrency has reached its highest level since last May.
The latest rally came when the bulls broke the key resistance level of 2,030, with the RSI crossing its own hurdle at the 72.00 mark.
Like BTC, ETH's RSI is also overbought, with the index reading 75.29 at the time of writing.
A higher range at 80.00 now awaits the current uptrend in the market.
I have tried to bring the best possible outcome to this chart.
Hit the like button if you like it and share your charts in the comments section.
Thank you

ETH/USD 1DAY UPDATE BY CRYPTO SANDERS !!Hello, welcome to this ETHEREUM /USD update by CRYPTO SANDERS.
CHART ANALYSIS:-Ethereum Buoyed by the Shanghai update, Ethereum outperformed BTC in today's session, gaining nearly 7% in the process.
ETH traded at 1,882.37 in today's session, up from a peak of 2,007.05 a day earlier.
As a result of today's increase in value, the world's second-largest cryptocurrency reached its highest level since last August.
The 75.00 resistance level appears to be the next hurdle for the bulls, and should the momentum continue in the uptrend, ETH could move above 2100 this week.
I have tried to bring the best possible outcome to this chart.
Hit the like button if you like it and share your charts in the comments section.
Thank you

ETH/USD 1DAY UPDATE BY CRYPTO SANDERS !!Hello, welcome to this ETHEREUM /USD update by CRYPTO SANDERS.
CHART ANALYSIS:-Ethereum fell below the 1900 level during today's session, losing almost 3% in the process.
After hitting a high of $1923.81 on Tuesday, ETH/USD fell to a low of $1860.04 earlier in the day.
Today's move came as ETH declined below the key 1915 resistance level, with the 1830 bottom a potential target for sellers.
I have tried to bring the best possible outcome to this chart.
Hit the like button if you like it and share your charts in the comments section.
Thank you

ETH/USD 1DAY UPDATE BY CRYPTO SANDERS !!Hello, welcome to this ETHEREUM /USD update by CRYPTO SANDERS.
CHART ANALYSIS:-Ethereum (ETH) was also lower today, as prices slipped from an eight-month high the day prior.
Following a high of $1,924.47 on Wednesday, ETH/USD dropped to an intraday low of $1,859.00 earlier in the day.
As a result of this decline, ethereum has fallen from its strongest point since Aug. 17, when the price peaked at $1,957.
today’s drop resulted from the RSI hovering below a recent support point of 61.00.
Overall, it appears that earlier bulls have moved to take profits, ahead of the upcoming uncertainty in the market.
At the time of writing, ethereum is trading at $1,871.63.
I have tried to bring the best possible outcome to this chart.
Hit the like button if you like it and share your charts in the comments section.
Thank you

ETH/USD 1DAY UPDATE BY CRYPTO SANDERS !!Hello, welcome to this ETHEREUM /USD update by CRYPTO SANDERS.
CHART ANALYSIS:-Ethereum (ETH) was also in the green, with prices climbing to a fresh eight-month high.
ETH/USD moved to a high of $1,921.27 earlier in the day, which comes a day after trading at a low of $1,855.37.
As a result of this rally, ethereum went back to its strongest point since August 17, when the price hit a peak of $1,957.
This latest surge has pushed price strength to a current reading of 65.87, which is marginally below a ceiling of 66.00.
Due to this, some earlier bulls have moved to take profits, which has led to ETH falling from the day’s high.
At the time of writing, ethereum is trading at $1,915.88.
I have tried to bring the best possible outcome to this chart.
Hit the like button if you like it and share your charts in the comments section.
Thank you

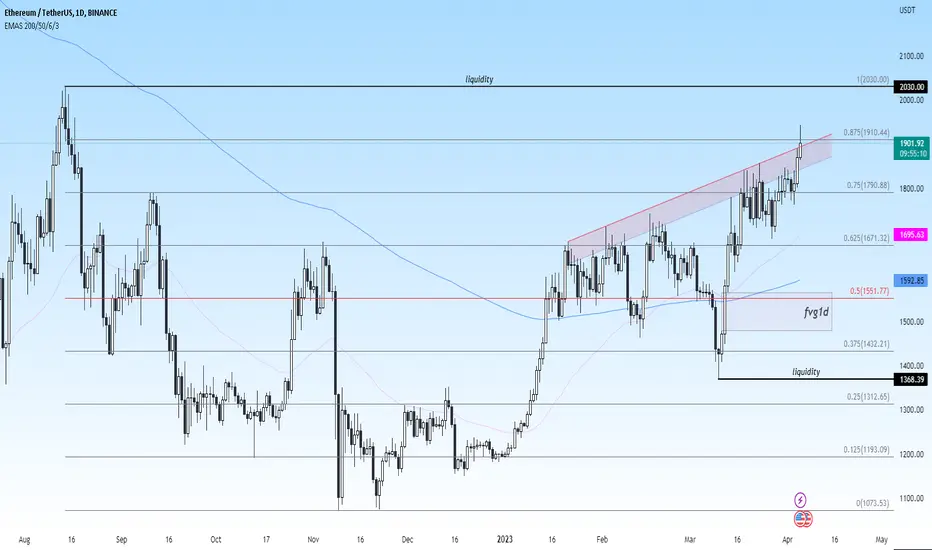
#ETH HTF update... #ETH HTF update...
#Ethereum is strong AF, while the #Shapella (shanghai) update is coming up on April 12th...
Lets watch if $ETH will claim 0.875 fib today with the daily candle...
ETH/USD 1DAY UPDATE BY CRYPTO SANDERS !!Hello, welcome to this ETHEREUM /USD update by CRYPTO SANDERS.
CHART ANALYSIS:-Ethereum (ETH) was mostly higher in today’s session, as bullish sentiment made an unexpected return.
Following a low of $1,771.15 to start the week, ETH/USD climbed to an intraday high of $1,871.35 on Tuesday.
Tuesday’s rally saw bulls push ethereum back to its strongest point since August 17, when the price hit a peak of $1,957.
One of the catalysts for today’s surge appears to be a breakout at the 61.50 zone on the RSI indicator.
Currently, price strength is tracking at 62.54, with an upcoming ceiling of 65.00 a possible destination for bulls.
Should this point be hit, there is a good chance ETH will be trading at $1,900.
I have tried to bring the best possible outcome to this chart.
Hit the like button if you like it and share your charts in the comments section.
Thank you

ETH/USD 1DAY UPDATE BY CRYPTO SANDERS !!Hello, welcome to this ETHEREUM /USD update by CRYPTO SANDERS.
CHART ANALYSIS:-Ethereum (ETH) was also higher to start the weekend, with prices once again climbing above the $1,800 level.
Following a low of $1,789.76 on Friday, ETH/USD raced to a peak at $1,844.68 earlier in today’s session.
As a result of the move, the world’s second-largest cryptocurrency jumped over a ceiling at the $1,825 zone.
From the chart, this seemingly coincided with the RSI breaking free of a resistance of its own at 59.00.
At the time of writing, price strength is now at the 60.15 mark, with the next visible ceiling around the 62.00 regions.
Should the RSI move closer to this point, ethereum bulls will send prices toward a long-term target of $1,900.
I have tried to bring the best possible outcome to this chart.
Hit the like button if you like it and share your charts in the comments section.
Thank you
