ETH/USD 1DAY UPDATE BY CRYPTO SANDERS !!Hello, welcome to this ETHEREUM /USD update by CRYPTO SANDERS.
CHART ANALYSIS:-Ethereum (ETH) continued to trade above $1,800 on Thursday, however sentiment shifted after it failed to sustain a breakout at a key point.
ETH/USD rose to a high of $1,827.28 on Thursday, which comes less than 24 hours after the price was at a low of $1,776.64.
Although marginally moving above its aforementioned ceiling at $1,825, ethereum bulls were unable to maintain upward momentum.
As of writing, ETH is trading at $1,800.78, which coincides with the RSI hovering around its recent resistance level at 58.00.
The index is currently tracking at 58.25, with a move below the 58.00 level almost certainly triggering further declines.
Momentum also appears to be slowing, with the 10-day (red) moving average nearing a downward crossover.
I have tried to bring the best possible outcome to this chart.
Hit the like button if you like it and share your charts in the comments section.
Thank you
Ethanalysis

ETH/USD 1DAY UPDATE BY CRYPTO SANDERS !!Hello, welcome to this ETHEREUM /USD update by CRYPTO SANDERS.
CHART ANALYSIS:-Ethereum (ETH) was also back in the green in today’s session, with prices rising back above the $1,800 level.
ETH/USD rose to a high of $1,825.60 on Wednesday, which comes less than 24 hours after the price was below $1,700.
As a result of today’s rally, ethereum was able to briefly rise above a recent resistance point at the $1,820 level.
Price has since retreated from this point, which comes after the RSI collided with a ceiling at the 58.00 mark.
Although price strength is now tracking at 58.52, overall market momentum seems to be preparing for consolidation.
The 10-day (red) moving average (MA) is now trending sideways, and should the RSI fall back below 58.00, the chances of a downward cross with the 25-day (blue) MA will greatly increase.
I have tried to bring the best possible outcome to this chart.
Hit the like button if you like it and share your charts in the comments section.
Thank you

Ethereum: Reaching Out… 🙌Ethereum is reaching out to complete wave 1 in green and still has got some room to rise. As soon as the respective high is established, though, the cryptocurrency should turn downwards and head for the green zone between $1607 and $1424, where wave 2 in green should end. With this low secured, Ethereum should then resume the ascent by developing wave 3 in green. However, a 30% chance remains for Ethereum to scoot below the support at $1370, which marks the last significant low of wave ii in orange. In that case, we would reckon with a new low in the form of wave alt.ii in orange in the orange zone between $1330 and $1150 before ETH can continue the upwards movement.

ETH/USD 1DAY UPDATE BY CRYPTO SANDERS !!Hello, welcome to this ETHEREUM /USD update by CRYPTO SANDERS.
CHART ANALYSIS:-Ethereum (ETH) largely consolidated on Monday, as prices moved away from a key price floor in today’s session.
ETH/USD jumped to a peak of $1,797.88 earlier in the day, which comes less than 24 hours after falling to a low of $1,748.44.
Since hitting a seven-month high of $1,861 last Thursday, the world’s second-largest cryptocurrency has mostly traded below $1,800.
Overall, ethereum is down 1.19% from the same point last week, with prices mostly moving between a floor of $1,730, and a ceiling of $1,820.
The 10-day (red) moving average has now begun to shift direction, with upwards momentum now fading.
Prices may continue to trend sideways heading into April unless some unexpected news moves markets.
I have tried to bring the best possible outcome to this chart.
Hit the like button if you like it and share your charts in the comments section.
Thank you

ETH/USD 1DAY UPDATE BY CRYPTO SANDERS !!Hello, welcome to this ETHEREUM /USD update by CRYPTO SANDERS.
CHART ANALYSIS:-Ethereum (ETH) also edged lower to start the weekend, as prices continued to fall from a recent seven-month high.
ETH/USD dropped to a bottom at $1,730.35 in today’s session, which comes a day after hitting a high of $1,791.14.
The move pushed ethereum to its long-term floor at $1,730, with buys opting to buy the dip at that point.
This recent drop in price has pushed Ethereum’s RSI to its lowest point in two-week, with a current reading of 55.39.
Momentum still remains marginally bullish, as seen by the 10-day (red) moving average, however, should prices move below $1,730, that could change.
I have tried to bring the best possible outcome to this chart.
Hit the like button if you like it and share your charts in the comments section.
Thank you

ETH/USD 1DAY UPDATE BY CRYPTO SANDERS !!Hello, welcome to this ETHEREUM /USD update by CRYPTO SANDERS.
CHART ANALYSIS:-Ethereum (ETH) briefly traded above the $1,800 level in today’s session, prior to colliding with a key resistance level.
ETH/USD rose to a peak of $1,853.89 late on Friday, which came following a prior low of $1,745.02.
This surge sent ETH to its strongest point since last August, pushing prices marginally above a ceiling of $1,850 in the process.
ETH bulls were unable to sustain this breakout, which has since given way to bears looking to short the market.
At the time of writing, ethereum is trading at $1,761.72, with the momentum of the moving averages still upwards facing.
This sentiment may soon shift, should the RSI break out of a floor at 56.00. The index is currently tracking at 56.62.
I have tried to bring the best possible outcome to this chart.
Hit the like button if you like it and share your charts in the comments section.
Thank you

ETH/USD 1DAY UPDATE BY CRYPTO SANDERS !!Hello, welcome to this ETHEREUM /USD update by CRYPTO SANDERS.
CHART ANALYSIS:-Ethereum (ETH) was also back in the red on Thursday, with prices moving below $1,800.
Following a high of $1,821.46 on Wednesday, ETH/USD declined to a low of $1,717.77 earlier in today’s session.
As a result of the slippage, ethereum neared a recent point of support at the $1,715 mark, however, bulls have so far rejected a breakout.
Looking at the chart, the 10-day (red) moving average remained in an upward trend, which could be a sign of future bullish momentum.
Price strength is currently tracking at 58.02, which is marginally above a floor at 57.00, resulting in ETH jumping from earlier lows.
At the time of writing, ethereum is tracking at $1,756.34.
I have tried to bring the best possible outcome to this chart.
Hit the like button if you like it and share your charts in the comments section.
Thank you

ETH/USD 1DAY UPDATE BY CRYPTO SANDERS !!Hello, welcome to this ETHEREUM /USD update by CRYPTO SANDERS.
CHART ANALYSIS:-Ethereum (ETH) was also back in the green on Wednesday, following a brief stint of consolidation the day prior.
ETH/USD moved to a high of $1,836.29 on hump-day, which comes less than 24 hours after trading at a low of $1,761.67.
Similar to bitcoin, Wednesday’s rally in price saw ETH near a recent high of $1,846, which is its strongest point since last August.
The 10-day (red) moving average (MA) has continued to trend upwards, extending its crossover with the 25-day (blue) MA.
However, price strength seems to be a barrier to further gains, with the index now tracking below a ceiling at 64.00
In order for bulls to extend gains, there will likely need to be a breakout of the aforementioned resistance level.
I have tried to bring the best possible outcome to this chart.
Hit the like button if you like it and share your charts in the comments section.
Thank you

ETH/USD 1DAY UPDATE BY CRYPTO SANDERS !!Hello, welcome to this ETHEREUM /USD update by CRYPTO SANDERS.
CHART ANALYSIS:-Ethereum (ETH) remained below $1,800 for the second straight session, following a recent climb into overbought territory.
ETH/USD fell to an intraday low of $1,725.01 on Tuesday, a day after trading at a peak of $1,788.13.
Despite a recent upward crossover of the 10-day (red) and 25-day (blue) moving averages, it appears that momentum has shifted.
From the chart, it appears that this coincides with the RSI falling back below a point of support at 61.00
At the time of writing, the index is tracking at 60.74, with ethereum slightly higher, and the asset is currently trading at $1,762.33.
In order for bulls to recapture the $1,800 mark, this ceiling on the RSI must first be broken.
I have tried to bring the best possible outcome to this chart.
Hit the like button if you like it and share your charts in the comments section.
Thank you

Ethereum retest support level 1635 and can continue to growHello traders, I want share with you my opinion about Ethereum. We can see how the Ethereum has been decline for a while and fall to the level 1375, after which it bounced back and begin to rise inside the upward channel. Not so long ago, the price broke through the resistance line of the channel and the resistance level 1585 from which increased. We can see how the price made a small correction and retested the support level. The price is now trading above the support level and may continue to rise. I think the price may continue to go up and break through the level 1635 and reach the resistance area 1670-1680 where I set goals for Ethereum. Please share this idea with your friends and click Boost 🚀

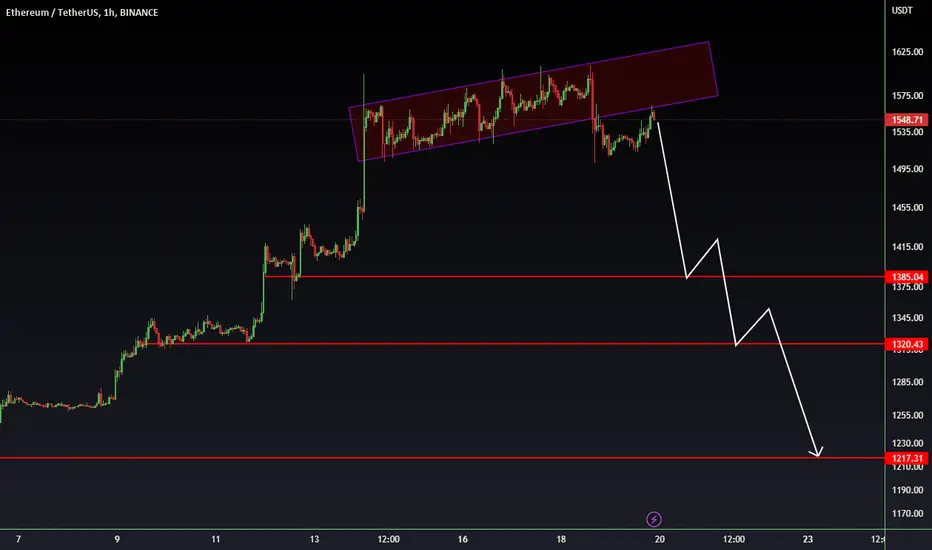
Ethereum- I'm selling above 1500Although I was bullish since the beginning of the year, I also said that I don't think it will last and, as a lot were calling, this is the "start of a new bull run".
Indeed, after a high of around 1700, Ethereum consolidated with a base at 1500 and, last week dropped under this important figure.
At the time of writing is trading at 1475 and I'm preparing to sell rallies and possible spikes above 1500.
My target is 1250 and negation comes with sustained buying power above 1600.

ETH long IDEAPrice swept previous week low and took out buy stops. The next high probable scenario is to take out sell stops above range high and to fill imbalance above (orange box), plus we have confluence like Fib retracement.
The next few days I expect to see price there.
Not a financial recommendation.
Have a good profit!

Uptrend Ethereum Is OverEthereum was struggling to break the resistance of 1670USD. After the final rejection, the was finally rejected.
Based on Fetch Trends, which used the rsi and 2 moving averages to calculate the colors, the uptrend is weakening. In my opinion, the uptrend is over.
We're now expecting a drop back to the support zone of 1260 to 1360. Based on the performance of stocks, it seems unlikely the price will make a lower low (875 USD).

Trend Ethereum Is Getting Weaker Ethereum's uptrend is weakening. This is not unexpected given that we are already at a key point in the cycles of both Ethereum and Bitcoin. The previous two tops were discovered after 58 and 43 days, respectively, while Ethereum's local top was discovered after 61 days.
Not only do we notice a daily cycle pattern, but Ethereum has also found resistance at the first critical point of 1700 USD. As the trend weakens, we're seeing a lower high.
Why is the trend weakening? This is represented not just in the rsi, but also in our indicator Fetch Trends, which utilizes the rsi to calculate its colors.
On top of that, our other indicator "moving average sequential strat" is firing off a sell signal, giving me us plenty of reasons to think the local top for Ethereum is either close or in.

ETH CAN DROP VERY SOONHi, dear traders. how are you ? Today we have a viewpoint to SELL/SHORT the ETH symbol.
For risk management, please don't forget stop loss and capital management
When we reach the first target, save some profit and then change the stop to entry
Comment if you have any questions
Thank You

ETH/USDT BinanceETH/USDT Binance
1D hollow candlesticks
As the bear market is over, we can say a few things for the price movement of altcoins.
A descending triangle has been formed, as the price already breakout this triangle.
Also, a parallel uptrend channel has been formed since the beginning of June 2022.
A first resistance area occurred from the extension of the first Fibonacci retracement.
A second main resistance area is a result of the extension of a second Fibonacci retracement.
A forecast indicator shows a possible price movement for the next months.
Ethereum Price (ETH) = $1,600.92 +2.85%
= 0.06945 BTC +1.25%
Market Cap: $1,048,131,057,077
24h Vol: $65,909,497,233
Dominance: BTC: 42.4%
ETH: 18.7%
Good Luck
#CryptoHellas Team

ETH CAN MAKE A CORRECTIONHi, dear traders. how are you ? Today we have a viewpoint to SELL/SHORT the ETH symbol.
For risk management, please don't forget stop loss and capital management
When we reach the first target, save some profit and then change the stop to entry
Comment if you have any questions
Thank You

ETH ETHEREUM 4 HOUR CHART Price Analysis Hello! Here's my eye on Ethereum on the 4-hour chart.
ETH MUST hold the support zone #1 if It wants to go up
IF ETH loses Support ZONE #1 and the current trendline, It will most likely go DOWN and test SUPPORT ZONE #2 1374-1437.
IF ETH can hold this SUPPORT ZONE It will go back up and test the top end of RESISTANCE ZONE#1 1607.
From here the next Resistance zone target would be around the 1669 LVL Then 1713 LVL from here.
I'm Neither Bullish nor Bearish on this COIN. Just showing some possibilities on the outcome of ETH in my opinion in the next coming days!
Please Comment or Like if you enjoyed this guys :)
Have an amazing day!

ETHUSD💥1H-TIMEFRAME ANALYSISETHUSD💥1H-TIMEFRAME ANALYSIS
💗Hello ladies and gentlemen
This is my new idea for 💥ETHUSD
I hope my idea is clear
Support me by like and share thank you
Stay Safe💯💲💲💲
Good luck💰😍
ETHUSDT💥1D-TIMEFRAME ANALYSISETHUSDT💥1D-TIMEFRAME ANALYSIS
💗Hello ladies and gentlemen
This is my new idea for 💥ETHUSDT
I hope my idea is clear
Support me by like and share thank you
Stay Safe💯💲💲💲
Good luck💰😍

ETHVery simple ... Very clear!
Everything is marked on the chart.
This is my personal opinion. Please do not trade based on my analysis and data.

Financial Wave. ETHOur preferred scenario in ETH remains the same. A rise in wave A could take prices to $1294. If the price of Ethereum drops below $1253, our markup will change.

ETH/USDT 1DAY UPDATE BY CRYPTO SANDERSHello, welcome to this ETH /USD 1DAY chart update by CRYPTOSANDERS.
I have tried to bring the best possible outcome to this chart.
CHART ANALYSIS:- Ethereum (ETH)
Another week has passed with little excitement for Ethereum investors as volatility was low – likely due to the Christmas holidays. However, ETH’s price did fall by 2% in the past seven days. This is a negligible move in the price, which still remains in a flat trend.
This cryptocurrency remains stuck between the key support at $1,160 and the resistance at $1,240. This channel is intact for the second half of December, and it is unlikely to be broken with the New Year celebrations around the corner.
Looking ahead, the volatility is more likely to return in January 2023. So long as the support levels above $1,000 hold, Ethereum has a chance to break away and attempt to make a higher high. The alternative would see it fall to a three-digit price.
This is not a piece of financial advice.
Hit the like button if you like it and share your charts in the comments section.
Thank you
