Whether or not it is supported in an important section is keyHello?
Traders, welcome.
If you "Follow", you can always get new information quickly.
Please also click "Boost".
Have a good day.
** Analysis of the BTC chart publishes new ideas once a week.
** However, we publish new ideas when volatility occurs or when we show signs of diverging from our expectations.
** Excluding the above situation, BTC analysis is listed as a daily update.
-------------------------------------
(ETHBTC 1W Chart)
The question is whether it can rise above 0.067660.
If not,
1st: 0.05719-0.060484
2nd: 0.048765-0.053586
You need to check if it is supported in the vicinity of the 1st and 2nd order.
----------------------------------------
(ETHUSDT chart)
If the price maintains the price by rising above the HA-High indicator on the 1M chart, it will show an uptrend on all 1D, 1W, and 1M charts.
Therefore, it is necessary to make sure that the HA-High indicator falls by shaking up and down in the 1572.69-2531.05 section.
(1W chart)
The question is whether the price can stay above the M-Signal indicator on the 1M chart and above the center line of the Bollinger bands and rise to around 2871.13.
If not, you should make sure you get support around 1338.65-1611.62.
In order to gain strength to rise around 2871.13, we need to see if the HA-High indicator makes it rise.
If the HA-High indicator shows support in the area where it is about to rise, it is expected to surge.
If it does not receive support, there is a possibility of a sharp decline on the contrary, so you need to think about countermeasures against this.
(1D chart)
If the price stays above the important support and resistance zone of 1572.69-1879.61, I would expect a rally around 2196.53.
If it falls below 1777.05-1879.61, it is likely to fall around 1572.69-1611.62.
Therefore, the next volatility period is around April 29th, when it rises above 1995.50 and needs to be confirmed.
If ETH leads the coin market's upward trend, the upward trend is likely to be short-lived and intermittent.
Therefore, the price movement of ETH should come out while the BTC price does not fall, that is, in a sideways manner.
-------------------------------------------------- -------------------------------------------
** All descriptions are for reference only and do not guarantee profit or loss in investment.
** Even if you know other people's know-how, it takes a considerable period of time to make it your own.
** This is a chart created with my know-how.
---------------------------------
ETHBTC

ETHBTC can only see greenI think CRYPTOCAP:ETH is very bullish right now and bitcoin is strong but slow, i think the adoption cycle will be faster for eth and the price will form a v top with a new price discovery ATH.
I think that the bottom is in on that graph: www.blockchaincenter.net and will go for the altcoin season, so now is a good time to buy.
this is just an idea, not financial advice.
Do your own research,

ethusdt H4Hi Guys , Hope you well
umm, shanghai upgrade is finish and Ethereum can withdraw from those who steak their Ethereum, maybe they want to sell them .
SecondChanceCrypto
⏰13/April/23
⛔️(DYOR)

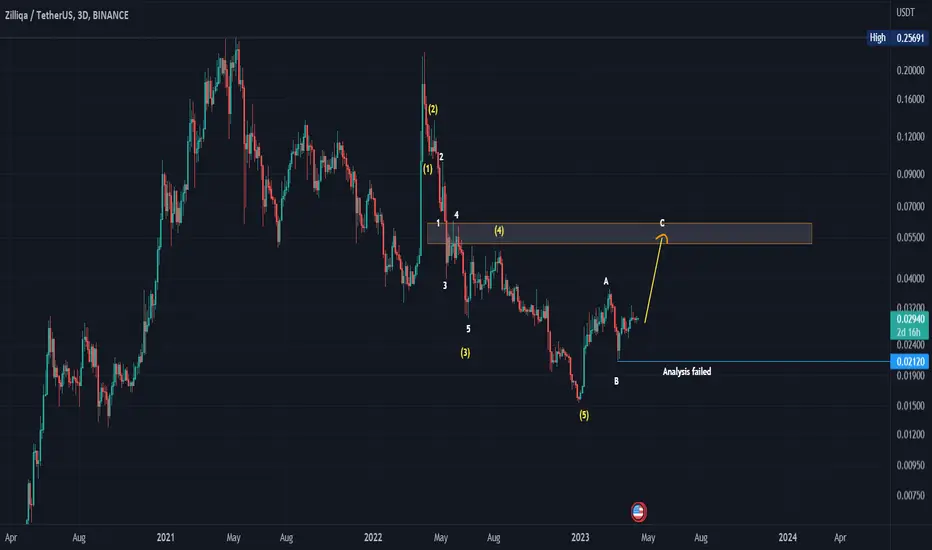
zilusdtWe are waiting for the C wave to complete with five motive waves for the shaded area
Note: The analysis fails if it closes below an area 0.0212
ETH will lose against BTCSince the last bear market in 2018/2019 ETH was gaining in dominance against Bitcoin. It is clear that ETH could show similar weakness against BTC like last bear market. Considering that a recession is highly probably, I have marked two simple scenarios:
— ETHBTC will retest the rage lows at 0.056
— If this level does not hold, we could see a retest of the 0.03 area. This will probably match with the theory of a three digit ETH (look at link to related ideas).
Cheers and good trading!

Ethereum Shanghai Upgrade - Potential ImpactThe Shanghai upgrade marks a significant milestone for the Ethereum network, enabling depositors to access their staked ETH for the first time since the launch of the Beacon Chain. With the upgrade, two main types of withdrawals will be possible: partial and full. Partial withdrawals, or skimming, will permit validators to withdraw their cumulative staking rewards, while full withdrawals will enable the complete withdrawal of staked ETH. This analysis aims to explore the potential implications of these withdrawals on the Ethereum economy and address concerns regarding the supply unlock event.
Shanghai presents a unique situation where rewards have accumulated over two years and will be unlocked simultaneously. The excess balance, which is not actively participating in Proof-of-Stake, amounts to around 1.137M ETH or about $2.1B in value. After the Shanghai upgrade, this sum will be automatically withdrawn from the Beacon Chain and transferred to the depositor's Ethereum mainnet address as an automatic balance update.
Validators with 0x00 withdrawal credentials own nearly 75% of the total accumulated rewards, while those with 0x01 credentials will have access to the remaining 25% (equivalent to 276k ETH). In an extreme scenario where all remaining validators update their withdrawal credentials after the Shanghai upgrade, we could see the entire sum of 1.137M ETH exit the Beacon Chain over 4.5 days.
Considering the depositor segmentation, a significant portion of the staking rewards is expected to be locked up again, as large staking providers such as Lido have vowed to primarily re-stake their rewards. Furthermore, non-institutional depositors with more extensive holdings are less likely to feel pressure to sell their ETH, especially given the recent positive market trend.
For full withdrawals, the daily number of validators that can exit is limited by the churn rate, which currently allows for a maximum of 1800 validators (or 57.6k ETH) to be withdrawn daily. Considering the withdrawal period determined by the churn limit, validators must pass through a withdraw-ability delay. This waiting period is 256 epochs for voluntarily exited validators, or around 27 hours long, and for slashed validators, it is 8192 epochs, or about 36 days. We have simulated the accumulated ETH accessible right after the Shanghai upgrade, approximately 45,098 ETH (equivalent to $83.3M).
Most existing validators belong to solo-stakers or stakers from the early days of the Beacon Chain, who are likely to have a high conviction rate. Therefore, most withdrawals are expected to be related to changes in their technical setup rather than completely exiting their position.
Considering partial and full withdrawals, we can model the potential supply pressure during the first week after the Shanghai upgrade. 1.54M ETH ($2.93B) could become liquid in the most extreme case. On the other hand, based on a 50% withdrawal credential update, segmentation of depositors, and different assumptions, our best estimate suggests that 170k ETH ($323M) could be sold.
Comparing these numbers to typical weekly exchange inflow volumes, even the most extreme case of 1.53M ETH is within the average weekly exchange inflow range. This indicates that the unlock event is on a similar scale to day-to-day trade for ETH markets and is unlikely to be as dire as many speculate it to be.
In conclusion, while it is impossible to predict the outcomes of the Shanghai upgrade fully, this analysis provides insights into the potential economic implications of the supply unlock event. The bulk of unlocked staking rewards is expected to come from users redeploying towards liquid staking providers, which have little need to sell due to being underwater. Moreover, Ethereum's Proof-of-Stake exit queue design will limit the amount of stake that can be drained from the pool at once, stretching the economic impact over days.
This piece was the summary of this analysis by Glassnode. If you want to read the full analysis, read this: insights.glassnode.com

Trade Alert - Take ProfitTraders,
Admittedly, I may still be a bit skittish in this bear market. Maybe I am being too cautious? But with tomorrow's Shanghai upgrade on Ethereum happening tomorrow in which millions of Eth will be unlocked AND with this latest candle forming what could end up being a bearish shooting star, I am happy to take my profits here and wait it out.
Closing this trade will bring out win streak to 14 in a row. Congrats to all those who have been following me in these recent trades!
Stew


BITCOIN 1D next supports In previous analyzes we mentioned two important areas that did not resist due to the analysis of the important area and the process of the channel began. I have already identified important support ranges in the chart.
Its not Buy or Sell SIGNAL
DYOR
BY : M.TeriZ - @AtonicShark

One of Ethereum's strong scenariosHi, I hope you are well
One of the strong scenarios of Ethereum in this contraction triangle is that we are inside wave b of the big c of this triangle. The wave ba has become a diametric from c itself, which seems to be the same in the wave d of this diametric.
Comment if you have any questions

ETHBTC 2023 Weekly AnalysisA weekly panorama of ETHBTC. Looking good in the long term. As of now, Ethereum is slowly outperforming BTC but we are not quite there yet.
The ETHBTC trading pair is often used by cryptocurrency traders and analysts to determine the beginning of an "alt season." An alt season refers to a period when alternative cryptocurrencies, or "altcoins," outperform Bitcoin in terms of price gains.
The reason why the ETHBTC trading pair is used to determine alt seasons is because Ethereum is considered a key indicator of the health of the altcoin market. This is because Ethereum is the most popular platform for creating decentralized applications (dApps) and smart contracts, and many altcoins are built on the Ethereum blockchain.
When the ETHBTC ratio is increasing, it means that Ethereum is outperforming Bitcoin, which can be a sign that altcoins are gaining momentum. This is because as Ethereum gains value, it attracts more attention and investment from traders and investors, which can spill over into the wider altcoin market.
Conversely, when the ETHBTC ratio is decreasing, it can be a sign that the altcoin market is losing momentum and that investors are flocking back to Bitcoin, which is seen as a safer and more stable investment.
In summary, the ETHBTC trading pair is used to determine alt seasons because it reflects the relative performance of Ethereum and Bitcoin, and Ethereum is considered a key indicator of the health of the altcoin market. When Ethereum is outperforming Bitcoin, it can be a sign that the altcoin market is gaining momentum, while when Ethereum is underperforming Bitcoin, it can be a sign that the altcoin market is losing steam.

ETHBTC About to bottom and Ethereum to outperform?We haven't looked into the ETHBTC pair in a while but there is no better time than now, in the build up of what the market calls an 'alt season'. As you see the pair hit its 1D MA50 (blue trend-line) this week after a strong rebound on the RSI from below the 30.00 oversold barrier. Last time that happened was on June 13 2022.
The Fibonacci levels help at identifying key Support and Resistance levels within this two year horizon very effectively. The question is, do we have one last Lower Low on the 1D RSI trend-line before ETH starts outperforming BTC again?
-------------------------------------------------------------------------------
** Please LIKE 👍, FOLLOW ✅, SHARE 🙌 and COMMENT ✍ if you enjoy this idea! Also share your ideas and charts in the comments section below! **
-------------------------------------------------------------------------------
💸💸💸💸💸💸
👇 👇 👇 👇 👇 👇

#Ethereum Adds 10% versus Bitcoin as Traders Target 0.072 BTCPast Performance of ETHBTC
After underperforming Bitcoin throughout Q1 2023, dropping roughly 20% in three months, the tide is beginning to change. ETH buyers are in control when writing, checking the performance in the daily chart. As it is, ETH is up 10% from March lows. At this pace, and with ETH prices breaking out versus Bitcoin, traders can look to add to their longs, riding the emerging trend.
#ETHBTC Technical Analysis
The path of least resistance is northwards as Ethereum recovers after sharp losses in Q1 2023. Critical support lies at March lows at 0.062BTC while a reaction line traders should watch is 0.065 BTC. With prices above the middle BB, every dip is a loading opportunity, with targets set at mid-March 2023 high at around 0.072 BTC. Per the formation in the daily chart, traders can look to buy the dips as momentum picks up. Already, bull bars appear to band along the upper BB, a possible opportunity for bulls.
What to Expect from #ETHBTC?
The ETH rally is driven by fundamentals as network users look forward to Shanghai. At this pace, ETH may peel back losses posted versus BTC, retest March highs, and even push back to Q1 2023 highs and primary resistance at 0.077 BTC.
Resistance level to watch out for: 0.072 BTC
Support level to watch out for: 0.065 BTC
Disclaimer: Opinions expressed are not investment advice. Do your research.

Need to confirm movement around April 3rdHello?
Traders, welcome.
If you "Follow", you can always get new information quickly.
Please also click "Boost".
Have a good day.
-------------------------------------
(ETHBTC 1W Chart)
It is showing a decline without being able to overcome the rise of BTC.
Therefore, it is necessary to check whether it can rise above 0.067660.
If not, you should check for support around 0.057192.
-----------------------------------------------
(ETHUSDT chart)
(1M chart)
The key is whether the price can be sustained by rising above the MS-Signal indicator.
This is because maintaining the price above the MS-Signal indicator means that there is a high possibility of continuing the upward trend in the long term from a trend perspective.
However, since the HA-High indicator is located at 3321.30, it is expected that the HA-High indicator will fall by shaking it up and down.
(1W chart)
Like the BTC chart, it has risen above the M-Signal indicator on the 1M chart.
Therefore, the key is whether the price can be maintained above the M-Signal indicator.
If that fails, you should check for support around 1611.62.
(1D chart)
I mentioned that the period between February 27th and April 3rd is important, but now that period is about to close.
During the above period, it is necessary to confirm that the price can maintain the price by rising above 1879.61.
If the price holds above 1879.61, it is expected that an upward movement towards 2531.05 will begin.
If it fails to rise above 1879.61,
1st: 1572.69
2nd : 1340.12-1460.54
You need to check if it is supported in the vicinity of the 1st and 2nd order.
We need to see what kind of movement will come out with the volatility around April 3rd.
-------------------------------------------------- -------------------------------------------
** All descriptions are for reference only and do not guarantee profit or loss in investment.
** Even if you know other people's know-how, it takes a considerable period of time to make it your own.
** This is a chart created with my know-how.
---------------------------------

Big altcoin move incomingThe ETHBTC chart is very helpful for identifying when altcoins are about to have a strong move, the reason for that is because Ethereum tends to run the entire altcoin market. It isn't a perfect indicator, but in general if ETH is performing well, then so are many other altcoins.
ETHBTC is currently retesting a resistance line that it broke below. This is technically a bearish retest, but if ETHBTC can break higher, this could be the opportunity for much of the money in the market to flow into the altcoins. However, on the other hand, if this bearish retest is confirmed it could be very bad for the altcoin market.
This isn't something I would front-run a trade on, but gives us some insight that the next move in the market could be a large one. And it's always good to revisit BTC outlook to see how these may overlap. And in the chart below we can see BTC is still in the range that we have been watching for over a week now.
So the scenarios that could play out are the following:
ETHBTC bearishly retests and BTC breaks lower, altcoins will get crushed if this happens
ETHBTC bearishly retests and BTC breaks higher, altcoins will likely not trade very well. This is similar to some of the altcoin trading we've had in the last few weeks.
ETHBTC breaks higher and BTC breaks lower, altcoins could be difficult to trade in this scenario as well, likely a mix between some bleeding out, some moving higher, and some stationary.
ETHBTC breaks higher and BTC breaks higher, altcoins will see significant upside if this happens.
My motive in these scenarios as I've mentioned in recent posts, is just to remain on the sidelines. I only like to trade when there is a clear advantage on my side and I don't currently see it. So rather than betting on one side, I opt to just keep my capital safe.
Happy trading!

Is Ethereum Heading For 50K?#ETHUSDT analysis (1D)
One of the scenarios that Ethereum has is the completion of its large diametric wave D.
If it stabilizes on the $2500 resistance, its 50K target can be activated.
If we go back below $1200, the D wave can expand and become more time-consuming

ETH/USD 1DAY UPDATE BY CRYPTO SANDERS !!Hello, welcome to this ETHEREUM /USD update by CRYPTO SANDERS.
CHART ANALYSIS:-Ethereum (ETH) continues to trade above the $1,800 level, with traders still targeting a breakout above a key resistance level.
ETH/USD rose to a high of $1,819.29 earlier in today’s session, which comes after an earlier bottom at $1,765.52.
As a result of today’s jump, ethereum bulls attempted to move towards a ceiling at $1,825, however, momentum has since eased.
This comes as earlier bulls seemingly abandoned their positions as the RSI ran into a wall at the 60.00 level.
At the time of writing, price strength is now at the 57.77 mark, with the next visible ceiling around the 62.00 regions.
In addition to this, the 10-day (red) moving average is now nearing a downward cross with its 25-day (blue) counterpart, which could signal upcoming price weakness.
I have tried to bring the best possible outcome to this chart.
Hit the like button if you like it and share your charts in the comments section.
Thank you

Ethereum is about to make it's move...GEMINI:ETHBTC
My prediction: Within the next 16 hours Ethereum is about to make a quick drop and a bounce to break the current resistance. What do you think? Check the comments for my price prediction for this next wave.

ETH CAN GO UPPERHi, dear traders. how are you ? Today we have a viewpoint to BUY/LONG the ETH symbol.
For risk management, please don't forget stop loss and capital management
When we reach the first target, save some profit and then change the stop to entry
Comment if you have any questions
Thank You

Inverted HS Pattern on Weekly?Possible inverted HS forming on the weekly Ethereum / BTC chart. Question is - are we forming the right shoulder now, or will we see a strong dip forming a more symmetrical right shoulder first?
Chart is marked Long, but could be a strong short down towards 0.02 btc prior to turning long. Need to see weekly break and hold above the neckline before actually positioning a long.

Ethereum - Secret bear flag! (70% crash target)
Ethereum shows a lot of weakness on the major timeframe. You can see that the downtrend was pretty steep, and now we are in a bullish correction / consolidation.
The chart is printing a big bearish flag or ascending parallel channel, and I think we should test the upper trendline first before continuing lower below 900 USDT. The bear flag is a little bit hidden, but you can spot it with a little skill. We have been consolidating within this bear flag for almost a year now.
At least a 30% pump is very possible at this moment, and it will be a great time to take profits before a huge crash!
This analysis is not a trade setup; there is no stop-loss, entry point, profit target, expected duration of the trade, risk-to-reward ratio, or timing. I post trade setups privately.
You can see my Elliott Wave count on the chart. I don't know whats yours, but you can take some inspiration. A lot of people are very bullish at this moment, but the chart does not look bullish.
A trendline from 2015 on the ETHBTC chart is breaking down, which is a significant bearish technical event. Make sure you check out the trendline in the related section down below!
I can say that the majority of people are refusing to accept the fact that ETH and BTC could continue in the bear market. I can see it below my previous posts in the comment section, so I can make a pretty accurate conclusion. I also use this indicator for my analysis.
The major crash could occur in September 2023 or later. Now I think ETH will go up by 30%, even though I am not going to speculate on any longs at this point on ETH.
Choose some better altcoins, such as WAVES!
Thank you, and for more ideas, hit "Like" and "Follow"!

ETH/USDT Broadening Top ETH Making A Broadening Top Pattern.Currently On Count 4 Which Holding At 1900$

ETH 2H BUYETH 2H support is now at ~$1760
Enter 50% at the current price
and try to set some BUY orders near the support zone
If ETH stays above the trendline,
the Take-Profit target would be 5%, 10%, and 15% from your entry
Cheers
