#ETH/USDT#ETH
The price is moving in a descending channel on the 1-hour frame and is adhering to it well and is heading to break it strongly upwards and retest it
We have a rebound from the lower limit of the descending channel, this support is at a price of 1950
We have a downtrend on the RSI indicator that is about to break and retest, which supports the rise
We have a trend to stabilize above the moving average 100
Entry price 2236
First target 2340
Second target 2414
Third target 2530
ETHBTC

ETH NEW ANALYSIS (1D)A more comprehensive analysis for Ethereum is as follows:
It seems that wave E of our Diametric is nearing completion. For wave F, Ethereum should experience upward retracements and spend some time consolidating.
The best zone for the completion of wave E is marked on the chart as the upper green box.
The optimal rejection area for price to move downward and complete wave F is marked by the red circle. Now, we wait to see whether the price reaches this zone for wave F or not.
Wave G may have two potential targets: either the upper or lower green box at the bottom of the chart.
For risk management, please don't forget stop loss and capital management
Comment if you have any questions
Thank You

ETHBTC analyse for 2025-2026I did my analyse on this chart around December 2024 and I showed some friends too. My bad to place it now, but the real pain will start soon. If you look closely at the ETH/BTC charts, you’ll see ETH has broken its 8-year uptrend and lost a key level, pausing around 0.036. My expectation is that price will move down to the lower green bar I’ve marked; if it can hold there, we could see a local bottom forming.
It’s wild that so many paid “crypto gurus” have been calling for an altseason over the last nine months even 1 year... despite the clear downtrend. This chart alone shows how misguided those calls have been. Always do your own analysis and don’t let anyone sell you illusions!!

$ETH + $BTC CryptocapCRYPTOCAP:ETH + CRYPTOCAP:BTC Cryptocap pair confirms the r-test phase after the handle cup formation breakout

Supply & Demand for BTC.d <---> ETHBTCA notable change may be occurring in the market dynamics surrounding Bitcoin dominance, which reflects BTC’s share of the overall cryptocurrency market. Recently, it has displayed a shooting star candle, indicating a potential decline in BTC’s market influence. These signs point towards the beginning of an alt season, a time when alternative cryptocurrencies tend to outperform Bitcoin. With BTC stabilising around the significant $100k mark, the environment appears ripe for altcoins to attract investor interest. The upcoming weeks will be crucial in assessing whether this trend will gain traction, possibly transforming the market landscape for 2025.
Bitcoin experienced an impressive 2024, achieving new milestones and reinforcing its status as the market frontrunner. As we move into 2025, BTC remains robust, yet a shift in market dynamics may be imminent. Historically, Bitcoin’s dominance tends to wane when altcoins start to gain momentum, and this year might follow that pattern.
As Bitcoin finds stability around crucial price points, we often see liquidity shifting towards altcoins, sparking what many refer to as an alt season. Historically, during these times, altcoins tend to surpass Bitcoin in performance, offering significant returns for those investors ready to explore beyond BTC. With TOTAL3 approaching new price discovery and Bitcoin's dominance on the decline, the potential for altcoins to take center stage is becoming more apparent.
The crucial factor for BTC.d to unlock is how ETH performs against BTC. With the ETH/BTC ratio below 0.03, it appears appealing, but until it begins to rise, the alt season will be postponed. Alt season typically arises when Bitcoin dominance is high, not when it's low.
Typically, Bitcoin dominance tends to decrease in the years following a halving event. Therefore, I suspect that by the end of the year, dominance will be in the negative. However, up to this point, we have seen an increase in dominance this year.

Ethereum has turned bearish (12H TF)After the CH turned bearish and lost the flip zone, along with the formation of a large liquidity pool below the chart, there are multiple confirmations that Ethereum is in a bearish structure.
It is expected to reach the lower demand zone and sweep the liquidity pool along its path.
A daily candle closing above the invalidation level will invalidate this analysis.
Do not enter the position without capital management and stop setting
Comment if you have any questions
thank you

BTCUSDT H8 : SHORT positionHi Guys ,
This my new analysis for BITCOIN , Please check it and do your best.
SecondChanceCrypto
⏰ 26/FEB/25
⛔️DYOR
Always do your research.
If you have any questions, you can write them in the comments below and I will answer them.
And please don't forget to support this idea with your likes and comments.

The bearish scenario for Ethereum is now active (1D)We have always relied on the flip zone from our previous Ethereum analyses. Now that this zone has been broken, the bearish scenario for Ethereum is active.
A more accurate interpretation suggests that this is the correct structure. Given this, we have been in Ethereum's bearish Wave C for some time.
Ethereum is expected to move from the red zone toward the green zone soon.
For risk management, please don't forget stop loss and capital management
Comment if you have any questions
Thank You

ETH Is Always "Dead" On Support MartyBoots here , I have been trading for 17 years and sharing my thoughts on ETH here.
ETH is looking beautiful , very strong chart for more upside if this support can hold
Do not miss out on ETH as this is a great opportunity
Watch video for more details

#ETH/USDT#ETH
The price is moving in a descending channel on the 1-hour frame and is adhering to it well and is heading to break it strongly upwards and retest it
We have a bounce from the lower limit of the descending channel, this support is at a price of 2660
We have a downtrend on the RSI indicator that is about to break and retest, which supports the rise
We have a trend to stabilize above the moving average 100
Entry price 2694
First target 2735
Second target 2773
Third target 2828

ETHBTC - Is the Bear Nearly Over? Price is now testing the 0.618 level which is seen as a strong support for price
Hopefully at this level we see a reversal from the bulls and price pushes up to .786
This bear market has been brutal for ETH
Alt season will kick in soon, with ETH leading
Green bars pattern is just my price action thoughts
Daily timeframe

ETH disappointed everyone, but not meThe recent ETH capitulation reminds me of March 2020.
A false break from the triangle up -> big drop down -> start of the rally.
People thought ETH was dead, but then the game changed.
I think we will soon see history repeat itself.
ETH did not disappoint me because I had been waiting for the fall for a very long time
And we reached the largest horizontal volumes
Best regards EXCAVO

KEY DEMAND ZONE FOR ETHBTCKey demand zone here for ETHBTC holding support here is SUPER CRUCIAL for atlcoins and ethereum itself.
If we don't expect many alts to make new lows before MAYBE reversing.
A bearish ETHBTC = BTC.D bullish = alts bleeding
A bullish ETHTC = BTC.D bearish = alts pump
only time will tell. Im sitting on the sidelines and max betting on some projects out there as they are massively undervalued imo.
Goodluck.

ETHBTC x BTC.DWhile ethereum bitcoin parity is in a local bottom region in HTF, Bitcoin dominance is in the local peak region.

ETH about to Moon? Possible?BINANCE:ETHBTC ’s current structure looks eerily similar to pre-pump 2017:
✅ Forming a descending wedge, nearing the end.
✅ Bounced after breaking below Fib 0.236, forming two lows (second lower than first).
Historically, when CRYPTOCAP:ETH outperforms CRYPTOCAP:BTC , altseason follows.
But does this mean BINANCE:ETHUSDT is about to skyrocket? I don’t know.
All I can say is—the possibility is there.
🔥 But here’s the catch…
Every chart pattern you see is what market manipulators want you to see.
Sometimes, they reinforce a pattern with multiple pumps…
Then, just when everyone trusts it, they wreck it with one final serious drop.
That’s the classic "bait, trap, slaughter" strategy.
So, should you blindly trust chart patterns? No.
Should you completely ignore them? Also no.
Because let’s be real—most people never believe in a bull run until it’s already happening.
Same goes for crashes.
🔥 The real question is:
Do you stay out just because nothing is 100% certain?
🔥 If you think crypto is doomed, short it.
At the end of the day, your portfolio reflects your beliefs.
🔥 If you think this post sucks, you’re right.
I won’t argue—it’s pointless.
For me, the market is always right.
I’m the only one who can be wrong.
That’s why I always set stop losses.
So even if altseason never comes , I’ll still have most of my capital ready for the next opportunity.
🔴 Read my signature & publications for more info you don’t want to miss.
🔥 for more future script "guesses" like this!

2025 - Year of ETHEREUM = 10kWe are nearing Ethereum's historical reversal. I have been waiting for this zone for a long time, and we are already here.
Check this chart
Now, let's turn on the logic. Many financial institutions and banks did not buy that amount of Bitcoin at a low price, and now, looking at the reality, they realize that they will not miss such a chance with the number two cryptocurrency in the world. Calling Ethereum the number one cryptocurrency in the future and making irrefutable arguments about the more excellent technology of a larger ecosystem and others.
Therefore, based on this logic, we can see an unprecedented influx of money into Ethereum and the entire ecosystem will fly upwards, all L2 solutions and all those projects that came out in the last 2 years in the ecosystem of ethereum that have not shown any result and disappointed the cryptocurrency community. When the majority went into super-tech projects, memcoins performed. To a greater extent this ecosystem will be inflated by retail and small funds based on the logic above, large market participants will recruit and already accumulate the primary cryptocurrency of the ecosystem - ETH.
This is why we can see the coveted 10k$ per coin in 2025.
Best regards EXCAVO

ETHBTC , GOING UP?!Hi everyone,
As we see ethbtc toyched fib 0.768 very nice,
A rejection from here could pump it ,
Wait for it soon …
( trade on your own risk )

Will 2025 Bring an Altcoin Season or Continued Divergence?
🔷 BTC.D (Bitcoin Dominance)
Trend momentum has been strongly bullish since late 2022 and shows no signs of slowing on higher time frames (6M, 12M). When BTC.D trends higher, the market tends to concentrate capital in BTC, making it difficult for many altcoins to rally. Any short-term dips in BTC.D on daily or weekly charts could temporarily release some capital into altcoins, but overall, the dominant uptrend remains intact.
🔸 ETHBTC
The ratio has been signaling a SELL bias since late 2023, continuing throughout 2024. It reflects ETH’s weakness relative to BTC. On the 3M chart, ETHBTC is in a downtrend; any upward corrections are likely just retracements before further declines. There’s no clear sign that ETHBTC has bottomed across the monthly, 3-month, 6-month, or yearly cycles.
✔️ Conclusion
BTC.D may see short-term corrections in 2025 but is expected to continue rising overall. ETHBTC, on the other hand, will likely continue its downward trajectory, with occasional small rebounds along the way. This suggests no broad Altcoin Season in 2025; instead, expect ongoing fragmentation within the altcoin market. Capital will rotate selectively based on each sector or individual coin’s structure.
💡 Strategy
Use caution when rotating funds from altcoins to BTC to optimize returns. Carefully select altcoins that show genuine growth potential in 2025, and avoid emotional allocation. Emphasize short-term strategies—buy for the short term, take profits quickly—to navigate a market where altcoins remain highly divergent.

ethbtc bottom is inBINANCE:ETHBTC pair is above the trend line on a linear scale, where the Federal Reserve started QE in August 2019!

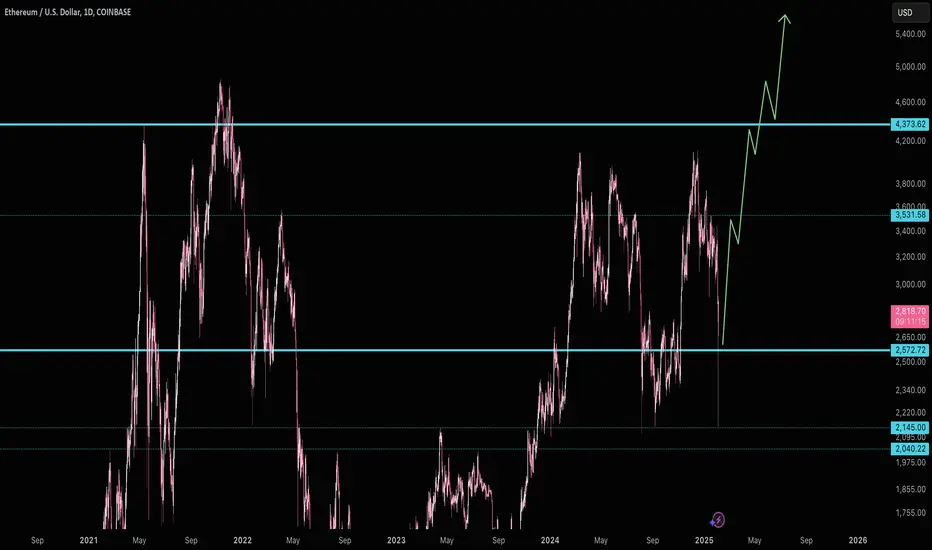
Ethereum Selling ClimaxThis last, uniquely dramatic, move down smells like capitulation for the remaining sellers. It's pretty hard to find any moves similar to February 3rd (May 2021 or covid?). ETH/BTC is in the long term buy zone below 0.0348.
$2570 is the major support, though every attempt down panics below considerably. $3530 is the most near term minor resistance. Upon clearing that, $4373 (the current ATH resistance) is the big resistance to clear. Because of how low ETH/BTC went and the rarity of this sell off I would heavily bet this resistance will be cleared and is highly likely to be our next major support area.
Eth is always the last in the cycle to run, so hold steady, the eth bull market is starting.
Good luck!
#ETH/USDT#ETH
The price is moving in a descending channel on the 1-hour frame and is adhering to it well and is heading to break it strongly upwards
We have a bounce from the lower limit of the descending channel, this support is at a price of 2374
We have a downtrend on the RSI indicator that is about to be broken, which supports the rise
We have a trend to stabilize above the moving average 100
Entry price 2600
First target 2742
Second target 2942
Third target 3127

BTCUSDT H4 :UPDATE ROADMAPHi Guys,
If you Follow me ,This is my new analysis for bitcoin in mid-term.
Don't Forget we ha a GAP in 102000$ and Of course in 77000$.
SecondChanceCrypto
⏰ 3/FEB/25
⛔️DYOR
Always do your research.
If you have any questions, you can write them in the comments below and I will answer them.
And please don't forget to support this idea with your likes and comments.
