ETHBTC 2WETH ~ 2W
#ETH This is an important support Block for BITSTAMP:ETHBTC Pair Trading. If you like this trade,. This is a very good support Block to start buying gradually. with a minimum target of 20%++
Ethbtcbuy

ETHBTCIt's around 800 days since ETH is under pressure from BTC many people during these boring period bought and bought without any profit and the loss their Bitcoins.
what happen next ?
I believe we are in a last leg down weeks tolerate a bit more it would be surprising after all even for a short time pumping.

#ETH/USDT#ETH
Ethereum
The descending channel has been clearly broken on today's frame
It is expected to touch $2174 before the recovery and rebound begins
We have a sell saturation on the RSI indicator
We have a trend to return above the moving average 100 again
We have a strong support extending from $2000 to $2100
A rebound is expected from that area targeting
First target 2460
Second target 2830

ETHBTC 1WETHBTC ~ 1W 📈
#ETHBTC It's quite interesting to place small purchases here, make purchases gradually with a minimum target of 20%+

ETHBTC Price Action ObservationsWe have the ETHBTC buy signal. We have some upside for ETH both in USD and BTC valuations over the next few weeks. Holding ETH will pay off. This is consistent with the past movements of ETH prior to the BTC halvings. We also have the macro potential ETH ETF event. Strong confluence of bullish events. I put my ETHBTC levels and projections on the chart.

Impact of Dropping ETH/BTC Ratio and the Need to Trade BTC MoreI would like to draw your attention to an important development in the cryptocurrency market that requires our cautious consideration. The ETH/BTC ratio has experienced a significant drop recently, prompting us to reevaluate our trading strategies and focus on maximizing potential gains.
As you may be aware, the ETH/BTC ratio refers to the value of Ethereum (ETH) about Bitcoin (BTC). This ratio serves as a valuable indicator of market sentiment and can greatly influence trading decisions. The recent decline in this ratio suggests a shift in market dynamics, with Bitcoin gaining dominance over Ethereum.
While it's essential to remain cautious during such times, it's equally important to adapt and take advantage of emerging opportunities. Therefore, I encourage you to consider trading BTC more actively, leveraging the rising BTC dominance. By focusing on Bitcoin, we can potentially maximize our profits and navigate through this transitional period with greater confidence.
Here are a few steps you can take to optimize your trading strategy:
1. Stay Informed: Keep a close eye on market trends, news, and analysis to make informed decisions.
2. Diversify Your Portfolio: While focusing on BTC, it's also wise to maintain a diversified portfolio to manage risk effectively. Explore other cryptocurrencies that show growth potential and align with your investment goals.
3. Utilize Stop-Loss Orders: Implementing stop-loss orders can help protect your investments by automatically triggering a sale when the price reaches a predetermined level. This feature minimizes potential losses during volatile market conditions.
4. Leverage Trading Tools: TradingView offers a variety of technical analysis tools, such as charts, indicators, and signals, to help you identify trends and execute profitable trades.
Remember, trading in times of market transition requires caution and adaptability. By closely monitoring the shifting ETH/BTC ratio and focusing on BTC dominance, we can position ourselves for potential gains.

ETHBTC showing upside to come to 0.08 due to W and TriangleW Formation has formed on the ETH/BTC pair.
There is also an Ascending Triangle, with higher lows and same highs.
We are near the neckline where the price is quite likely to break up and out of.
We have other signs like
7>21 MA
Price>200 MA
RSI>50
Target is for the ETH/BTC to head to 0.08
For those that don't know how it works...
HOW ETH/BTC works
ETHBTC is a trading pair similar to Forex pairs.
With crypto, it represents the exchange rate between Ethereum (ETH) and Bitcoin (BTC).
And as always with trading pairs, there is a primary and secondary coin.
The primary (Ethereum) is how much 1 unit of ETH can be exchanged for a certain amount of Bitcoin.
ETH/BTC
1 / X No. bitcoins.
Right now, the current ETH/BTC exchange rate is 0.06.
This means, 1 ETH is worth 0.06 BTC.
Or conversely, we can see how much 1 BTC is worth in ETH.
To do that we divide the two.
BTC/ETH = 1/0.06 = 16.66 Ethereum per Bitcoin.
ETHBTC works based on the principles of supply and demand in the cryptocurrency market.
The exchange rate is determined by the ongoing buying and selling activity of traders on the exchange platform.
When there is more demand for Ethereum relative to Bitcoin, the ETHBTC price tends to rise.
Conversely, if there is more demand for Bitcoin relative to Ethereum, the ETHBTC price tends to fall.
Right now we can expect the ETH/BTC to go up, which means Ethereum will mostly likely strengthen in the near future compared to Bitcoin.
Hence I expect the price to go to ETH / BTC = 1: 0.08.

ETHBTC hitting monthly support, likely to bounce from this zoneETHBTC is hitting monthly and weekly support level. This zone should be a good place for it to bounce. There is another weekly support sitting here in case this one fails but I think this is already a good zone for bounce. It is possible that the price might spend some time inside this zone before it starts upward movement.

Ethereum (ETH) formed a bullish Gartley | A good buy opportunityHi dear friends , hope you are well and welcome to the new trade setup of Ethereum coin.
Previously after crossing the 1st target the price moved down:
Now on a daily time frame, Ethereum with BTC pair has formed a bullish Gartley move for another pump.
Note: Above idea is for educational purpose only. It is advised to diversify and strictly follow the stop loss, and don't get stuck with trade

ETHBTC Breakout IdeaAn idea using my fib waves analysis
Price has crossed the 2.618 in blue, which was previously seen as a strong breakout area
It may act like this again
218% puts price at around 0.16ETH/ BTC
Tops can be identified in red

ETHBTC Top Pattern Downward ETHBTC has provided some amazing wedge chart patterns (contracting)
Wedge 1 and 3 are very similar, both leading to a red double top pattern that will likely lead to a bottom along the yellow Fibonacci circle
Interesting chart


Spotted Fractal on ETHBTC pairThese two are similar in many ways.
During last Feb-Mar price was coming down; I was expecting it to finish a curved triangle pattern at 0.025 area. But it didn't. This time again, after deviation above the range(0.077-0.6), it should come down to 0.6. But it didn't.
If this will play out, it can take this pair back to its ATH in the 0.14 area.


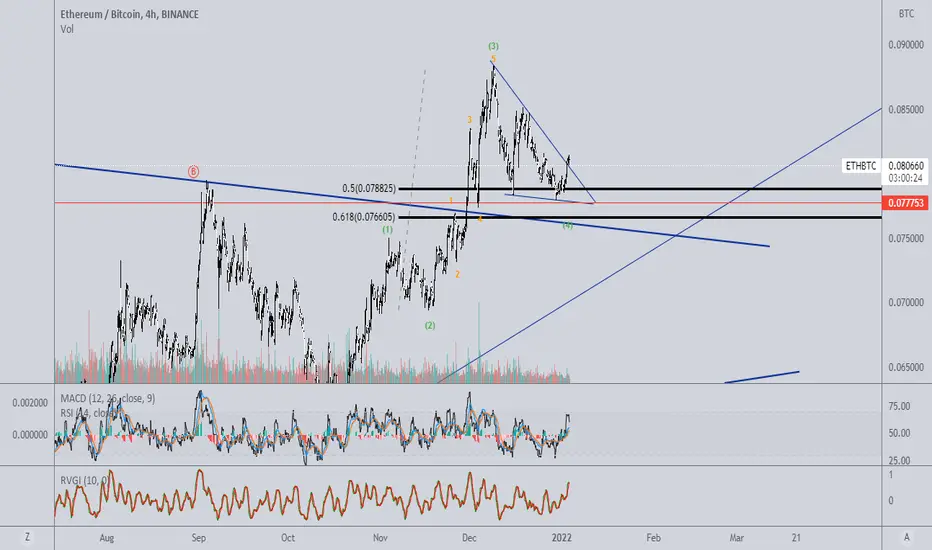
ETHBTCThe price break out the falling line and it look like double bottom. it could be new impulse wave or wave D of 4.

Something I Noticed on ETHBTC Angles can be drawn between two earlier top points and two latter top points that have arisen in the recent bull move
They are very similar in structure just on different scales

ETH/USDT 2HOUR UPDATE BY CRYPTOSANDERSWelcome to this quick ETH/USDT analysis.
I have tried my best to bring the best possible outcome in this chart.
Hello mate.
As I mentioned in my previous chart it may bounce off the green line which will be a signal for momentum in the altcoin.
Now if it bounces from the red line then we can see a good rally in an altcoin.
Stay tuned with us for more updates.
Sorry for my English it is not my native language.
Do hit the like button if you like it and share your charts in the comments section.
Thank you.

ETHBTCIndicators show us divergence and the line is really important. so i think it's ready to grow.


ETHBTC, Its ready to have some rises of altcoinsHello everybody
ETHBTC is one of the most important pair for the movement of total 2 and 3 because ...
If you want to learn Fundamental & Technical analysis send us messages ---> Our id is in profile
According to the chart, After we are ranging price in market today after unemployement rate reported the price impact to it and make new rally.
After the price was make breakwave and we need some pullback and we can take in position on any altcoins after pullback completed and we can wait until the target reach.
Please observe capital management and dont forget use stop loss
Good Luck
Abtin

ETHBTC Interesting Patterns Along the 100MAThis structure labelled in 1,2,3,4,5 repeats itself 3 times over the 100MA
Its quite amazing how price action can repeat itself so similarly over such a short period of time

ETHBTC Up at 100MAETHBTC is looking for a place to push itself to new highs
The 100MA on this timeframe is a nice starting point for price to return to the bullish side

ETHBTCIts 50% FIB area and this area is bottom of the previous wave 4. just wait for react on small triangle to have position