ETHBTC LongClear price reaction at dynamic support level, could see price push to previous swing highs.
Ethbtclong

ETH break up - 0.618ETHBTC pair has broken up into the 0.618 fib area
I believe the next bull move we will see BTC lead with ETH following.
I make this assessment based on my previous analysis of BTC and BTC dominance
Ethereum still even if it is following, will position itself for a mighty bullrun
A golden cross is soon to come on this pair also. (in green box)

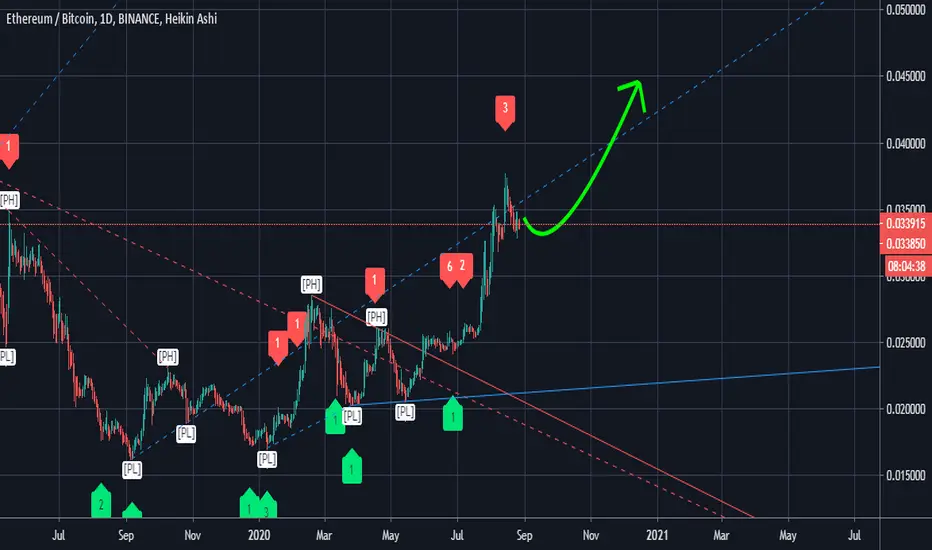
ETHBTC X3 POTENTIAL AFTER CORRECTION / ELLIOTT WAVE ANAYSISThis is how I expect price action of ETH BTC MID/LONG term
Feel free to add your opinion and keep supporting me with likes
Dont forget to follow me to see all of the updates and new analysis


Ethereum / Bitcoin Is strong, Could easily go for 0.055BTCClear Breakout and making higher highs. If Ethereum Starts moving it starts moving fast.

ETHBTC Weak uptrendWeak uptrend can be observed
recommend shorting on MA break
Would like to see this go back to 0.03

ETH.BTC (Y20.P3.E2).Short term.ABC moveHi All,
In the next 12 hours, I will feel confident in making a decision on bitcoin (after 3rd daily candle closing).
Hopefully it give a clear bullish or bearish sign > I will cover BTC in the next post.
I am leaning to a bearish candle as we have many things going against BTC now. I'll cover this in the next post.
If one is to look at ETH\BTC, it can be seen that we have some downward pressure emerging with bearish divergence as well.
Hence why ETH has been dropping against BTC and what I believe is that it hit its point 5 and now is doing the ABC correction as per the chart.
How this reflects or aligns with BTC doing the same is yet to be confirmed but it can be seen that on BTC, we had a doji and what looks like a BEARISH candle coming about in 11 hours.
Chart below.
For now, I see ETH hitting the 0.5 fib retracement on the chart and possibly deeper to 0.618.
Note on the daily the 21 and 34 EMA ribbon could be the area aligned with one of these fibs. for support
Meanwhile on the 4 hrly chart, we have the PHOEIX showing a turn as well as the WT and Stoch all hitting bottom, at a key fib level
We'll just have to wait and see.
Please give me a like or tick for this post
Regards,
S.Sari
BTC Daily chart
ETH.BTC > Note the divergence playing out.Blue EMA ribbon is the 21 and 34 on the daily
Big chart
Previous posts

ETHBTC Above 0.382Broke above key fib resistance
Move upwards is likely as this is now support. I think ETH is going to moon against BTC, further than it already has.

ETH.BTC (Y20.P3.E1).v4.Macro-structure.continuationHi All,
This is a continuation of the previous post, link below.
Just refined my targets and focus, fib levels, etc.
Still HODL'ing long (but trading it to gain more ETH or BTC)
FYI from time to time ETH is either more than 1/2 of my portfolio at any one time, ever since I acknowledged and made the posting about it.
(refer to the below links for the history and explanations).
The art to maximising your gains is knowing when to flip from BTC to ALTs, and vise versa. It is quite a difficult thing to do but if you do it, you should be able to gain much more BTC or ETH.
Cheers,
S.Sari
PREVIOUS POSTS>
JULY 9, 2020
JUNE 1, 2020
MAY 7, 2020
AS FOR OVERALL MACRO FORECAST - ONLY GUESSING with some logic

Ethereum chart patternsETHBTC has broken above the ascending broadening wedge very bullish
There may be a pullback once horizontal level is reached on the scallop on ETHUSD however the Gaussian channel looks quite bullish
Currently in a falling wedge ETHUSD 30 min
Other chart patterns listed..

ETHBTC look for a new impulse 🦐The market after the sharp move has been retracing and now price is just below a 4h structure.
If the market will break and close the candle above we can set a nice long order according with our strategy.
–––––
Follow the Shrimp 🦐
Here is the Plancton0618 technical analysis , please comment below if you have any question.
The ENTRY in the market will be taken only if the condition of Plancton0618 strategy will trigger.

Here I go long on Ethereum and ETH will go upHere I go long on Ethereum
and Ethereum will go up.
The price is testing the major resistance,
so now I go 5x long and the bullish breakout will start. And Ethereum will go up. See you up there

#ETH/BTC Fractals indicate a 38% rally!Hello guys welcome to this quick setup.
#ETHBTC just broke out of the resistance trendline and currently retesting the flipped Support.
Fractals showing last time it happened ETH rallied almost 38%. This resistance is 106 days long.
IMO this is a good time to add ETH to your portfolio.
I have bought a big bag and will be holding for for few months.
This isn't a short term setup, rather a long term setup.
I will buying every dip if it comes.
WHAT DO YOU THINK about this setup ?
Do share your views in the comment section. Feel free to like this update if you agree, your likes won't cost you anything but provides me a motivation to bring moe of such quality contents for free.
#PEACE

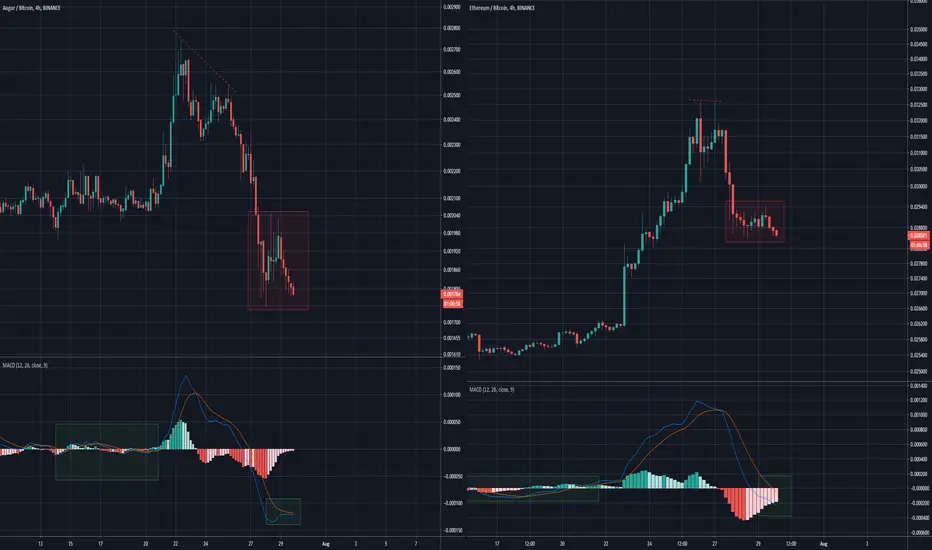
Similar structures REP and ETH-BTCSimilar chart pattern structures
Double top breakdown
I am long both ETH and REP
#ETHEREUM/USDT TECHNICAL ANALYSIS CHART & PRICE ACTION MOVES#ETHEREUM/USDT TECHNICAL ANALYSIS CHART & PRICE ACTION MOVES
PLS LIKE, SHARE & COMMENTS

ETH-BTC Horizontal structureHorzontal structure with a double bottom and double top can be seen on TOTAL2 and on ETH-BTC
I feel there will be more downsides for alts
As a return to the Gann line is necessary
ETH-BTC does look bullish after this small correction though.


ETH/BTC #rocketbombquickidea🔥Hello!🧡
Continue a new hashtag #rocketbombquickidea for you🔥🔥
If you like such format of my quick analyzes, support me with like. I'll try to find more opportunities for making 💰
Always in touch with you🧡
Sincerely Your Rocket Bomb🚀💣
PS Many alts give just wonderful profits.🔥🔥🔥

ETH-BTC DipperUsing aamonkey's indicator, really useful
Shows three dips under the MA cap line
The third and last dip has been a large one
I want a 1:1 ratio to BTC..

$ETHBTC breaks out! Huge Gann 50/50 target in sight.The ETHBTC pair made a significant move last night, after consolidating for 50+ days at and above a historically significant S/R level.
Price is at February 2020 resistance (~0.028).
If that breaks, expect to see a very big rally in this pair heading into October which is marked by the Gann 50/50 (half the rally taken back, in half the time #vibrationalsignature).
Defi has been a huge narrative this year as "new" layer-2 protocols like Aave, LEND, Kyber etc. run wild.
In this environment, it's just a matter of time until the hyper bullish narrative translates to price action on the Ethereum chart.
A break and close of the .028 BTC level on this chart should really get the party started.


ETH/USD (Bullish Daily Pattern?)ETH/USD
-price action has been making a series of Higher Lows
-and a clear flat area of resistance making an ascending triangle
-to confirm this pattern, we need to see a break above the area of resistance
-if that happens, buyers will start to jump in to move the price higher
-technically, bulls have the chance to win this game in my opinion
-but let us all wait for the confirmation before making a big decision :)
