ETHBTC Weekly Golden CrossETHBTC can be seen to have undergone a golden cross
and currently is breaking out bullishly of a level that has been previously been seen as a resistance in prior cycles
I am very bullish on ETHBTC
Ethbtclong


ETH/BTCvalhalaaaaaa. We must complete 5 at that stage we can have de tipical elliot correction or a parabolic movement having in account some fractals but 5 is the minimun objectiv. SEND IT

ETHBTCThe price came back again to touch line and pullback. on the other hand we have ETHUSDT its on the line and touch important area. i think its time to long ETH

ETH is going to 6k by Christmasnobody is selling it clearly. very nice price action technical levels rejections
nobody sell so only place to go is UP UP UP
bears just cannot hold the price under 4k

ETHBTCthe price had pullback on triangle, maybe it wants touch again or it can go up. this chart show us the power of ETH

ETH / BTC Key Level Alert!Still bullish on both BTC and ETH in fiat terms, but when it comes ETH/BTC I think Ethereum has much higher upside in growth.
ETH has been in a strong uptrend since the beginning of this year, and has just run up directly to the 50% level of the 2017's bull run -- low to high.
The 23.6 Fibonacci level proved to be a key resistance level in this year's bull run, which ETHBTC broke above and is now testing the next level.
NFA: This will most likely retest the .082 level a few times before we get any conclusion to this story, but I will be staying long ETH until further notice.
Cheers!

ETHBTC: Be Patient (for more gains)• A discussion with www.tradingview.com spurred me to think a bit deeper about ETHBTC.
• Fundamentally, Ethereum is fantastic tech, and it is eventual that ETH will flip BTC. The potential is there, but the real questions are if, when and how? And these are questions which TA can provide better answers.
• ETHBTC has been concurrently forming a cup&handle and a bullish pennant. Given the timing of this bullrun, Elliot Wave theory, the bullish pennant and ETH’s personality, it is eventual that she will break out and form a new ATH towards the end of this bullrun. The real question is if she will breakout sooner or later?
• This is an important question as swinging to ETH too early will incur huge opportunity costs, especially if one, like me, has been observing BTC.D and is riding on the alt season wave (very importantly this is a Wave C). Swinging to ETH late will also incur opportunity costs, but much less so as ETH tends to correct for a few days after a breakout.
• What then are the primary reasons for ETHBTC breaking out of the bullish pennant within these few days? That is primarily the fact that ETHBTC has been forming a double bottom within the pennant.
• However, if we were to apply Elliot Wave theory, we note that there are generally 2 intermediate higher lows in Wave 5. *Assuming* we saw the start of Wave 5 on 21 Jun’21, there should be one more higher low after the one on 11 Oct’21. This is not a double bottom; it is the much better triple bottom.
• If we were to examine previous ETHBTC peaks, we note that there are 5-7 robust and green candles prior to the peaks (5, Jun’17; 5, Jan’18; 7, May’21). We have had 4 weak green weekly candles since 11 Oct’21. *If* history is any indication, if ETHBTC were indeed peaking, then this would be a rather pathetic peak for ETH.
• If we were to look at ETHBTC’s parabolic move in Apr-May’21, we see that it is heralded by a crossing of the 8W SMA, 21W EMA and 20W SMA, with the lines coming out of the cross in this order (an order which is commonly found in the parabolic moves of most coins). The lines crossed at the 0.786 Fib level of the previous wave, as calculated from top to bottom. *If* history is any indication, ETHBTC still has some way to go as the lines have not crossed, and a similar 0.786 Fib level of 0.07655 has not yet been reached. The crossing of the current trendline (linking the peaks on Jan’18 and May’21) and the 0.786 Fib level is around 13 Dec’21.
• If we were to examine the previous bullrun, the RSI of the 2nd peak is in-between the 0.5 and 0.618 Fib level of the 1st peak. *If* history is any indication, ETHBTC’s RSI has still some way to go. Coincidentally, this is also the mid-channel of the ascending parallel channel that her RSI has been in since Sep’21. Also coincidentally, if we were to project RSI levels, *assuming* ETHBTC's weekly RSI grows at a constant pace, then this level will be reached after 13 Dec'21.
• Using the same Fib levels, *if* history is any indication, ETHBTC will peak in between 0.128 (2.618 Fib) and 0.155 (3.272 Fib).
- TLDR as follows: (1) There is a confluence of factors that suggests that ETHBTC might not break out so early; and (2) similarly, there is a confluence of factors that suggests that ETHBTC might start breaking out around 13 Dec’21.
- Assumptions : *we started Wave 5 on 21 Jun’21; *ETHBTC’s parabolic moves are indeed parabolic; *ETHBTC’s parabolic moves are similar to other coins and are preceded by the crossing of the specified lines; *the crossing of these lines happen at 0.786 of the previous Wave; *ETHBTC will peak when her weekly RSI is in between 66.4%-70.3%.
- This thesis is invalidated if **the bullish pennant fails; or ** ETHBTC breaks out above the bullish pennant and closes a weekly candle above the pennant before 13 Dec’21.
- Watch : ***Weekly RSI’s anticipated peak in between 66.4%-70.3%; and ***ETHBTC’s anticipated peak in between 0.128 and 0.155.

ETHBTC CallWe have made a great profit so far. Here is the new analysis of ETHBTC. Remember, December is going to be the month of ETHBTC and ETH in general. Whenever you are in profit, you can take it. I am a HODLER. HODL and Enjoy!

ETH/BTC. Popular chart right now for good reason #TraderSnekThinking this looks ready to pop. RSI has a target. Ascending triangle losing real estate. Looks good.

ETH/USDT 12 HOURS UPDATE Welcome to this quick update, everyone.
If you are reading my updates for the first time do follow me to get more complex charts in a very simplified way.
I also post altcoin setups on Spot, Margin, and Futures .
I have tried my best to bring the best possible outcome in this chart .
ETH / USDT support level are 4000$ and 3700$ but we can see some correction in shorter time frame but I thing the price cam pump from first support level.
What's your thought on this?
Do hit the like button if you like this update and share your views in the comment section.
Thank you
#PEACE

Ethereum Explosive Move On The Way!!Ethereum is looking absolutely amazing against Bitcoin right now and over the past while, we recently had a little accumulation phase where we saw sideways and slightly downwards movement where we built up momentum and now we are breaking out and starting to make a nice run upwards! All shown by my second scenario yellow path, personally think this is just the start for ETH and the altcoins as BTC dominance is looking very bearish! We are approaching resistance at 0.0769 where we could possibly face some trouble and then same thing slightly above around 0.0788, however i don't believe these levels pose a serious threat to ETH because of the huge amount of momentum i think is coming into the market soon. Look at the bollinger bands we are once again starting to climb that top band and for tonights daily close its looking like we are going to be closing directly ontop of here opening the door for an explosive move to the upside likely shredding through these resistance levels! The MACD, we just had a bullish cross a day ago and we are already seeing a very nice increase in our green bars on the histogram, this is exactly what we want to see and shows us the bullish momentum is growing! The MA's right away are giving good separation showing once again some big momentum coming and the more we see the blue move away from the orange the less likely we are to have a near term bearish cross, this also allows price action to have a couple red days for a cooloff without triggering a bear cross! Not the Squeeze momentum indicator, we are only on our first day of green bars on the histogram and this is a great sign that could showing us that a big run is on the way for ETH and the alts, since we are already significantly up on the month against BTC this is a very good sign considering we are only on the fist day of a possible bullish squeeze! The big part about this indicator is the squeeze release which is shown by the black crosses turning white, in this stage price action gets an explosive move to the upside and it is quite possible that we see an extended bull squeeze or even a double cycle bull squeeze! So stay tuned as i continue to update yall! Not financial advice just my opinion!

ETH/BTC About to Explode! Taking a look at Ethereum VS Bitcoin we have been following by second scenario path (yellow) pretty accurately actually and we are now facing a little resistance coming from the 0.0733 level but i don't think it is going to hold up, i expect us in the coming days to blast through here and continue to outperform BTC. The reason being is due to my outlook on the bearish looking BTC dominance and because over the past almost 3 weeks we have been seeing sideways movement which builds up momentum and i would say there has been a lot of accumulation going on this past 3 weeks, all bullish signs and definitely a momentum builder! If we do see a explosive breakthrough of the 0.0733 level we will be ending up right ontop of that top bollinger band which is a huge deal, we could see a huge run after grabbing onto this band and since we did see big sideways movement our BB's have been squeezing a bit ontop of price action which tells us an explosive move looms, doesn't indicate which direction but with everything i am seeing i think we can expect it to be to the upside! We also have the midline as strong support which is always good and adds a little cushion for Ethereum! The MACD looks super bullish we are just coming off of our red cycle with the Histogram declining day by day all the way to the current spot at the midline and now we await a breakthrough into green territory. we want to see an increase in each green bar showing strength on the bulls side, we are also awaiting a bullish cross which is plays into confirming this, we gotta see a good initial move with the blue MA taking off from the orange creating lots of separation lessening that chance of a near term bear cross. The Squeeze momentum indicator, we are currently still in a bearish stage but i don't think it is leading anywhere we are seeing flat and decreasing red bars which is a good sign for the bulls, it is highly likely at this point we will not see a bearish squeeze release, i believe the current red cycle is due to the slightly declining and sideways movement on price action. I think its just a matter of time before we see a push up into the bullish squeeze territory and honestly i think our current spot is very bullish and actually could be better that we are still in this red phase, reason being is that we could have an explosive move on the bollinger bands and the MACD pushing price action up high and then for our SMI we will only likely just be starting a bullish squeeze which could give us a sort of double pump effect, of course once we get to that point we have to see confirmation on the histogram with increasing green bars everyday. Not financial advice just my opinion!

Ethereum - bears back to the Cave for hibernation!!A high probability the ETH Bears will be sleeping for a bit longer. A very Bullish flag pattern in the ETH/BTC chart is getting close/ready to busting out/up. When it breaks it likely runs hard as this coincides with the cup and handle breakout retest ETH//USD CHART. link below. Target is ETH $6400

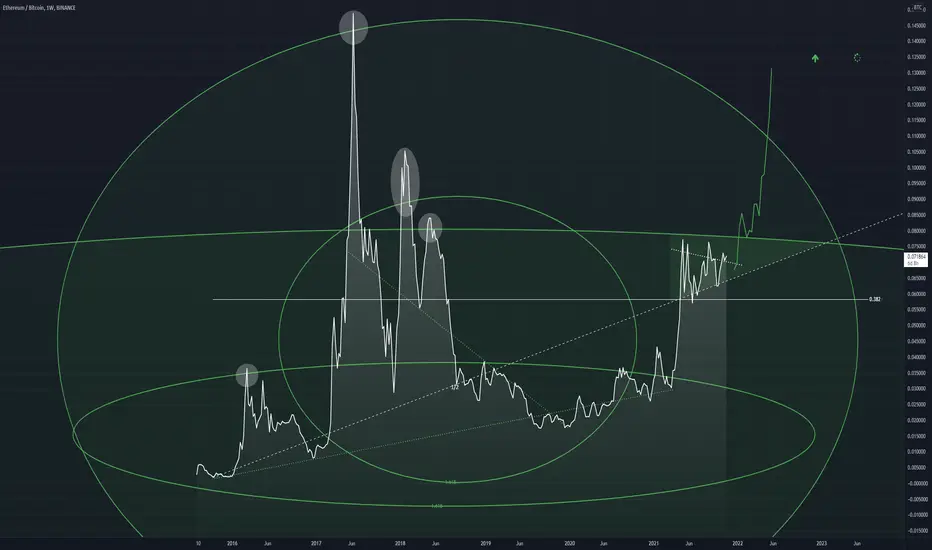
ETHBTC Detailed AnalysisOn this chart I have used Fibonacci Circles and the Gann fan tool to create trends and alignments that only are seen when using these tools
The key takeaway from this in short, is the trend alignment along the bear circle and the bull circle, placing the current bull formation directly above it
Also, using prior dates regarding bear run beginnings and bullruns we can hypothesise the end of the current run
Which I place around mid 2022
Obviously I believe ETHBTC will not just hit, but smash the ATH with force before this time

ETHBTC Fibonacci Circles, Bullflag? An idea for ETHBTC
showing the interactions between the fib circle levels established from the strongest down and up trend
interactions in white
It looks like price is forming a semi-bullflag looking structure after its first bull move in this cycle
More to come
Huge ETH run coming upLooking at ETHBTC, there seems to be a large cup and handle that has formed on the weekly chart. If we look closer at the 'handle' part, we can see another cup formation along with a decending wedge that has broken out

ETH/USDT long term out look.always zoom out!! Focus on the long term. or at least have a long-term bag on the side.
ETH/BTC is still on track as well! If ETH/BTC can reach 0.14 BTC think again about what would happen with USDT pair also keep in mind when BTC price goes higher
so does the sat value of ETH/BTC
Previous Update:
For in and out trader's
Target on the chart.
Invalidation point $2860
#bitcoin Long-term

Daily ETHBTC UpdateETH continues to hold the short term up trend against BTC. I've zoomed out on this chart to show what my long term thesis is for this relationship. We have been in a long consolidation pattern (triangle) which I'm viewing as a continuation pattern of the up trend for ETH over BTC. An approximate price target measure from the flag poll would see ETH being worth around 0.13BTC (almost double where we current sit). This just happens to also sit right on the 0.786 Fib line. Time will tell as we first need to see ETH break out of this consolidation to thee upside in a timely fashion.

ETH/BTC - Will Alt Season be coming on the next Month?when we look at ETH/BTC price, the price is still in consolidation, if the price breakout the Upper Resistance, we will see Alt Season, my prediction is about next month we will see Alt season

ROBOTRADER ETH Buy on Breakout, hold for 24hrs, 10% gainChart says it all. Robotrader immediate timeframe on breakout to ATH. Ride it hard for at least a quick 10% gain. Will check in what the charts tell us then. It might be violent. Please strap yourselves in. ETH inventory is decreasing at an alarming rate. Smelly men in with black hats and cigars will tempt you to redeem your ETH for incredible interest rates. Do like the whales, research cold storage and leave the SHARK TANK.

ETHBTC ETHEREUM BITCOIN BREAKOUT LONGLooking at the ETHBTC daily and looking at move to the top of the channel. We're long on ETH and waiting for the ETH BTC flip.
