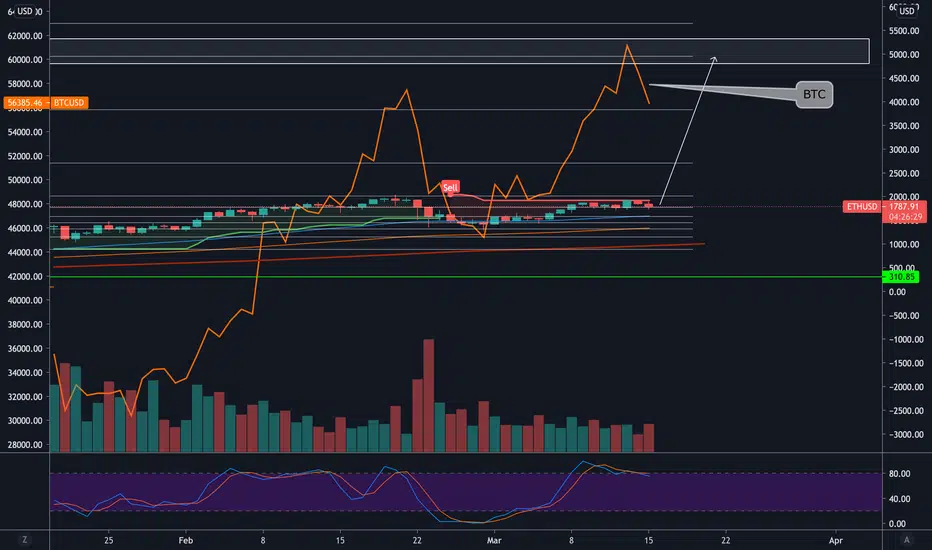
Ethbtclong
ETH / BTC Long: BTC Dominance Weekly Flipped = ETH / BTC WeeklyWhatever Bitcoin Dominance does, Ethereum will do the exact opposite, proven over time. At the top is Bitcoin Dominance weekly chart, flipped upside down. Below is ETH / BTC weekly chart, normal.
Should BTC Dominance break down here and complete its head and shoulders pattern, Ethereum / Bitcoin pair will complete its HSi and move up dramatically in the same way BTC.D moves down.
I'm bullish on ETH vs BTC, I think we'll reach at least a ratio of 0.05-0.06 BTC per ETH, with a possibility to re-visit our previous all-time high and potentially break through to 0.2.


Ethereum/Bitcoin ratio (Overview)Ethereum/Bitcoin it's bullish. that mean Ethereum it's grow up against Bitcoin in based in their Bitcoin value and calculations. Ethereum have a cost of 0.032 Bitcoin.
That mean, if you apply a strategy supposed to accumulate 10 Ethereum coins. Easily you can to get your first or 1 Bitcoin completely. Remember, 1 Bitcoin it's like a Gold . For that, I invest in Ethereum right now than Bitcoin as Ethereum it's going to run this trend. For that, one of my trading strategy it's reach 10 Ethereum coins as minimum. Actually, I have 4.23 Ethereum coins in what I earning in my trading that I have in hold.
Now, if Ethereum/Bitcoin goes to 0.1 Bitcoin, my 4.23 Ethereum coins it's can to have a value of 0.423 Bitcoin. But my goal it's to achieved 10 Ethereum coins as minimum when have a cost of 0.1 BTC, I can to get my first or 1 Bitcoin. Another strategy it's fund your Ethereum account with Ethereum assets in Simple FX and open up a Cardano contracts, whatever, I apply this strategy too and I have some Cardano contracts like 2,000 Cardano contracts funding in Ethereum to accumulate more Ethereum too as the same time Chainlink too in Simple FX. Guys, I invite you to check out the Simple FX, this it's an excellent cryptocurrency broker to trade crytpocurrencies or whole financial markets. For that, theres a lot strategy, the most common are hold Ethereum, accumulate Ethereum make trading or open up any cryptocurrency or Cardano contract to keep this positon to longer. I apply the both.
Now, based in my analysis, Ethereum/Bitcoin it's formed a shoulder head shoulder inverted, that mean a bullish pattern for the next altseason coming on in the next months. I have my 3 targets to hit in Ethereum/Bitcoin ratio that I show you.
For that, if you accumulate as minimum 10 Ethereum coins x 0.1 Bitcoin value = 1 Bitcoin (your first Bitcoin) if you apply this secret that few investor know, also I know it. Also, you can to open up some contract position to accumulate Ethereum whether in Cardano, Tezos, Eos, or any crytpocurrencies that you know, not just in Cardano, but if you want to apply, my recommendation it's choose 1 crypto what you want to open up contracts position and use a modered leveraged like 1:! or 1:5 my recommendation. And with this way, you can to accumulate Ethereum.
Also, I invite you to check out Ethereum fundamental analysis if you don't know what it's Ethereum.

Bullish Macd ETH/BTCSimple analysis.
If the MACD is crossing the signal in the next hour we enter a bullish trend.
The RSI is also low, which indicate an Oversold asset.
Even though the market as a whole is down, ETH might be a bit less bearish than Bitcoin which could lead to an increase in the price of ETH/BTC.

ETH-BTC Indicator Analysis - BullishA bullish case for ETH-BTC
Similarities in price action can be seen within the boxes
This is better shown on the log trend indicator
The 200MA is extremely flat, suggesting that it may rise rather than fall
Also the Ichimoku indicator shows that price has broken above the cloud, now the cloud will act as support for price rather than resistance, such as it did in the previous scenario (first box)
Attaching some other ETH-BTC ideas
I am long Ethereum..

ETHBTC Weekly Trend PredictionETHBTC seems to be be faithfully following this upward channel for the past year or so, moving up and down within it. Personally, I am expecting ETH to appreciate against BTC more in the short term for the next few weeks before going down again.


💡ETH: BUY Trade🚀🚀🚀🚀🚀🚀 #ALTSEASON2021 BCOZ of upcoming ETH hardfork and NFT Craze...this beast is going to pump hard
📈#ETHUSDT
➡️Entry: 1550$
🎯Target 1: 1790$
🎯Target 2: 1950$
🎯Target 3: 2150$

ETH BIG OPPORTUNITY, BUY THE DIP.Ethereum is testing the breakout from ATH, sell here is like selling Bitcoin after 20k break months ago.
This is going over $2000 USD very soon, meantime bitcoin creating a accumulation range at ATH.
I bought the dip!
indicator say buy, history has a great win rate.
Enjoy.

ETH / BTC - Logarithmic Triangle Breakout IdeaI've been pursuing a long trade target around 0.062 on ETH / BTC for a while now (TP 1 - range between 0.053-0.062).
Here's an alternative idea that shows potential for a second higher Target, based on breaking up out of a long-term symmetrical triangle on the logarithmic chart and re-testing the top of it.
This also shows we are in a parallel upward channel after having changed direction from a long term downtrend. We are nearing the bottom of that channel, as well as touching the midpoint of our daily high and low (yellow line in the middle of the two red lines), which would create a good turning point for our potential move up. That said, it's certainly possible we head a bit lower first and test the bottom of the channel again before making our move up and out.
Breaking below the channel or breaking back down into and/or especially below our triangle for any extended period of time invalidates this idea.
See previous related ideas linked below.

ETHBTC lows are in, targeting .05 /.085- 3 years of sideways price action on the ethbtc pair, breakout & pullback into monthly support
- ETH should outperform BTC next few months

ETH / BTC - Breakout Descending Triangle 4H & HSi on MonthlyEthereum / BTC pairing has been preparing for a possible major run up to at least 0.062 BTC from its current 0.031-32, similar to what we experienced towards the end of the 2017-18 market. The recent dip, really just a successful re-test of our 2018 high, has been providing the fuel needed to kick off that run.
On the 4H chart, there is potential to continue bullish movement and begin that run now, after having broken up out of a descending triangle.
I believe we are on a path towards 0.062 BTC, and that path may or may not show us one more dip after heading up and re-visiting a neck-line that is forming on a mini HSi (see green path drawing on 4H chart that shows us breaking above that neckline and heading back towards old highs). We also may not complete that pattern because the overall pattern is already bullish, so it's also possible we may just head up from here now.
Once that is complete, we should start to head up towards our more important neckline on the monthly and/or weekly HSi that is almost done forming.
This is an update on related chart ideas shown in the links below.
*** As always beware of BTC movement during this move and any other, as it will affect ETH's USD price regardless of what happens with its BTC value. ****

What's next for ETH-BTC ??ETH price will definitely be influenced by the overall crypto market. But, will it finally breakaway from it's correlation with the Bitcoin price? Looks like the bears are at an upper hand, as of now, in the bitcoin market. Will it take down the ETH too?
In the daily, we could see a bullish trend (blue). But, there's a very interesting channel in 4H (red) which intersects with the Yellow (0.03) and Orange (0.027) support lines which are strong so far. There's a possibility for a potential breakout. Bearish? OR Bullish?

ETH-BTC Wedge Breakdown Eventuality Using more indicators
We can see similar MACD formations between these two price points (purple ovals)
Also similar price formations, with a common bounce of a MA line between the two
Evidence suggests that this wedge that has formed bullishly will break down, bearishly
A head and shoulders can also be identified on the RSI weekly chart
^ above idea suggests continuation, scrap that, bearish action is favored
This is the wedge above that price is currently within

ETHBTC break of falling wedgeETH BTC has broken the falling wedge
Along with BTC dominance, dropping, there is lots of room for ETH to grow here

Still in the upward trend?Yellow - Daily support level
Orange - Weekly support level
RSI is also getting pretty low on the daily chart.
Could we see a bounce back at the 0.03 (yellow) Or the 0.027 (orange) levels?

Ethereum / Dollar & Ethereum / BitcoinHi, friends! Welcome on my Ethereum update!
On the 4h chart we can see a breakout of falling wedge (on eth/btc) and triangle (on eth/usd). It mean, that you can put some buy orders in green zone and will wait for a growth!
Happy trading 💋
Stay tuned by Rocket Bomb🚀💣

ETH-BTC Spotting the Bullish TransitionUsing a fib spiral and identifying the strongest trend on the chart we can discover where price reverted to a bullish state
Ethereum in my own opinion is ridiculously undervalued, any buy at this price is a steal
Keep adding while price is lower!

Eth time to shine!Hi fellows!
Straight to the first thing, I appreciate your likes, else why would I share?
IT'S The time to buy LTC with BTC
My first and immediate targets are:
TP1: 0.0352 BTC
TP2: 0.0403 BTC
TP3: 0.0524 BTC
TPx: 0.1087 BTC
Hope you all huge gains and don't over leverage, never ever, Good Luck!


#ETHBTC #1H #ETHERHi guys..its the latest analyze chart of ETHBTC in 1H time frame(folowers Requested analysis) .if you are interested any crypto that you want analyze with me and any questions please do not hesitate and comment below the chart!
if u like it press like-comment and folow me.thx

ETHBTC - Looking to POP for a Major ETH RALLY If you remember what happened after BTC popped in December, ETH will follow anyway.
I do believe the next move will be ETH, as I believe there will be a bounce around this area.
Probably the last dip before it popped for a major rally! :)
YOU THINK WHAT YOU THINK! Just HODL!
Stay safe and peace out.
