ENA/USDT Chart Analysis | Volatility Signals & Bullish TriggersENA/USDT Chart Analysis | Volatility Signals & Bullish Triggers
🔍 Let’s dive into the ENA/USDT perpetual contract and analyze recent price action, focusing on momentum shifts and key breakout scenarios.
⏳ Daily Overview
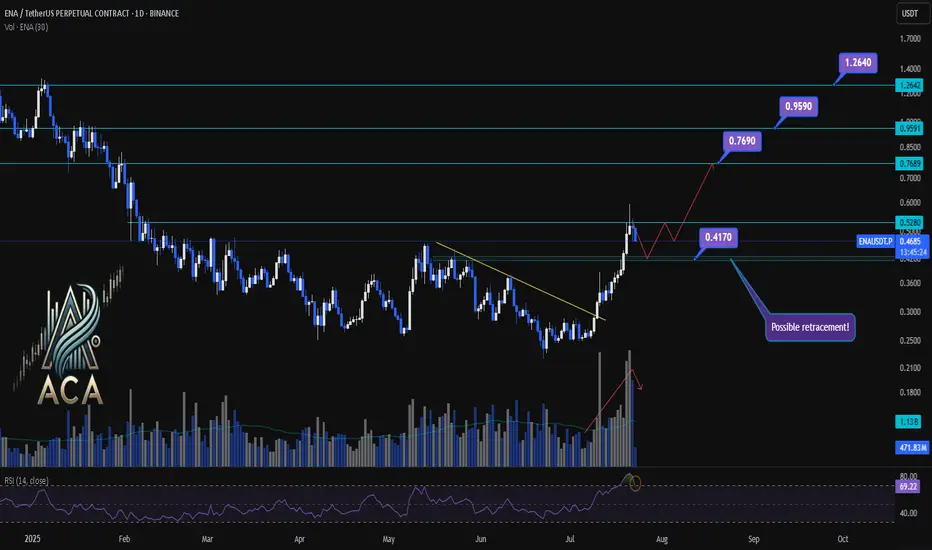
The daily chart shows that ENA recently reentered the overbought zone on the RSI, which can serve as a potential trigger for traders watching momentum shifts. Earlier, price action broke decisively above a long-standing descending trendline, resulting in a rapid, nearly 100% surge, a classic RR2 move off the trendline. This breakout coincided with a visible uptick in trading volume, confirming strong demand behind the move.
Now, during the ensuing rest or correction phase, trading volume is decreasing—often a constructive sign suggesting either profit-taking or a healthy pullback rather than panic selling.
🔺 Bullish Trigger & Setup:
- RSI Signal: Reentry into the RSI overbought zone is a potential long trigger, especially if confirmed by price action.
- Confirmation Level: A daily close with strong volume above $0.528 would add conviction to a bullish setup.
- Trendline Reference: The break above the recent trendline fueled the rapid advance, showing the importance of watching such key resistance levels.
📊 Key Targets (on further bullish confirmation):
- $0.769 — First upside resistance.
- $0.959 — Next bullish target.
- $1.264 — Extension target if momentum continues and broader market sentiment remains supportive.
🚨 Conclusion:
Eyes are on the $0.528 level—closing above it with volume, especially while RSI holds in the overbought zone, could provide the next strong entry signal. Current declining volume during pullbacks suggests this is likely a profit-taking phase or standard correction, not bearish capitulation. Keep monitoring RSI, volume profile, and price closes for the next actionable opportunity.
Ethena
21:1 risk-to-reward trade setup for EthenaIs it time for the bulls to push it higher? This setup offers a 21:1 risk-to-reward ratio with a target of 1.25.
Entry 0.32
Stop loss 0.25
Target 1.25
Phemex Analysis #91: Pro Tips for Trading Ethena (ENA)Launched in 2024, Ethena ( PHEMEX:ENAUSDT.P ) has swiftly risen as a powerful innovator in decentralized finance (DeFi). Its flagship synthetic dollar stablecoin, USDe, has achieved remarkable growth—ballooning from a mere $100 million supply at the beginning of 2024 to an impressive $5.8 billion, securing the third position among stablecoins by market capitalization. Concurrently, the ENA token itself delivered an astounding 550% price surge over the last five months, placing Ethena firmly among the top 10 DeFi protocols by total value locked (TVL), currently at approximately $5.8 billion.
In December 2024, Ethena expanded its stablecoin offerings by launching USDtb, a stablecoin backed 1:1 by cash and cash equivalents, with a remarkable 90% of reserves held in BlackRock’s USD Institutional Digital Liquidity Fund via Securitize. Ethena’s innovative USDe and the newly introduced USDtb represent crypto-native alternatives to established stablecoins such as USDT and USDC, promising censorship resistance and enhanced on-chain transparency.
Given USDtb's institutional-grade backing and advanced risk mitigation, it stands to substantially impact the broader stablecoin ecosystem, particularly as traditional USD-backed stablecoins face heightened regulatory scrutiny.
With Ethena’s significant innovations and market momentum in mind, let's carefully examine several potential price scenarios traders should be prepared for.
Possible Scenarios
1. Breakout Rise (Bullish Scenario)
Technical analysis indicates that ENA has formed a notable "triple bottom" around the $0.25 area, suggesting robust buying interest at this support level. If this support further solidifies, ENA could soon experience a bullish breakout above the immediate resistance at $0.37.
However, traders should exercise patience as the $0.50 zone represents strong resistance. It is expected that ENA’s price may fluctuate considerably before breaking confidently above this key psychological level.
Pro Tips:
Entry Strategy: Look to enter positions upon a confirmed breakout above $0.37, ideally with increasing trading volume.
Risk Management: Place stop-losses slightly below recent lows around $0.24–$0.25 to safeguard against false breakouts or reversals.
Profit-Taking: Consider partial profit-taking as the price approaches the critical resistance zone near $0.50.
2. Bearish Drop (Caution Scenario)
In a bearish scenario, potentially driven by broader negative market sentiment, ENA’s price could experience renewed downward pressure. A decisive, high-volume breakdown below the crucial support at $0.25 would strongly signal this bearish trend continuation.
Pro Tips:
Short Opportunities: Advanced traders might explore short-selling opportunities if ENA convincingly breaks below the $0.25 support.
Risk Mitigation: Set tight stop-losses to manage exposure, particularly if trading in volatile conditions.
3. Accumulation Phase (Neutral Scenario)
If the key $0.25 support successfully withstands selling pressure, Ethena’s price may enter a period of consolidation, bouncing between $0.25 (support) and $0.37 (resistance). Such consolidation typically reflects market indecision and accumulation before a substantial directional move.
Pro Tips:
Range Trading: Consider employing strategies such as grid trading to benefit from regular price oscillations within this trading range.
Observation and Patience: Stay observant for changes in volume or price momentum, as these could signal an imminent breakout or breakdown.
Conclusion
Ethena (ENA) is positioned at an intriguing crossroads, supported by impressive fundamentals, innovations, and growing market influence. Traders should closely monitor the outlined technical scenarios—recognizing key support and resistance levels, employing disciplined risk management, and capitalizing strategically based on evolving market conditions. With careful planning and timely execution, traders can confidently navigate Ethena’s current volatility and capture potential upside opportunities.
🔥 Tips:
Armed Your Trading Arsenal with advanced tools like multiple watchlists, basket orders, and real-time strategy adjustments at Phemex. Our USDT-based scaled orders give you precise control over your risk, while iceberg orders provide stealthy execution.
Disclaimer: This is NOT financial or investment advice. Please conduct your own research (DYOR). Phemex is not responsible, directly or indirectly, for any damage or loss incurred or claimed to be caused by or in association with the use of or reliance on any content, goods, or services mentioned in this article.

ENA - Already Over-Sold!Hello TradingView Family / Fellow Traders. This is Richard, also known as theSignalyst.
📈ENA has been overall bearish trading within the falling channel marked in red and it is currently retesting the lower bound of the channel.
Moreover, the blue zone is a strong demand.
🏹 Thus, the highlighted blue circle is a strong area to look for buy setups as it is the intersection of demand and lower red trendline acting as a non-horizontal support.
📚 As per my trading style:
As #ENA approaches the blue circle zone, I will be looking for bullish reversal setups (like a double bottom pattern, trendline break , and so on...)
📚 Always follow your trading plan regarding entry, risk management, and trade management.
Good luck!
All Strategies Are Good; If Managed Properly!
~Rich

ENAUSD: Strong bullish wave startingEthena is neutral on its 1D technical outlook (RSI = 52.271, MACD = 0.053, ADX = 32.166) as it's trading between the 1D MA200 and 1D MA50. The last time a rebound was supported by the 1D MA50, was in October 2024 and was the start of a Channel Up to the top of the Rectangle. Go long and TP = 1.3000.
## If you like our free content follow our profile to get more daily ideas. ##
## Comments and likes are greatly appreciated. ##

Ethena Short-Term Trade-Setup: Easy Profits 708%Ethena is now ready to produce a new advance, higher prices. The (1) shows a low before the last bullish jump. The (2) is a higher low which tends to lead to a higher high.
Looking at the Altcoins market, looking at Bitcoin and how strong it is; looking at the volume and candles, all is green.
ENAUSDT is ready to grow short-term, which means fast; the next advance is likely to start within days. The start will happen soon but the end is far away.
Look, the bottom has been forming for months. The bearish wave ended in March, then the market flush and now the recovery; prices are still low.
The thing is that once the action starts, there is no going back, it will happen so fast that by the time you look at the market, at the chart, everything will be 100% to 200% up. There will be more growth, but is better to get in early.
Thanks a lot for your continued support.
Buy and hold.
Namaste.

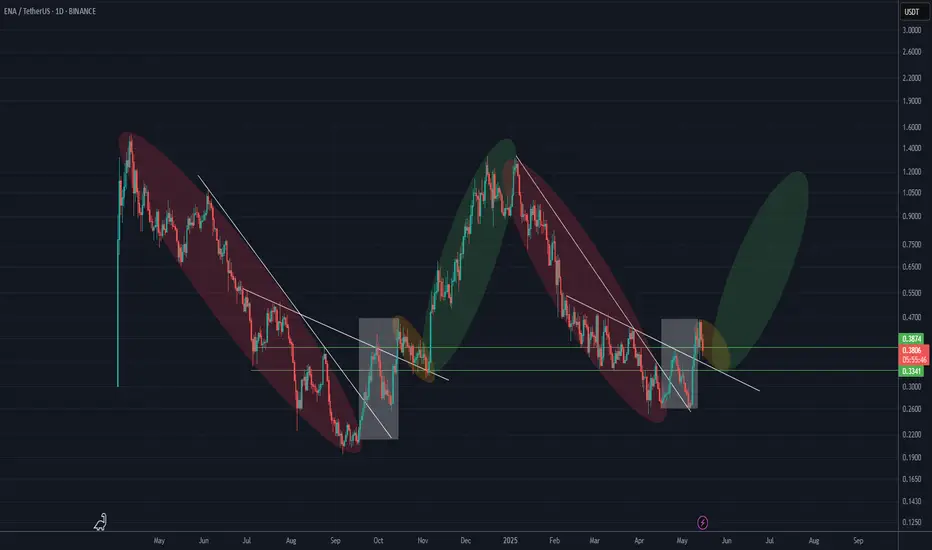
ENA is repeating a bullish fractal (1D)Look at the red, white, yellow, and green boxes in order, and then pay attention to the white trigger lines. You’ll notice that the previous phases | the end of the bearish trend (red box), followed by a bullish move for breakout (white box), then a pullback (yellow box), and finally the main bullish move (green box) | are now repeating.
Also, the price is currently sitting within the trading range marked by the two green lines, which is a key area. After the pullback is completed, a bullish wave is expected to begin, potentially reaching at least around the previous all-time high (ATH).
For risk management, please don't forget stop loss and capital management
Comment if you have any questions
Thank You
Breakout trading possible range: 0.4140-0.4424
Hello, traders.
If you "Follow", you can always get new information quickly.
Have a nice day today.
-------------------------------------
(ENAUSDT 1D chart)
The key is whether it can break through the 0.4140-0.4424 range and rise.
It is expected that breakout trading will be possible if the 0.4140-0.4424 range breaks through.
However, it is judged that it is possible to lead to additional rise only if it rises above 0.5082 at once and maintains the price.
Therefore, if breakout trading was not possible, trading is possible if support is confirmed near 0.4140-0.4424.
-
If it rises above 0.5082 and is supported, there is a possibility that it will rise significantly as there is no special resistance zone.
In other words, it seems possible that it will break through 0.7907 and 1.0382.
-
Thank you for reading to the end.
I hope you have a successful trade.
--------------------------------------------------
- Here is an explanation of the big picture.
I used TradingView's INDEX chart to check the entire range of BTC.
I rewrote it to update the previous chart while touching the Fibonacci ratio range of 1.902 (101875.70) ~ 2 (106275.10).
(Previous BTCUSD 12M chart)
Looking at the big picture, it seems that it has been maintaining an upward trend following a pattern since 2015.
That is, it is a pattern that maintains a 3-year uptrend and faces a 1-year downtrend.
Accordingly, the uptrend is expected to continue until 2025.
-
(Current BTCUSD 12M chart)
Based on the currently written Fibonacci ratio, it is displayed up to 3.618 (178910.15).
It is expected that it will not fall again below the Fibonacci ratio of 0.618 (44234.54).
(BTCUSDT 12M chart)
Based on the BTCUSDT chart, I think it is around 42283.58.
-
I will explain it again with the BTCUSD chart.
The Fibonacci ratio ranges marked in the green boxes, 1.902 (101875.70) ~ 2 (106275.10) and 3 (151166.97) ~ 3.14 (157451.83), are expected to be important support and resistance ranges.
In other words, it seems likely that they will act as volume profile ranges.
Therefore, in order to break through these ranges upward, I think the point to watch is whether they can receive support and rise near the Fibonacci ratios of 1.618 (89126.41) and 2.618 (134018.28).
Therefore, the maximum rising range in 2025 is expected to be the 3 (151166.97) ~ 3.14 (157451.83) range.
In order to do that, we need to see if it is supported and rises near 2.618 (134018.28).
If it falls after the bull market in 2025, we don't know how far it will fall, but based on the previous decline, we expect it to fall by about -60% to -70%.
Therefore, if it starts to fall near the Fibonacci ratio 3.14 (157451.83), it seems likely that it will fall to around Fibonacci 0.618 (44234.54).
I will explain more details when the bear market starts.
------------------------------------------------------

TradeCityPro | ENA: Expansion Pattern Near Critical Break Levels👋 Welcome to TradeCity Pro!
In this analysis, I want to review the ENA coin for you. The Ethena project is one of the DeFi projects in crypto that has attracted a lot of hype in this category.
💥 ENA coin, with a market cap of $1.7 billion, ranks 50th on CoinMarketCap.
📅 Daily Timeframe
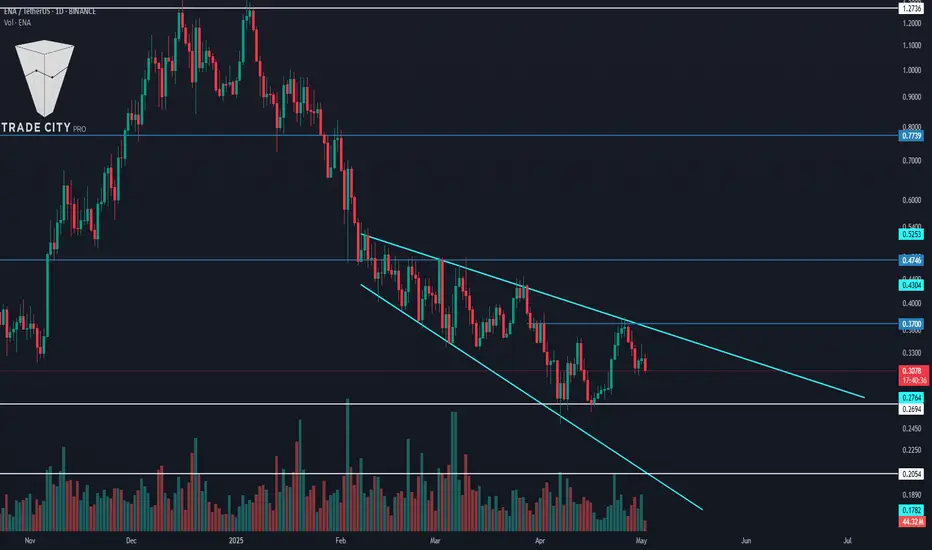
As you can see on the daily chart, there is an Expanding Triangle, and the price is fluctuating within this pattern.
📚 One key characteristic of an Expanding Triangle is that while the price is within the triangle, it tends not to respect static levels such as supports and resistances. Currently, the price is within the triangle and, as you can see, it doesn’t respond significantly to static zones.
📈 For this coin to become bullish, the triangle must break to the upside and the triangle trigger at 0.37 should be activated. In that case, the price can move upward and begin a bullish trend. Full confirmation of the bullish reversal will come with price stabilization above 0.4746.
✔️ For continued downward movement, the first trigger is the break of 0.2694. If you already hold this coin, you can use this level as a stop-loss — and once the price closes below it, you can trigger your stop-loss.
📊 For short positions, the break of 0.2694 is a valid trigger, but the issue is that it activates before the triangle breaks, and I personally prefer not to open a position within an Expanding Triangle — I’d rather wait and enter after it breaks.
🔽 Another trigger for a bearish move is the break of 0.2054. This is the main support for ENA, and if it breaks, the price will register a new All-Time Low.
📝 Final Thoughts
This analysis reflects our opinions and is not financial advice.
Share your thoughts in the comments, and don’t forget to share this analysis with your friends! ❤️
ENA is standing at a classic “make-or-break base-build” juncture
🕞 60-Second Read
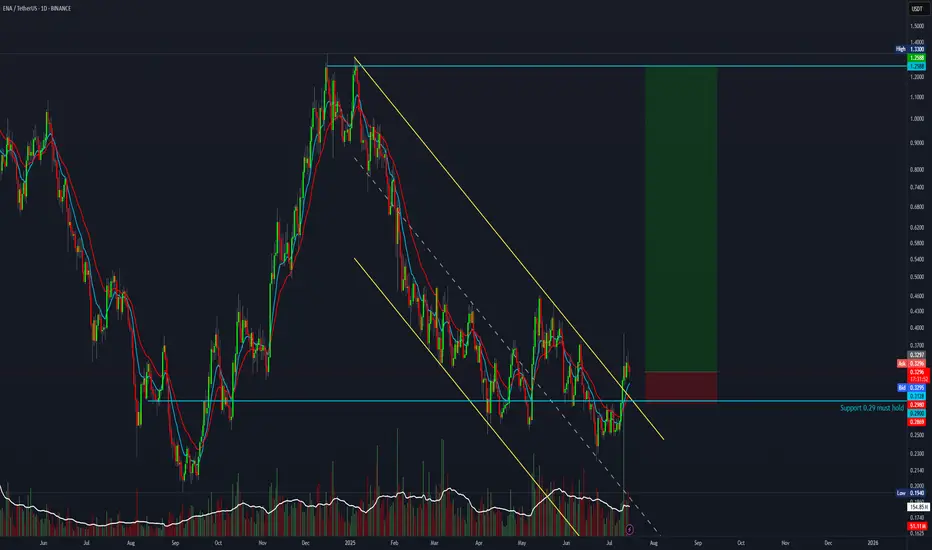
Trend on the 1-D chart is still structurally bearish , yet price (spot 0.350 USDT) just printed a higher-low off the April wick and reclaimed the mid-channel line. Two large upside voids are now in play.
Hot-Zone #1 – 0.292 (15 m imbalance): fresh demand, 17 % under spot.
Hot-Zone #2 – 0.496 (3 MP-High retest): range cap & first breaker, 42 % above.
Hot-Zone #3 – 0.836 → 0.892 (Feb pivot ↔ Yearly EC): macro supply shelf.
🎲 Probability Dashboard
HTF Trend & Structure – -2
Liquidity Map (voids above) – +1
Momentum (vector flips) – +1
Derivatives (funding ≈ flat) – 0
Net Score = 0
Bear / Neutral / Bull odds ≈ 40 % / 30 % / 30 %
📈 Trade Playbook
Strategy 1
1. Layered Limit Grid – Aggressive Counter-Trend Long
Entry layers (size %):
0.300 – 25 % of your allocated ENAUSDT size
0.280 – 35 %
0.260 – 25 %
0.240 – 15 %
SL = 0.215
TP ladder:
0.350 – 20 % off-load
0.496 – 25 %
0.836 – 30 %
1.040 – 25 %
Weighted R:R ≈ 7.3
Strategy 2
2. Layered Limit Grid – Conservative Breakout Long
Trigger: daily close > 0.496, then place grid orders.
Entry layers (size %):
0.510 – 40 %
0.570 – 30 %
0.650 – 20 %
0.836 – 10 %
SL = 0.440
TP ladder:
0.836 – 30 %
1.040 – 30 %
1.516 – 25 %
1.550 – 15 %
Weighted R:R ≈ 4.8
Setup Logic
Price reclaimed mid-channel but remains inside a 69 % upside void to 0.836.
Stacked un-retested highs (0.496 / 0.836 / 1.040) act as magnetic targets.
Yearly S1 (0.220) converges with vector zone support – ideal invalidation.
Risk Radar
Perp OI up 18 % WoW – a funding spike could squeeze late longs.
Two token unlocks (2 & 5 May) add ≥ 200 M ENA supply.
Macro: FOMC (1 May) & BTC flow volatility may spill into alts.
ENA must flip 0.496 to sprint through the 0.84-1.04 air-pocket; fail that and liquidity magnets at 0.30 → 0.22 take the wheel. Trade the grid – not the hopium.
(Not financial advice – always do your own research.)

ENA/USDT Analysis: A great opportunity for a speculative longThis asset has broken an important sell zone and consolidated above it, forming a strong volume zone below at $0.415-$0.408. On a retest of this zone, we will monitor the reaction. If confirmation appears, we open a long position with the potential to break above the $0.48 level.

Phemex Analysis #68: Is It A Good Time to Buy Ethena (ENA) Now?!Ethena has rapidly ascended in the decentralized finance (DeFi) sector, notably propelling its stablecoin, USDe, to become the world's largest by market capitalization within a year. In December 2024, Ethena Labs introduced USDtB, a stablecoin backed by BlackRock's tokenized money market fund, BUIDL, aimed at stabilizing USDe during bearish crypto market phases. More recently, a proposal has been put forward to integrate Ethereal, a decentralized exchange (DEX), into Ethena's reserve management system. This integration seeks to enhance trading capabilities for USDe and distribute governance tokens to ENA holders, further enriching the ecosystem.
Despite these fundamental advancements, ENA's price has experienced significant volatility. After reaching a high of $1.32, the token's value declined by approximately 75%, hitting a low of $0.33. However, the downward momentum has recently slowed, coinciding with a broader market recovery. This shift has led many to question whether now is an opportune time to invest in ENA, especially considering its substantial real-world developments.
Potential Scenarios
1. Continued Downtrend
If ENA fails to maintain current support levels at $0.316, it could test lower price points. Factors such as broader market downturns or negative investor sentiment could exacerbate this decline.
Pro Tips:
Short Positions: Experienced traders might consider short-selling strategies to capitalize on potential declines, especially if the price drops below $0.316 with high volume.
Buying at Support Levels: Long-term investors may consider accumulating ENA gradually near established support levels such as $0.26 and $0.20.
2. Consolidation Phase
ENA may enter a consolidation phase, trading within a defined range as the market seeks direction. This period of sideways movement could last until new catalysts emerge.
Pro Tips:
Range Trading: Identify key support ($0.316) and resistance levels ($0.48) to execute buy and sell orders effectively within the trading range.
Patience: Avoid overtrading during consolidation; wait for clear signals before making significant moves.
3. Bullish Reversal
Given ENA's recent positive developments and technical indicators, there is potential for a bullish reversal. Sustaining levels above recent resistance points could signal renewed investor confidence and an upward trend.
Pro Tips:
Breakout Entry: If the price breaks above the $0.40 resistance level with high volume, consider a long position with profit targets at $0.48, $0.54, and $0.70.
Accumulate Gradually: Consider dollar-cost averaging to build a position without exposing yourself to immediate market volatility.
Conclusion
Deciding to invest in ENA requires careful consideration of these scenarios. By employing strategic approaches tailored to each potential outcome, traders can better navigate the complexities of the cryptocurrency market. As always, thorough research and prudent risk management are essential when making investment decisions.
Tips:
🔥 Break free from "buy low, sell high"! Our new Pilot Contract empowers you to profit from ANY market direction on DEX coins with up to 3x leverage. Go long, go short, go further!
Check out Phemex - Pilot Contract today!
Disclaimer: This is NOT financial or investment advice. Please conduct your own research (DYOR). Phemex is not responsible, directly or indirectly, for any damage or loss incurred or claimed to be caused by or in association with the use of or reliance on any content, goods, or services mentioned in this article.

TradeCityPro | ENAUSDT Ready to Go!👋 Welcome to the TradeCityPro channel!
Let's go together to analyze and review one of my favorite coins and DeFi coins that we are likely to have and experience a movement in the coming days
🌐 Overview Bitcoin
Before starting the analysis, I want to remind you again that we moved the Bitcoin analysis section from the analysis section to a separate analysis at your request, so that we can discuss the status of Bitcoin in more detail every day and analyze its charts and dominances together.
This is the general analysis of Bitcoin dominance, which we promised you in the analysis to analyze separately and analyze it for you in longer time frames.
📊 Weekly Timeframe
On the weekly time frame, after we hit the 1.2788 level, which was our ATH, we got rejected from it and engulfed the previous weekly candle.
This was also an exit point or a take profit for us, and after this, it is very logical to withdraw some of our capital, and the reason is that the buyers could not do anything and push the price above this level!
📈 Daily Timeframe
On the daily time frame, but after we followed a parabolic move and its slope reached the end of the road, we were rejected by the important resistance of 1.2788
This rejection caused our parabolic move to end and after its failure, we went for an upward move again, but we were rejected by the resistance and went for the support of 0.7857
After the failure of this support and the pullback to it, we went for a rejection again from this resistance and are currently suffering between 0.3282 and 0.4833, with the difference that there is still more presence of sellers for this event
To buy at risk, you can also make a long position at risk after the level of 0.4833 because we can only be active in DeFi and take our coins to DeFi. Now that we are talking about DeFi, you can in this space Also set the liquidity range of the money and we can exit to activate the spot below the level of 0.3282!
📝 Final Thoughts
Stay calm, trade wisely, and let's capture the market's best opportunities!
This analysis reflects our opinions and is not financial advice.
Share your thoughts in the comments, and don’t forget to share this analysis with your friends! ❤️

Breaking: Ethena ($ENA) Surged 21% Today- What Next?The synthetic dollar protocol built on Ethereum that will provide a crypto-native solution for money that is not reliant on traditional banking system infrastructure, alongside a globally accessible dollar-denominated savings instrument native token Ethena ( MIL:ENA ), saw its price surge by a whooping 21% today amidst the three white crow pattern that appeared on the daily price chart hinting at increased buying pressure.
Ethena, weeks back was down losing almost half of value, bulls took advantage of the dip and capitalize on the oversold nature of MIL:ENA , presently placing the RSI at 58 which is neither overbought nor oversold but hints at a continuous buying pressure.
In the case of a market pull back, MIL:ENA might find support in the 78.6% fib retracement level, similarly, a break above the 1-month high could pave way for a new resistance point with massive influx of buyers in the long term.
Ethena Price Live Data
The live Ethena price today is $0.439498 USD with a 24-hour trading volume of $758,695,169 USD. We update our ENA to USD price in real-time. Ethena is up 16.02% in the last 24 hours, with a live market cap of $1,416,695,330 USD. It has a circulating supply of 3,223,437,500 ENA coins and the max. supply is not available.

Ethena Getting Closer To Bullish BreakoutThis is a short-term chart setup for Ethena (ENAUSDT). Support is being tested and this can lead to a higher low. A higher low can lead to the resumption of the bullish trend. The bullish trend started with the early September 2024 low.
Volume is good. The way the candles are becoming stronger as the action enters the support zone is also a bullish signal. The consolidation is similar to mid-October/late November 2024.
I am sure we will see a price advance next. This is short-term, but the action can easily go beyond all targets shown on the chart. There will be strong bullish action later this month and even stronger in April and May, that's why the targets will be easy to conquer.
We are witnessing the calm before a bullish storm. The bearish action is over and was really strong. ENAUSDT was bearish between December 2024 and March 2025. It is time for some change.
Thank you for reading.
Enjoy the profits as they come.
We are getting closer by the hour...
Namaste.

ENA/USDT LONG TERM🚀 Position: Long ENA/USDT
🎯 Strategy: Buy the Dip, Sell the Peak!
📈 Entry Targets:
Buy at 0.52 USDT (Initial Entry)
Accumulate at 0.39 USDT (Support Level)
💰 Take Profit Targets (Based on Fibonacci Levels):
TP1: 2.5 USDT
TP2: 3.88 USDT
TP3: 7.1 USDT Very risky... consider it as a top peak bonus.
🎢 Market Overview:
We aim to catch the retracement dip at strong support and ride the recovery towards Fibonacci extension levels.
⚠️ Risk Management:
Stop-Loss: Place your stop below 0.35 USDT for capital protection.
Adjust your take profit levels to secure gains as the price climbs.
📌 Reminder: "Buy the dip, sell the peak!" Stay disciplined and avoid chasing the pump.

ENAUSD: Buy signal at the bottom of the Megaphone.Ethena just turned neutral on its 1D technical outlook (RSI = 47.814, MACD = -0.029, ADX = 25.505), which considering the +8% rise today, signifies the enormous upside potential of this coin. This is expected as the long term pattern is a Bullish Megaphone nonetheless. Each of the two HH formations on its top, where on the 4.0 Fibonacci extension. Buy and target the 4.0 Fib (TP = 2.4000).
## If you like our free content follow our profile to get more daily ideas. ##
## Comments and likes are greatly appreciated. ##

Ethena Price Shows Bullish Momentum After Breaking ResistanceThe cryptocurrency market has its eyes on Ethena (ENA) as the token broke out above the critical $1 resistance level, signaling a bullish trend. We are predicting gains of up to 35%.
Breakout Above $1 Signals Bullish Sentiment
Ethena’s price has established a bullish trajectory after breaking through the crucial $1 resistance level. This breakout marks the end of a prolonged downtrend, during which the price bottomed out and began forming higher lows. Strong buying pressure accompanied the move, evident from large green candlesticks on the chart.
The $1 level, previously a significant resistance, has now transitioned into a robust support zone. We observe that the $0.97-$1.00 range is crucial for maintaining upward momentum. Holding above this level will be essential for MIL:ENA to sustain its bullish outlook.
Technical Outlook
As of this writing, MIL:ENA is up 5.68%, trading within a bullish horizon. The altcoin’s Relative Strength Index (RSI) sits at 54, indicating there is ample room for further upward movement. MIL:ENA has broken out of a presumed falling trend channel, reinforcing its bullish momentum.
The 1-month high of $1.32 serves as the next significant resistance point. If MIL:ENA can breach this level, it could pave the way for even greater gains. However, caution is warranted due to the broader market’s volatility, particularly Bitcoin’s recent price swings. Should CRYPTOCAP:BTC dip to $90,000 or the psychological $85,000 level, it could exert downward pressure on MIL:ENA , potentially causing a retreat to its 1-month low of $0.76.
Conclusion
Ethena’s breakout above $1 marks a pivotal moment for the token, signaling the potential for significant gains. With strong technical indicators and bullish market sentiment, MIL:ENA appears poised for a rally. However, traders should remain vigilant, considering the broader market’s influence on altcoin performance. As MIL:ENA continues to hold above $1, the coming days could bring substantial price action and opportunities for investors.

TradeCityPro | ENA : Navigating Parabolic Growth👋 Welcome to TradeCityPro!
In this analysis, I’m reviewing the ENA token, which belongs to the Ethena project operating within the Ethereum ecosystem. This project has successfully ranked among the top 10 DeFi projects by TVL.
📅 Daily Timeframe: Parabolic Trend and Reaction to Supply Zone
This token was recently launched and distributed its airdrop approximately 9 months ago to its users. After the airdrop, the project faced significant selling pressure, with its price reaching new historical lows of $0.2619 and then $0.2020.
👑 As Bitcoin began its bullish movement and broke its important 72k resistance, ENA also gained momentum, with increasing purchase volumes. It managed to fully recover and return to its ATH at $1.45.
📈 In this upward trend, ENA has undergone two re-accumulations, one under the $0.4234 resistance and the second under the $0.6844 resistance. These consolidation phases beneath critical zones help maintain a healthy uptrend without overly sharp corrections. However, the parabolic nature of the trend still suggests a higher risk of sharp retracements.
🔽 Currently, as the price has reached the ATH ceiling—a strong supply zone—the likelihood of corrections has increased.
📉 In case of a downward move:
The first support is the curved ascending trendline, acting as a dynamic support.
If the trendline is broken, the next support lies at $0.6844, which seems logical during a correction phase.
The final critical support is at $0.4234, and breaking it would signify the end of this bullish trend. The market would then require building a new structure for further momentum, either upward or downward.
🧩 From a technical perspective, volume is aligning well with price movements, confirming the upward trend. Meanwhile, the RSI above 50 indicates that corrections are less likely to lead to sharp declines unless the 50 level is breached.
🚀 If the ATH at $1.45 is broken, the next targets would be $2, $2.5, and $3.2, based on 6-month pivot points. Monitoring these levels closely for potential trend reversals is advisable.
⏳ 4-Hour Timeframe: Futures Triggers
In this timeframe, the focus is on specifying futures triggers for both long and short positions.
🔼 The market has managed to recover entirely from its correction and is among the few coins to successfully engulf its entire pullback.
📈 Breaking the $1.2423 resistance could confirm a long setup. However, trading in the $1.2423–$1.45 supply zone will be challenging due to its significant resistance.
📉 It’s recommended to wait until the $0.8550 level is breached for a short position. This would signal a trend reversal, providing a safer entry for shorts.
Currently, given the strong resistance, it’s better to avoid opening short positions without a confirmed trigger.
📝 Final Thoughts
This analysis reflects our opinions and is not financial advice.
Share your thoughts in the comments, and don’t forget to share this analysis with your friends! ❤️ above.

$ ENA| How do I expect to see Ethena in coming weeksBINANCE:ENAUSDT :
Here with another speculation about crypto assets. This time Ethena token with ENA ticker. Let’s take a look at the project’s information:
Ethena is a synthetic dollar protocol built on Ethereum that will provide a crypto-native solution for money that is not reliant on traditional banking system infrastructure, alongside a globally accessible dollar-denominated savings instrument — the 'Internet Bond'.
$ ENA
Market Cap: $ 3.61 B
Market Cap Rank: #46
Market Price: $ 1.23
ATH: $ 1.52 (-19.73%)
ATL: $ 0.19 (+523%)
Source: Coin Market Cap
Besides, Trump's World Liberty project spent 500K CRYPTOCAP:USDC to buy 509,955 $ENA. Not much investment but shows that Ethena is in spotlight. That’s what we need for now from Ethena project. Okay then, let’s see what we have on the chart.
- W1:
Trend:
Price has been in an uptrend for 100 days. Price has broken 3 major resistances in this last week’s uptrend. The first resistance level was $ 0.5 smashed on the 7th. Nov. Price was rejected from another resistance and came back for an S/R test on that $ 0.5. With $ 0.5 proven as support, the price attempted to break another resistance at $0.68. Broken this level too and at its 3rd attempt. $0.77 broken easily and even a major supply of $ 1.05 ~ $ 1.15 was absorbed recently. This is the last known resistance level and will probably be touched again for the S/R test. I’ve marked important levels for a better understanding.
MAs:
On a daily time frame, we can see the golden cross and the Price move above all key MAs. This is bullish as long as it keeps this setup.
RSI:
on a daily time frame, RSI doesn’t look so good. Already in an overbought zone and a bearish divergence is on the chart. This means the price will more likely have a pullback or sideway move before any continuation. In the weekly time frame, we have RSI on the edge of the overbought zone but still have room to develop. This means, I expect a small pullback within the current week and then a bullish continuation to the new ATH.
Stoch. RSI:
Stochastic RSI is in good shape in the daily time frame. Bullish crossover in D1 and value is around 56 which shows strong momentum.
Volume: Volume increased in the daily time frame to validate the breakout from resistance levels.
Supports:
$ 1.00 ~ $ 1.14 broken resistance level
$ 0.95 Ma20 in D1
$ 0.67 Ma50 in D1 – Broken resistance level
$ 0.48 - $ 0.52 Demand zone- Ma200 in D1
Resistances:
$ 1.5 D1 ATH
Fibo extension levels
Conclusion:
All these opinions are mine and can be wrong, so please DYOR.
This coin has strong fundamental and technical advantages
My strategy goes as below:
🛒 Pair: ENA/ USDT 🛒
👑 Bitcharge 👑
🕰 16/12/2024 🕰
POSITION: 🟢"Buy"🟢
2 % of capital
🛒 Buy: $ 1.05 – $ 1.15 🛒
👉Sell Targets👈
🎯TP1: $ 1.30 🥉
🎯TP2: $ 1.45 🥈
🎯TP3: $ 1.65 🥇
🎯TP4: $ 1.85 🚁
🎯TP5: $ 2.05 ✈️
🎯TP6: $ 2.30 🚀
🎯TP7: $ 2.50 🛰
🎯TP8: $ 2.80 🛰
🎯TP9: $ 3.20 ✨
🎯TP10: $ 3.50 ⭐️
⛔️ SL: $ 0.80 ⛔️ by closing D1 Below

Ethena (ENA) leads market ahead of USDtb stablecoin launch ENA, the native token of Ethena — an Ethereum-based synthetic dollar protocol — has experienced a 13% surge over the past 24 hours. This rally comes as the market awaits the launch of Ethena’s new stablecoin product USDtb, on December 16.
As ENA witnesses a rally in demand, the altcoin is poised to reclaim its all-time high of $1.52, which was last recorded in April.
ENA’s positive Chaikin Money Flow (CMF) confirms the high demand for the altcoin. At press time, the indicator’s value is 0.14.
However, if ENA traders start selling to lock in profits, it could create downward pressure on the altcoin’s price. A decline to $1.01 may occur, and if this support level fails to hold, the ENA token price could potentially drop further to $0.85.

2024 Overview - Whats Looking Big for 2025The crypto market is maturing to the point of clear winners and losers within the application space. The chain level has proven in 2024 not to be decided with the consistent growth of SOL Within the different chains though we have still seen winners seperately themselves from the losers.
The winning applications? Usually theyve been in three fields. Validating. Swapping. Lending. Now there are emerging winners appearing in the fields of RWA. Yield. Whatever Ethena is. These fields are distancing themselves from the losers. The zombie fields. The seed investment fields. The metaverses. The gaming. The NFTs.
The losing fields might have volatile token performance and they could definitely see strength start in 2025.. but those applications were big losers in 2024. Surprise, surprise... their token performance wasnt great. It may have something to do with the fact no one uses the application.
2025 I believe we will see those that were leading applications and leading token performers in 2024 continue to be the leaders of 2025.
EDIT - I forgot to mention in the video my favourite growth chain of SUI. SUI has been a relative leader both technically and fundamentally.

Is #ENAUSDT Ready to Rally or Fall Further? Key Levels to Watch Yello, Paradisers! Is #ENAUSDT ready to make a massive bullish move and slide down further? Let's discuss #Ethena analysis and see what's happening:
💎#ENA is showing promising signs of a bullish continuation and holding steady at the crucial support zone between $0.254 and $0.300. We've been closely watching its journey within a Descending Broadening Wedge pattern, and now, #Ethena looks poised to test the descending resistance line—a potential turning point.
💎Volume has remained robust, and with #ENA marking its all-time low just one month ago, we may be setting up for a strong rebound. As the saying goes, "Once we hit bottom, the only place to go is up," and this could be unfolding right now.
💎If #ENAUSDT can maintain strength at its current level, we could be on the verge of a significant rally. A breakout above the $0.470 minor resistance zone would open the path to higher targets and potentially even new highs.
💎However, if momentum weakens around this support zone, a pullback toward the lower demand area near $0.204 could be in store. A daily close below this demand zone would invalidate our bullish outlook and could signal more downside risk.
Stay vigilant, Paradisers, and closely monitor #ENA's price action.
MyCryptoParadise
iFeel the success🌴
