⚖️Does Ethereum repeat the sixth movement(6)❗️❓⚖️Today let's take a closer look at Ethereum in the weekly time frame. Do you see similar movements❗️❓
As you know, the price movement depends to some extent on the previous movements, so if we want to compare the previous 6 movements of Ethereum in the first correction phase with the current 6 movements, We should look for evidence and similar movements.🔎🔍
⚖️ Similar movements ⚖️:
The movements of Ethereum microwaves in the correction phases are almost similar to each other.
The third movement (3) in both moves are 50% Fibonacci movement 1-2.
The fourth movement (4) in both moves are 78.8%-61.8% Fibonacci movement 2-3.
The fifth movement (5) in both moves are 78.8% Fibonacci movement 3-4.
The fifth movement (5) in both moves are 61.8% Fibonacci(Extension) movements 2-3-4.
The angles of both support lines are almost equal.
There seems to be good evidence that these two corrective moves are very similar, so we can expect the sixth movement (6) to be perhaps a bit slower than the first corrective movement (the sixth movement (6) was sharper under the influence of 🦠Covid🦠).
Ethereum Analyze ( ETHUSD ), Weekly time frame ⏰.
Do not forget to put Stop loss for your positions (For every position you want to open).
Please follow your strategy, this is just my Idea, and I will be glad to see your ideas in this post.
Please do not forget the ✅' like '✅ button 🙏😊 & Share it with your friends; thanks, and Trade safe.
Ether

ETHUSDT Ready To Takeoff!ETHUSDT Technical analysis update.
ETH currently trading at $1680, ETH formed a triangle pattern in the day chart if the price breaks the triangle resistance line then we can expect a good up move. before the breakout, we can expect a consolation between 1600 to 1700 level.
Buy zone: Below $1690
Stop loss : $1560
Take Profit 1 : $1780
Take Profit 2 : $1940
Take Profit 3 : $2161
Take Profit 4 : $2600
Max leverage: 2x
Always keep stop loss

ETH/USD Daily Levels - March 10th, 2023Hey traders,
Quick update from my previous Ethereum read, it looks like the move is playing out exactly how we expected it to and we are on target for $1,287, or the bottom of the accumulation zone marked in green on my chart.
We saw the short opportunity at $1,645 and then now we’re seeing the quick drawdown out of the distribution zone and back to the accumulation zone.
We might see a wick down to $1,110 because that’s where this long term trendline is and would be the lowest point we could touch before we create a higher low. Anyways, really expecting $1,287 to hit, at this point we’ve been calling $1,347 and that’s a given. $1,347 will hit almost for certain, just patiently waiting on my $1,287 bids at this point. However, do be cautious as we could reach down into some of the $1100-$1200 gap territories.
All the best!

Can Ethereum pass the Price Reversal Zone(PRZ)❗️❓Currently, Ethereum is moving in the Price Reversal Zone (PRZ), so it is better to get to know the quality and power of PRZ to answer the question of the title of this post.
What factors does the PRZ for Ethereum include in the daily time frame❓ (The higher the number of overlapping factors ⏩⏩⏩The strength and quality of the PRZ or resistance/support zone is greater.)
⚫️Most important downtrend line
🟡Cluster of Fibonacci($1,632-$1,589)
🔴Upper line of descending channel
🔵50 day Simple Moving Average(50_SMA)
🟣Monthly Pivot Point($1,603.38)
According to the above factors, PRZ has an huge strength, so, I expect that Ethereum will not be able to break PRZ in the first attempt and that Ethereum will decrease to the middle line of the descending channel and the uptrend line in the coming days or even hours.
Ethereum Analyze ( ETHUSDT ), Daily time frame ⏰.
Do not forget to put Stop loss for your positions (For every position that you want to open).
Please follow your strategy, this is just my Idea, and I will be glad to see your ideas in this post.
Please do not forget the ✅' like '✅ button 🙏😊 & Share it with your friends; thanks, and Trade safe.

ETH will catch up soon. When to buy? (NEW)ETH has been holding much better than bitcoin. It has also bounced much more than BTC.
We expect that ETH will ´catch up´ and it will drop more if the sentiment overall remains bearish.
It wouldn´t be surprising if we see a strong FUD regarding ETH which would cause a stronger price drop.
ETH real capitulation most likely would cause a huge dump in the whole altcoin market.
In the chart you can see (green horizontal trendlines) where are good levels for a dollar cost averaging (for a long term investment or playing a bounce) .
Many altcoins will die and will never come back, but we believe that despite a huge drop , ETH will survive and will perform very well in the next bull market.
Good luck.

Ethereum ETH Price Targets after the FSB meetingThe Finance Stability Board said today that many stablecoins won`t meet the requirements stipulated in its recommendations for cryptocurrency asset regulation.
This could have have ripple effects in the entire crypto industry!
My price targets for Ethereum ETH are:
ETH/USDT short
Entry Range: $1650 - 1750
Take Profit 1: $1550
Take Profit 2: $1490
Take Profit 3: $1350
Stop Loss: $1890

Summary of BTC in 4Has you see it's ranging (accumulation)
overlap with OB4
Need to wait for good entry on 65% long

ETH Potential Price RecoveryPotential ETH Recovery idealized through previous pattern similarity illustrated on logarithmic charts. Most accurate on 1W+ timeframes. Correlates with possible BTC recovery.

Ethereum - similar to BTC setup....Though much greater upside potential in the long run. The target range for wave (C) of circle 4 is 400-600. The first target for circle wave 5 is 8k, 1.618 extension resides at 55k! Wouldn't be surprised if it reaches that level.

$ETH 27022023 going short ideaGoing Short on $ETH with LH and LL pattern in formation on both 1Hour and 4Hour Time frames;
EP: 1635.10
SL: 1681.67
TP1: 1584.77
RRR: 1.12

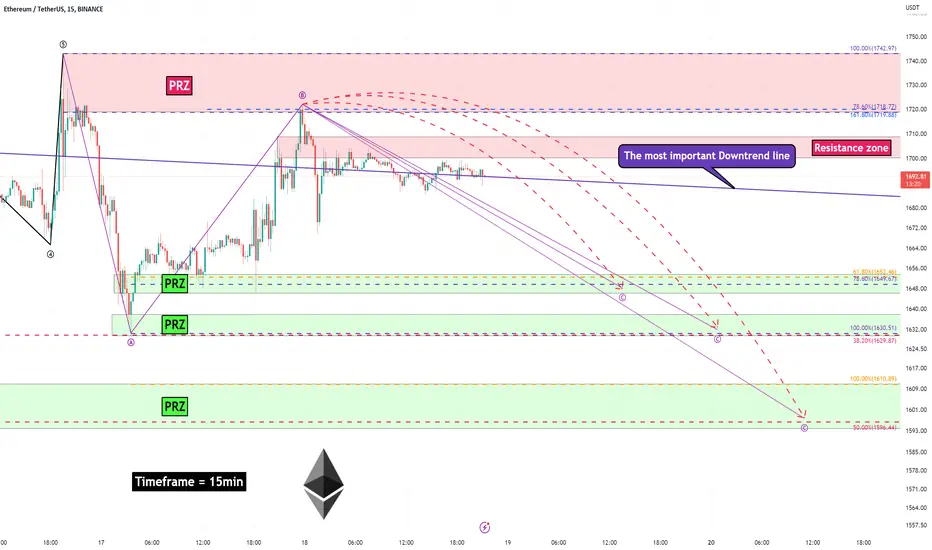
Ethereum Analyze (Short Term,15-minute Time Frame,02/18/2023)!!!Ethereum is moving in near its important downtrend line, at the same time, it seems to have found the end of wave B near this line and PRZ.
I expect Ethereum to drop at least until the first PRZ, although further price drops are possible.
Ethereum Analyze ( ETHUSDT), 15-minute time frame ⏰.
Do not forget to put Stop loss for your positions (For every position that you want to open).
Please follow your strategy, this is just my Idea, and I will be glad to see your ideas in this post.
Please do not forget the ✅' like '✅ button 🙏😊 & Share it with your friends; thanks, and Trade safe.
Ethereum | Seems like Ready for Bullish Rally..!!#ETH is Getting Ready for Massive Bullish Rally. 📈
A Decisive Daily Candle close above the Major Descending Trendline will signal a clear Breakout and potentially initiate a strong Bullish Trend.
Once Daily Candle Close above the Major Trendline, #Altseason2023 will Officially Start. ✍️
Please like the idea for Support & Subscribe for More ideas like this and share your ideas and charts in Comments Section..!!
Thanks for Your Love & Support..!!

Ethereum is almost ready to dropWe seeing good price action on HTF but we must wait for confirmations on LTF for us to even consider getting involved with this pair
4h outlook

Ethereum ETH price wondering where to go nextThe ETHUSDT price has begun its correction, along with the entire crypto market. But in fact, it has held up better than the BTCUSDT price, and has not yet updated the lows of late January.
By the way, at the beginning of the week, we published a fractal on the BTCUSDT chart, and it is working out quite well.
Now the whole world is waiting for February 14: couples in love to celebrate Valentine's Day, and traders in financial assets to wait for the US CPI to be released.
If the inflation rate is lower than expected, it is very likely that the growth trend will continue.
If the inflation rate is equal to or higher than forecast, financial markets and especially cryptocurrencies will continue to correct downward.
For the ETH price, the ideal correction for continued growth is in the range of $1400-1420
Critical correction to $1340, below that, there could be trouble.
What are your expectations for the further movement of the ETHUSD price? Write in the comments
_____________________
Did you like our analysis? Leave a comment, like, and follow to get more

Ethereum ETH Price targets if SEC will ban Crypto StakingCoinbase CEO says he heard rumors the SEC wants to ban crypto staking.
Already crypto exchange Kraken shuts down crypto-staking.
This will have ripple effects in the entire industry!
My price targets for Ethereum ETH are:
ETH/USDT short
Entry Range: $1500 - 1600
Take Profit 1: $1450
Take Profit 2: $1330
Take Profit 3: $1220
Stop Loss: $1720

ETH/USD Daily Levels — February 1st, 2023Looking at the Daily TF of Ethereum, we can see a very similar structure to Bitcoin, but a little more manipulated in the price action. The manipulation zone is a bit bigger and the accumulation zone is a bit smaller, where as Bitcoin, the move was made as clear as day.
Usually, I use Bitcoin to chart out the flows for the market and trade on Ethereum to juice higher returns for my portfolio.
Anyways, moving onto the chart patterns, we played this move upwards from $1,161 to selling at our distrubtion level at ~$1640. From here, i’ve been out of the market and waiting patiently for a new entry. I genuinely thought we’d come back down and retest the top of the accumulation zone (even if it were a scam wick), however, the market makers have a different game plan.
We’re still chilling in the distribution zone after the FOMC today and they’re printing a buy side sweep to suck in retail liquidity before pushing the price down. I wouldn’t be surprised if the top of the distribution zone hit as many people still need to offload their positions and are greedy, however, this buy side sweep we just printed on the daily looks very convincing.
It’s also something to note that the Shanghai testnet is dropping and the Ethereum team usually drops the new network upgrade at local tops in the market.
I believe that we should close out this distribution zone herer soon and retest the accumulation zone. Unlike Bitcoin, I don’t believe we’ll see the start of the yearly candle retest unless it’s a quick wick down as it’ll get bought up relatively fast, similar to what we saw in the FTX meltdown in November of last year.
This move we made completely reversed the entire FTX meltdown and we’ve returned to the mean as of now. However, we do need to retest the start of the uptrend or at least somewhere near the start of the uptrend and that would send the price of Ethereum down to $1287 - $1347, forming a higher low, before continuing it’s move upwards.
It’s going to be a while before we see all time highs again, most likely around the Bitcoin halving event, the same as the previous two cycles. In the meantime, we can continue milking the market and stacking more trading profits into our long term Ethereum holdings before the next bull market cycle.

ETH USDT BINANCEHeading toward large resistance in uptrend (white line).
Sell orders around 2k and could bleed down imo.
RSI near support.
But will need a push because 50 MA crossed below 100 MA.
Might bounce before continuing the uptrend tho.
This isn't financial advice and you should always DYOR.
Thanks for following.
Like, comment, share any ideas you have as well.

2 overlapping 4hr chart bullish patterns on ethusdWe can see a bit of a pump in price action on the 4hr chart for ether here. It appears to be breaking above the neckline of an inverse head and shoulders pattern(in yellow). Of course many times these patterns do not trigger their breakout on the first break above the neckline but rather dip back below it and wait until the 2nd or sometimes even 3rd break back above the neckline before confirming the breakout. Always a chance though this one could confirm on the first candle break above the neckline so its always wise to prepare for all possibilities. If it does indeed trigger the breakout of this 4hr inverse h&s pattern, the measured move target should carry price action above the neckline of a slightly larger double bottom pattern (in green). We’re this to happen, it could very well then flip that green neckline from resistance to support upon retesting it, thus triggering a double bottom breakout next which would take us to the green price target. Of course it could also trigger the breakout of the double bottom without retesting the green neckline, or it could break back below the green neckline and not actually trigger the double bottom breakout until the 2nd or even 3rd time above the green neckline (just like with the yellow inv h&s neckline)If I remember to be open to all of these possibilities, await for confirmation, and then make my move I’m sure I will play these 2 patterns wisely. We must also remember that a fakeout of the double bottom pattern or both patterns is also a possibility as well. The resistances/supports, price candles, and volume candles, should clue us into into which one of these possibilities will be the ultimate outcome soon enough *not financial advice*

ETHUSDT Symmetric Triangle!ETHUSDT Technical analysis update
Buy zone: Below $1675
Stop loss: $1625
Take Profit 1 : $1760
Take Profit 2 : $1840
Take Profit 3 : $1945
Always keep stop loss
Thanks
Hexa

#Ethereum - Thoughts out loud #7Good afternoon, dear colleagues!
I am glad to welcome everyone who wants to familiarize themselves with my vision of the current situation on this instrument.
Is such a deal possible, what do you think? Leave your opinion in the comments.
Dear colleagues, I sincerely thank you all for your attention and wish you all success!
And remember one thing:
"sometimes you win, sometimes you learn".

ETH Weekly Forecast 30 Jan - 3 Feb 2023 ETH Weekly Forecast 30 Jan - 3 Feb 2023
Based on the data from DVOL, we can see that currently the IV for this week is at 58.03%, down from 64.38% last week.
This can be translated in +/- 8.05% movement from the open of the candle, which makes the next top/bot channel
TOP: 1777
BOT: 1513
The probability to break this channel(aka the close of the weekly is going to end up either above/below this channel) is at 65%(60% since 2022)
From the technical rating analysis point of view we can deduct the next information:
Currently there is a :
63% to touch the previous weekly high
25% to touch the previous weekly low
At the same time if we are going to take a look at the moving average rating for different timeframes we can see :
4H Timeframe: -40% Bearish Trend
D Timeframe: +66% Bullish Trend
W Timeframe: -26% Bearish Trend
Lastly on average, based on the current percentile, we can expect that our asset is going to move:
9.2% from the open candle for the bullish scenario
10.5% from the open candle for the bearish scenario

Ethereum Long Play Watching a move on Ethereum like this ($ETH) -
- break of triangle (fakeout)
- move into liquidity below (green)
- push into previous LH (supply)
- 4-5% move for a long
Invalid on a HH or LL of triangle formation.
Cheers,
Vatsik

ETH/USD Near $2500 to Complete Pennant I believe the crash in June 2022 was premature, much like the new ATH in Nov 2021. I think Eth has it's targets set for that $2500 area to complete the gigantic pennant and then to pick a direction up/down from there.
Good luck!
