💥☃️🌲Ethereum Analyze(Happy New Year ,01/01/2023)!!!💥☃️🌲☃️💥💐🌲Merry Christmas💥💐🌲☃️
I hope 💥2023💥 will be one of the best years of your life, and together we can achieve great success.
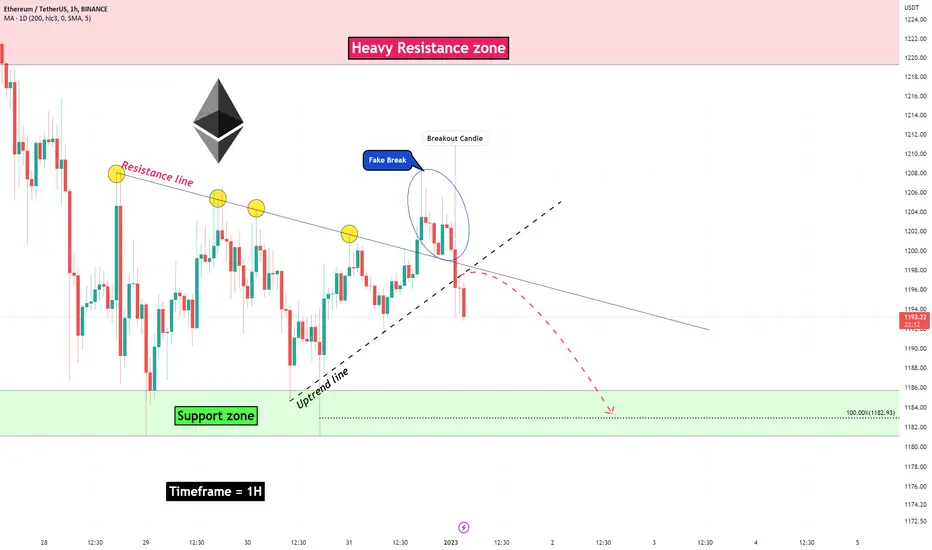
Ethereum was able to break the uptrend line with a long red candle.
I expect Ethereum will go down at least to the support zone.
Ethereum Analyze ( ETHUSDT ) Timeframe 1H⏰ .
Do not forget to put Stop loss for your positions (For every position you want to open).
Please follow your strategy, this is just my idea, and I will be glad to see your ideas in this post.
Please do not forget the ✅' like '✅ button 🙏😊 & Share it with your friends; thanks, and Trade safe.
Ether
ETH ANALYSIS#ETH is currently holding the double bottom support at the black box area after breaking below to the ascending triangle as well as the rising wedge pattern,if eth loses the current sup [port we might expect more dump in the price and eth can test the blue box support area .

ETH ANALYSIS#ETH UPDATE.
#ETH has already broken below to the rising wedge and currently testing the lower band as the resistance .There re 2 possible moves that could be possible in the upcoming hours but until eth closes above the purple box resistance area longs are risky however shorts are most preferred positions as the chances of eth rejection from current resistance are so high.

ETH ANALYSIS#ETH UPDATE.
#ETH is currently trading in rising wedge pattern which is generally a bearish pattern .On losing the lower band support we might see eth again testing the blue box support area once again,keep eyes.

the abcde range in the 2nd wave of the 3rd wave in the a wave1420 could be a good short opportunity with target of 966 dollars. Ethereum could have the last ascending wave before the plunge.

Ethereum hasn't started yet the 3rd wave of the a waveafter Ethereum lost 966 dollors the first target is 530 dollars and could retrace to 880 or 966 to prepare for the last target of the a wave.

on the fifth wave of the b wave?1.13iv will cover the 0.78a and could be the end of the b wave. Ethereum could plunge and decouple from Bitcoin at this level. the market needs these indexes to recover:
Ethereum dominance<10
Bitcoin dominance>50

ETH ANALYSIS#ETH UPDATE.
#ETH is currently trading at the resistance area on daily,since eth could not close above the resistance last day we must wait eth to close above the blue box resistance area.On closing above the resistance the next resistance for eth would be pink box area.

Ethereum ETH Price prediction for the end of the yearThis week we have the CPI report and the FED meeting. I expect the stock market to go down and cypto to follow it.
My price target for Ethereum ETH for the end of the year are the following:
ETH/USDT short
Entry Range: $1200 - 1300
Take Profit 1: $1140
Take Profit 2: $1090
Take Profit 3: $1000
Stop Loss: $1395

Etheurem to break to the upside?Ethereum - 14h expiry - We look to Buy a break of 1312 (stop at 1269)
Short term momentum is bullish.
There is no clear indication that the upward move is coming to an end.
A break of the recent high at 1302 should result in a further move higher.
Price action looks to be forming a bullish flag/pennant.
We look for gains to be extended today.
Our profit targets will be 1418 and 1438
Resistance: 1300 / 1330 / 1350
Support: 1280 / 1250 / 1220
Disclaimer – Saxo Bank Group.
Please be reminded – you alone are responsible for your trading – both gains and losses. There is a very high degree of risk involved in trading. The technical analysis , like any and all indicators, strategies, columns, articles and other features accessible on/though this site (including those from Signal Centre) are for informational purposes only and should not be construed as investment advice by you. Such technical analysis are believed to be obtained from sources believed to be reliable, but not warrant their respective completeness or accuracy, or warrant any results from the use of the information. Your use of the technical analysis , as would also your use of any and all mentioned indicators, strategies, columns, articles and all other features, is entirely at your own risk and it is your sole responsibility to evaluate the accuracy, completeness and usefulness (including suitability) of the information. You should assess the risk of any trade with your financial adviser and make your own independent decision(s) regarding any tradable products which may be the subject matter of the technical analysis or any of the said indicators, strategies, columns, articles and all other features.
Please also be reminded that if despite the above, any of the said technical analysis (or any of the said indicators, strategies, columns, articles and other features accessible on/through this site) is found to be advisory or a recommendation; and not merely informational in nature, the same is in any event provided with the intention of being for general circulation and availability only. As such it is not intended to and does not form part of any offer or recommendation directed at you specifically, or have any regard to the investment objectives, financial situation or needs of yourself or any other specific person. Before committing to a trade or investment therefore, please seek advice from a financial or other professional adviser regarding the suitability of the product for you and (where available) read the relevant product offer/description documents, including the risk disclosures. If you do not wish to seek such financial advice, please still exercise your mind and consider carefully whether the product is suitable for you because you alone remain responsible for your trading – both gains and losses.

ETH ANALYSIS#ETH UPDATE.
#ETH is currently holding the double bottom support on 4 and 1 day TF and break below this could result in more dump in the price of eth.


ETH ANALYSIS#ETH UPDATE.
#ETH isd currently trading at the blue box daily support and if eth loses the current daily support it is lost likely that eth might test the green box support on daily soon.The next possible move would take 4-6 hours so keep eyes on that,however purple box is the current resistance and eth needs to close above this level for any upside move.

ETH ANALYSIS#ETH UDATE.
#ETH has broken below to the purple box area which was the support and is now acting as the resistance for ETH.ETH is currently holding the daily support at the yellow box area ,if eth loses the current yellow box support and closes below to the yellow box on daily then I do expect more dump in the price of the ETH.

ETH Daily TA BearishETHUSD daily guidance is cautiously bearish. Recommended ratio: 5% ETH, 95% Cash.
*SELL-OFF WATCH. Cryptos and Equities are getting hammered as the effects of tighter monetary policy are starting to materialize in markets and the realization that the Federal Reserve may raise the funds rate beyond their 5.1%-5.2% projected terminal rate is a very real possibility. San Francisco Fed President Daly said today that her inflation projection has gone up and that she thinks we're still far away from the Fed's price stability goal ; this matches Fed Chair Powell's statement, during Wednesday's FOMC press conference, about markets and the economy not having felt the full effects of tightening yet. New York Fed President Williams said today that the still tight labor market may warrant a higher terminal funds rate than the Federal Reserve has projected (>5.1%) . The latest GDPNow US Q4 GDP estimate is 2.8%, down from 3.2% on 12/09 .
All eyes are still on CZ and Binance as he appears to be saying the same things SBF was saying about FTX, about Binance . Srutiny over whether or not Binance is actually solvent is starting to heat up in the midst of a battle of words with Kevin O'Leary (who continues to solidify his appearance as a fraudulent celebrity by defending FTX and SBF) . A class-action lawsuit was filed against Silvergate (a Federal Reserve member bank that supports cryptocurrency firms) for their involvement in transferring funds from FTX to Alameda Research , Silvergate's potential insolvency is a bearish catalyst that has yet to fully materialize in markets so it's important to keep track of this one. Russia continues to shell Ukraine's power grid infrastructure in attempt to push Ukraine into submission as the coldest of the winter months approaches.
DXY, US Long-Term Treasurys, Metals, Agriculture, JPYUSD and HSI are up. Cryptos, US Equities, US Equity Futures, Short-Term US Treasurys, Energy, VIX, CNYUSD, GBPUSD, EURUSD, N100 and NI225 are down.
Key Upcoming Dates: US November New Residential Construction at 830am EST 12/20; US Final Q3 GDP Estimate at 830am EST 12/22; US November PCE Index at 830am EST 12/23; UofM Consumer Sentiment Index at 10am EST 12/23. *
Price is currently trending down at $1196 after being rejected by the upper trendline of the descending channel from November 2021 + the 50MA at ~$1310 as resistance. Volume remains Moderate (High) and is on track to favor sellers for a third consecutive session if it closes today's session in the red; Price is currently breaking down below the VP Point of Control at $1265. Parabolic SAR flips bearish at $1152, this margin is bearish at the moment. RSI is currently trending down at 42 as it approaches a retest of the lower trendline of the Symmetrical Triangle from November 2018 at 38 as support. Stochastic remains bearish and is currently testing 33 support. MACD remains bullish and is currently on the verge of crossing over bearish at -3, if it falls below -3 then it would be a bearish crossover; the next support (minor) is at -46. ADX is currently trending sideways at -21 and is beginning to form a soft trough as Price continue to see selling pressure, this is mildly bearish at the moment.
If Price is able to bounce here then it will likely retest $1270 minor resistance . However, if Price continues to fall here, it will likely retest $1k minor support for the first time since July 2022. Mental Stop Loss: (two consecutive closes above) $1270.

ETHUSD - It is what it is - Still more downside to comeETHUSD looks bearish.
It is what it is . Probably many people would prefer to see higher prices but BTC broke the key support and ETH is lagging behind. It will have to catch up .
Probably some FUD would be a trigger for a dump.
What could it be? Do you have any clue? Feel free to share your FUD ideas in the comment section !

Ethereum Remains Higher Ahead of Fed Rate DecisionHello, welcome to this ETH /USDT 1DAY chart update by @CRYPTOSANDERS.
I have tried to bring the best possible outcome to this chart.
CHART ANALYSIS:-Ethereum (ETH) was also trading near a multi-week high in today’s session, as traders geared up for the U.S. Federal Reserve policy meeting.
Many expect the Fed to increase interest rates by 50 basis points, following the better-than-expected inflation report.
ETH/USD hit a high of $1,341.44 on Wednesday, which comes less than 24 hours after trading at a bottom of $1,289.23.
As can be seen from the chart, ethereum remains close to a five-week high, with prices in the green for a third consecutive session.
Like with bitcoin earlier, the RSI is now hovering close to a key resistance level of 59.00, with a current reading of 58.06.
Market pressure could intensify should bulls force a breakout of this hurdle, potentially leading ETH toward $1,400.
This is not a piece of financial advice.
Hit the like button if you like it and share your charts in the comments section.
Thank you

$ETHUSD What to watch for Idea for ETH
Basic trend line that shows to similar areas in green rectangles
These areas share a lot of structural similarities
Reversal Pattern


Ethereum - lack of volume - volatile FOMC meeting timeEven in case of bullish fakeouts
Assuming good news at FOMC announcement we might see a quick move up for ETH due to lack of volume above dear Crypto Nation
That's the power of volume - be prepared‼️
Let me know your thoughts in the comments🤗
⬇️⬇️⬇️
Likes and Follow for updates appreciated🤗
Disclaimer:
Not financial advice
Do your own research before investing
The content shared is for educational purposes only and is my personal opinion


Ethereum/US Dollar — December 10th, 2022In June as 3AC, Luna, and Co. came tumbling down crashing the market, Ethereum found a local bottom at $880. This number is a few dollars off depending on what exchange you’re using, it was a scam wick so that tends to happen. Anyways, huge level at $975 (which isn’t marked on this chart) that I took blindly on the 18th and played that move upwards. That pattern was seen as capitulation (marked red), followed by a scam wick to a catch by a God-tier level of support, which happened to be $1,041, bottom range of the green box. From here, we saw a short period of manipulation which is used by algo’s to try and stop you out of your position. If I had a stop loss throughout the month of July I would not have hit that trade, and by the time you check the charts, it’s too late.
This June capitulation move’s extension was played out to $1,995 and rejected off of there. Now, I marked that as a dashed line because that’s a 1st touch rejection and a typical occurrence for an asset coming out of a major sell-off / bear market, turning the tides. This is only seen if we’ve seen the bottom here on this November capitulation event that I’ll explain next.
In November, last month, we all know what happened and I know you’re tired of hearing about it too. This SBF capitulation event brought the spot price of Ethereum down to the God-tier level of $1,111 seen and respected in June. Now, if this is the last of the contagion, I’m sure you can agree with me that this is a double bottom formation with a higher low on this event although apparently CT was saying it’s going to get worse.
At the moment, my entry on this capitulation event whatever you want to call this, deviation, is $1,111 and I didn’t use a stop loss on this play either. We’re currently holding below this $1,287 level and I believe we should dance around it on the weekly open tomorrow night. From here if $1,111 continues to be respected and we keep stacking support levels, I’m expecting these TP1&2 marked out on my chart to play out. Again, just like June, I’m sort of expecting some weirdness around these levels as they are very touchy. Any serious close below $1,111 that isn’t a manipulation candle would send Ethereum straight to $788, but at the moment for some crazy reason I can’t help but to see this double bottom pattern. I’m expecting the same pattern as June to play out if we don’t see any more contagion.
Bitcoin's last bottom was 4-years ago in December 2018 and Bitcoin moves in 4-year cycles in tandem with the halving event. Today is December 10th, 2022.
I wish you all the best, cheers traders!
As always please do your own research, I am not a financial advisor and this chart is for educational purposes only.

ETH ANALYSIS#ETH UPDATE.
#ETH has bounced back from the double bottom after the breakdown from the ascending triangle Longs will be open only if eth closes above the red box resistance on daily,however on losing the purple box support eth will test the green box support area .
