ETHUSD - Structure to WatchStructure in green rectangle should be considered for the bulls
Down channel in red and slight up channel can be also drawn in white
Double bottom is evident along this white channel, favoring the bulls
Ether

ETH Daily TA Cautiously BearishETHUSD daily guidance is cautiously bearish. Recommended ratio: 35% ETH, 65% Cash.
*Risk-On markets continue to get shellacked by a combination of: expectations of rising central bank interest rates through the first half of 2023 (and perhaps beyond) and continued supply chain disruptions due to more sanctions on Russia (which influences BRICS and OPEC+) and a massive reduction in US/China trade that is currently underway. Turkey has begun to ask for proof of insurance from Russian oil tankers now that Western insurers have been stepping away, this has reportedly caused a bit of a backlog in the Bosphorus Straits. Any earnings reports are essentially a non-factor considering that many of the forecasts point to decreases in top and bottom lines across many of the heaviest weighted industry sectors for Q4 and 2023.
Putin said today that the risks of nuclear war are growing as needs for Russia to potentially use them as a "deterrent" are also growing . I really hope that this guy is taken out from inside, anybody who makes these kinds of threats that could potentially wipe out a majority (if not all) of their own people in response does not deserve to be a country's leader. Russian people should be just as scared as Ukrainians if this is the route Putin decides to take.
VIX, EURUSD, GBPUSD, JPYUSD, CNYUSD, Metals, Natural Gas, DJI Futures and Agriculture (mixed). DXY, US Equities, US Equity Futures (mixed), US Treasurys, Cryptos, NI225, N100 and HSI are down.
Key Upcoming Dates: US November PPI 830am EST 12/09; US November CPI 830am EST 12/13; Last FOMC Rate Hike Announcement of 2022 at 2pm EST 12/14; US November New Residential Construction at 830am EST 12/20; US Final Q3 GDP Estimate at 830am EST 12/22; US November PCE Index at 830am EST 12/23; UofM Consumer Sentiment Index at 10am EST 12/23. *
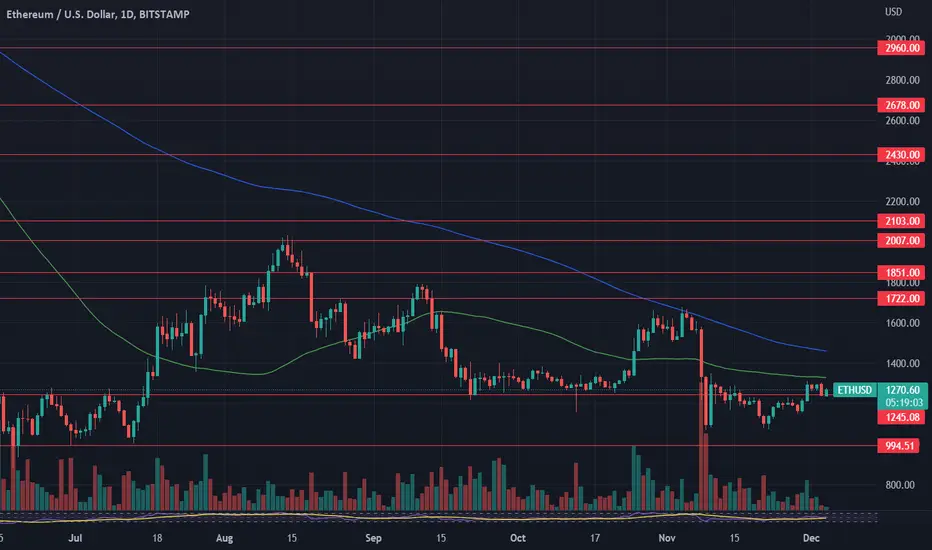
Price is currently trending down at $1232 and risks losing $1270 minor support if it closes below $1230 in today's session. Volume is currently Moderate (low) and on track to favor sellers if it closes today's session in the red, it has been alternating between buyer and seller dominance in the second largest supply/demand zone over the past week. Parabolic SAR flips bearish at $1085, this margin is mildly bearish at the moment. RSI is currently trending down at 47 and fell back into the Symmetrical Triangle (ST) from February 2020 in today's session, the next support is the lower trendline of the aforementioned ST at ~39. Stochastic remains bearish and is currently trending down at 68, the next support is at 62. MACD remains bullish and is currently forming a soft peak as it begins to trend down at -11, it would have to fall below -24 to crossover bearish at the moment. ADX is currently trending down at 28 and is beginning to form a soft trough as Price continues to see selling pressure, this is mildly bearish at the moment.
If Price is able to bounce here and trade back above $1270 minor support then it will likely aim to retest the 50MA at $1329 as resistance (which should coincide with the upper trendline of the descending channel from November 2021. However, if Price continues to fall here, it will likely retest the local low of $1100 as support before potentially retesting $1000 minor support for the first time since July 2022. Mental Stop Loss: (one close above) $1270 .

Ethereum - ETH traffic light scenario🚦Next to my Bitcoin traffic light scenario🚦
Here is one for Ethereum
🔴Bearish phase
TKD indicator turned from green to red
🟡ETH accumulation phase
TKD indicator forms a top
🟢Bullish phase
TKD indicator turned from red to green
Let me know your thoughts in the comments🤗
⬇️⬇️⬇️
Likes and Follow for updates appreciated🤗
Disclaimer:
Not financial advice
Do your own research before investing
The content shared is for educational purposes only and is my personal opinion

Ethereum is not being any more bullish than rest of the marketSimilarly, like in the case of Bitcoin, we patiently wait for Ethereum to resume selling pressure and revisit much lower price tags. Fortunately, macroeconomic factors do not force us to abandon the price targets we erected during the summer. Therefore we still maintain them. Respectively, we are talking about 1 000$ and 900$.
Technical analysis
Daily time frame = Neutral
Weekly time frame = Bearish
Please feel free to express your ideas and thoughts in the comment section.
DISCLAIMER: This analysis is not intended to encourage any buying or selling of any particular securities. Furthermore, it should not be a basis for taking any trade action by an individual investor. Therefore, your own due diligence is highly advised before entering a trade.

ETHERUM #ETH SELL CONFIRMEDBINANCE:ETHUSDT
let watch Ethereum to start falling in a very few days from now.

Ethereum price hints at possible growthIn November, when the BTCUSDT price updated the 2022 low, ETH buyers did not allow the price to update the annual low.
In November, the fall of the ETHUSDT price stopped in the liquidity zone of $1000-1250. This zone has played an important role in supporting buyers since 2021.
In the near future, Ethereum buyers have an important task to fix the Ether price above the liquidity zone, that is, above $1250
So, in the event of a "positive" in the cryptocurrency market, we have the following assumption of the possible movement of the ETHUSD price:
Growth to $1540 - correction to $1200-1250 - growth to $1900
_____________________
Did you like our analysis? Leave a comment, like, and follow to get more

ETH +10% in the next days?Hello hello! I made a quick analysis on ETH on a daily timeframe and I see some potential of another aggressive move of at least 10%. The EMAs are close to cross, indicating a bullish environment, the moving averages overall shows a strong buy, and a strong zone of resistance was recently broken, so the next target should be the next zone - at 1373. On the retest of the previous resistance we can be looking for an entry, giving us a 10% move until the next zone.
What do you think? COINBASE:ETHUSD

Ether: questionable recoveryEther had a relatively good week, managing to recover some 5% of its market value, adding $7B to its market cap. Regardless of good weekly news, it is still too early to celebrate, since the dust over FTX contingencies is not settled, and market insecurity is still keeping investors aside. In this sense, it might take some time in the future until we see a clear ETH recovery, while based on ETH futures inverted price curve, markets are not expecting some significant increase in price of the coin until the end of next year. FED's monetary measures and unsecure macroeconomic environment are significantly adding to investor`s decreased confidence.
Previous week ETH started at a level of $1.150, which is the lowest level for the previous week. During the week, the coin was pushed higher, and was testing short term resistance at $1.3K. Considering significantly decreased daily trading volumes, there was just not enough market strength to push the price above this level, so the market reverted a bit to the downside. ETH is finishing the week around level of $1.260. RSI tried to break the 50 line, but still ended the week at this level. Market is still not ready for a clear road toward the overbought side. Moving averages of 50 and 200 days are slowing down their downtrend, but still continue to move as two parallel lines. There is still no indication on the potential for a cross to occur anytime soon.
Considering significantly decreased daily trading volumes, any sort of stronger recovery will be on hold. It might take even several weeks more. Investor’s hesitancy is on a stage now, and will be for some time in the future period. In this sense, it could be expected that ETH will continue to move within its current range, from the $1.2K support line, with some potential for $1.4K, but with lower probability.
ETHUSD - RSI bearish divergencehello all, as we can see, after a nice rally, ethereum has come to the most important resistance by printing a divergence on the RSI, I think we will see a revisit of the support at 1235. Thanks everyone!

Ethereum - Use of volume profileMy trading wisdom for you dear Crypto Nation
Use volume profile to find key resistance and support🔴🟢
Here a live example of current short-term support levels for ETH on the 1h chart👀
Let me know your thoughts in the comments🤗
⬇️⬇️⬇️
Likes and Follow for updates appreciated🤗
Disclaimer:
Not financial advice
Do your own research before investing
The content shared is for educational purposes only and is my personal opinion

Ethereum Multi time frames 🔵1 h chart 🔴4 h chart 🟢daily chartEthereum Multi time frames
🔵1 h chart - possible correction should find volume support at $1,202
🔴4 h chart - further support given by EMA50
🟢daily chart - a break of 1,269 would be a huge bullish signal 🚨👀
Let me know your thoughts in the comments🤗
⬇️⬇️⬇️
Likes and Follow for updates appreciated🤗
Disclaimer:
Not financial advice
Do your own research before investing
The content shared is for educational purposes only and is my personal opinion

ETHPERP - Successful buying.The accumulation continues. The price is near the local highs. Most likely, we will try the highs after a correction and a test of the buyer's zone of interest, which is in the range of 1077-1131. If you resume the purchases on the chart, there is the volume, the result and the progress. We expect the completion of the correction before entering the trend.
If you liked the idea, give it a like. This is the best "Thank you!" for the author 😊
P.S. Always do your own analysis before a trade. Put a stop loss. Fix profits in installments. Withdraw profits in fiat and make yourself and your
your friends.

Ether LongThe crypto shows good indication for continuation of bullish trend with the formation of cup and handle pattern. Buyers should wait for upwards breaking of cup and handle before going long.

ETHUSDT in the range short-term moveIf ETH breaks the resistance at 1230$, we should see a move towards the next key resistance which is at 1290$ .
Currently the price remains in the mid of the range. Pullback to the bottom of the range is still possible.
2 scenarios visualized on the chart.
Break below the support (green line) would be an invalidation . Stop loss in place is highly recommended . Good luck

Ether Bear Case.gm
---
recently shared a bull case on ether,
but i'm not seeing what i need to see to confirm it .
---
for every bull case, there is an equivalent bear case -
so it's important to entertain both sides, regardless of your bias.
---
bitcoin hashrate is starting to slip in these last few days, a sign of the final capitulation.
i have talked about the hash-rate extensively, and how we have to see it come back down to equilibrium before a true bottom is created.
watch btc miners if true,
as this would be the final stress test on them.
---
>only the strongest will survive in this market
>let the strongest be you.
---
eth downside target = $500~$600
🔺

ETH Daily TA Cautiously BullishETHUSD daily guidance is cautiously bullish. Recommended ratio: 65% ETH, 35% Cash.
* CRITICAL RESISTANCE WATCH . China's refusal to adapt to the reality that the virus they helped introduce to the world likely cannot and will not ever be eradicated weighed on markets yet again in a short trading day for US Equity and Bond markets. TBH I hope there is more upheaval and that Chinese citizens are able to overcome this lockdown battle that is frivolous at best. This may have bled out into Crypto markets but it was rather temporary if it did.
Cryptos, Equity Futures, DXY, Long-Term US Treasurys, Gold, Agriculture, N100 and VIX are up. US Equities, Energy, EURUSD, GBPUSD, JPYUSD, CNYUSD, HSI, NI225 and Short-Term US Treasurys are down.
Key Upcoming Dates: US Consumer Confidence Index at 10am EST 11/29; 2nd BEA Estimate of US Q3 GDP at 830am EST 11/30; Fed Chair Jerome Powell speech at Brookings Institute at 130pm EST 11/30; Beige Book at 2pm EST 11/30; October PCE Index at 830am EST 12/01; November Employment Situation at 830am EST 12/02; Last FOMC Rate Hike Announcement of 2022 at 2pm EST 12/14. *
Price is currently trending up at $1220 as it approaches a retest of $1270 minor resistance. Volume finished yesterday's session favoring sellers and is on track to favor buyers if it can close today's session in the green; it has been shrinking for 5 consecutive sessions now which is indicative of an impending breakout/breakdown. RSI is trending up slightly at 45 as it approaches a test of the descending trendline from February 2020 at 50 as resistance. Stochastic remains bullish and is currently forming a soft peak at 98 as it approaches a test of max top for the first time since September 2022. MACD crossed over bullish in today's session and is currently trending up at -61, the next resistance (minor) is at -46. ADX is currently trending down slightly at 46 as Price is pushing higher, this is mildly bullish at the moment.
If Price is able to continue higher then it will likely retest $1270 minor resistance before potentially retesting the 50MA at ~$1343 as resistance which should coincide with the uptrend line from June 2022 (as resistance). However, if Price breaks down here, it will likely fall back to $1100 before potentially retesting $1000 minor support . Mental Stop Loss: (one close below) $1100 .

ETHUSDT short-term moveETHUSDT on 15 minutes degree doesn´t look good. If support breaks we will see a move down towards the next key level on this low timeframe.
Don´t forget about the stop loss.
Good luck

Ethereum Analyze (Road Map)!!!🗺️Today I want to talk to you about the Ethereum Road map, so stay with me.
Ethereum is moving in its main wave 4, and I marked the end of main wave 4(zones) on my chart. Of course, there is a scenario in that Ethereum has finished the main wave 4 and is at the beginning of main wave 5. To confirm this, we need to confirm a series of events, such as: issuing a buy signal by SMA 50 and EMA 50 and, in the next step After, issuing a buy signal by SMA 100 and EMA 100.
Also, if Ethereum can break(valid) the resistance line, we can be sure of the completion of the main wave 4.
Ethereum Analyze ( ETHUSD ) Weekly Timeframe⏰.
Do not forget to put Stop loss for your positions (For every position you want to open).
Please follow your strategy, this is just my idea, and I will be glad to see your ideas in this post.
Please do not forget the ✅' like '✅ button 🙏😊 & Share it with your friends; thanks, and Trade safe.

#ETH/USDT 36%+ Potential Pump. RR 1:8 !!I've already shared the reason I am opening this long in my last BTC update.
(The link is at the bottom of this update)
ETH/USDT
Entry:- $1085 TO $1167
(5.39% is the accumulation range from CMP so plan your entry accordingly)
Stop Loss:- $1052.94
Target:- Open (Possibly +30%)
RR 1:8 (Highly Lucrative)
This is not financial advice. Always DYOR.
These are my trades.
Do not cry in the comments if you can't afford the Stop Loss or go for 125x gambling.
If you like me to post more. Share this idea with your friends and communities and please hit the like button.
I have been with you in the bullish days and the bearish days.
We are going to have an amazing bull run for sure.
Cheers!
Thank you
#PEACE

FTX's hacker, heist, and no optimismOver the past two weeks, Ethereum enjoyed much attention, with media coverage about FTX’s hacker dumping his holdings on the market.
Some of the recent activities in “FTX accounts drainers” - based on information from Etherscan.
FTX accounts drainer 1 - 0x59ABf3837Fa962d6853b4Cc0a19513AA031fd32b
19th November 2022 - Ethereum balance = 250 735 ($305 million)
21st November 2022 - Ethereum balance = 5 735 ($6.36 million)
FTX accounts drainer 2 - 0xc40aBF7E6499694ea6F965Df96e39E51305E019a
12th November 2022 - Ethereum balance = 1 287 ($1.6 million)
15th November 2022 - Ethereum balance = 0 ($0)
FTX accounts drainer 3 - 0x585ed783C9246553E8bC9f9046C80f54AfEE7765
12th November 2022 - Ethereum balance = 13 205 ($16.5 million)
15th November 2022 - Ethereum balance = 1.47 ($1844)
Ethereum dropped more than 11% from Sunday to Monday before erasing some losses. A decline stopped slightly above the support level at 1071.50$, and since then, the price action has remained choppy.
Apart from Bitcoin, ETHUSD did not constitute a new low for the year. Though it is nothing surprising if we consider how much better (seemingly) it has performed. That, however, does not change our view.
We still hold a bearish stance and believe the bottom is not set in. As we noted over the summer (and several times thereafter), the attractive price for shorting is between 1 500$ and 1 600$ (or higher); however, from the current level taking a short position represents much more risk. With that let out there, we maintain our price targets at 1 000$ and 900$.
Technical analysis - daily time frame
RSI is neutral. Stochastic points to the upside but stays in the bearish zone. MACD is flattening. DM+ and DM- are bearish. Overall, the daily time frame is bearish.
Illustration 1.01
Illustration 1.01 shows the daily chart of ETHUSD and simple support/resistance levels.
Technical analysis - weekly time frame
MACD is neutral. Stochastic is bearish. RSI is slightly bearish/neutral. DM+ and DM- are stay bearish. Overall, the weekly time frame is bearish.
Please feel free to express your ideas and thoughts in the comment section.
DISCLAIMER: This analysis is not intended to encourage any buying or selling of any particular securities. Furthermore, it should not be a basis for taking any trade action by an individual investor. Therefore, your own due diligence is highly advised before entering a trade.

3 TradingView indicators for trading EthereumTrading Ethereum can be a completely different experience to trading Bitcoin and other cryptocurrencies. While most cryptocurrency will typically move in unison, each Cryptocurrency does still have its own fundamental factors unique to its particular ecosystem, which means that they can move at different intensities and sometimes these unique aspects means they won't move in unison at all.
This can be very much true for Ethereum and it can frequently diverge from general market sentiment and forge its own price action path. As such, Ethereum traders might like to pay attention to indicators that were designed to fit this asset class. In this article we explore three such indicators and their use with to trading Ethereum.
Performante's Average Ethereum Volume Indicator
The Performante's Average Ethereum Volume Indicator uses volume flow from the biggest cryptocurrency exchanges, to determine the average trading volume of the asset. The benefit of this indicator is that you now can see a more accurate and all-encompassing idea of the volume of the asset being traded, rather than a volume flowing through one exchange/ broker.
Ethereum Long-Short Ratio
This indicator is important for understanding market sentiment as derived from the number of long traders vs the number of short traders.
Effectively, the higher the ratio (the higher the orange bars) means that long traders out number short traders, the we might have more confidence in the bullish prospect of Ethereum. Conversely, a lower the ratio, or the lowering of the ratio, might indicate the declining bullish prospect of Ethereum.
Correlation Coefficient
After you select this indicator, you will be presented with a popup box for you to choose an asset that you can compare with Ethereum. Your selection here could be banking stocks, tech stocks, Bitcoin, another cryptocurrency, or any other asset that aligns with a theory you have about Ethereum moving in relation to the movement in another asset.
The Correlation Coefficient Indicator is range bound between 1 and –1. If the indicator is switching between the bounds of this range or hugging close to 0, it typically means that the relationship between the assets is not very strong or predictable (as 0 indicates no correlation). What you want to watch out for are assets where the indicator remains close to 1 (as this indicates a high positive correlation) or -1 (as this indicates a high inverse correlation). Either way, a positive or inverse relationship can be used to help determine the movement of Ethereum via this other asset.


BUY ETHEREUMETHEREUM is still in its uptrend channel on the weekly timeframe and currently retesting its down channel .
If the uptrend lower channel doesn't break and a weekly close above area 1300-1700 area will confirm, an upcoming bullish movement to new all time highs.
