Ether Bulls Charge as Price Breaches $3,300The Ethereum (ETH) market has witnessed a significant surge in recent days, with the price decisively breaking through the $3,250 resistance zone. This bullish momentum has instilled confidence in investors, suggesting further potential gains in the near term.
Breaking Through Resistance: A Sign of Strength
Previously, the $3,250 level had acted as a formidable barrier for ETH. However, the bulls (investors who believe the price will rise) have managed to overcome this resistance, indicating a shift in market sentiment. This breakout suggests a potential increase in buying pressure, pushing the price further upwards.
Technical Indicators Add Weight to the Bullish Case
Technical analysis, which studies price charts and historical data to predict future movements, strengthens the bullish argument for Ethereum. One key indicator is the 100-hourly Simple Moving Average (SMA). The price currently sits above this average, signifying an upward trend. Additionally, the formation of a bullish trend line on the hourly chart, with support at $3,270, provides further technical validation for the ongoing price increase.
Potential for Continued Upsides
Analysts are cautiously optimistic about the potential for ETH to continue its ascent. ETH price surpassed the $3,320 and even reached beyond $3,350 resistance levels. However, it's crucial to remember that the cryptocurrency market remains volatile, and unforeseen events can trigger price corrections.
Factors Influencing Ethereum's Price
Several factors are likely contributing to Ethereum's current bullish run. Here's a closer look at some of the key drivers:
• Increased Demand for Decentralized Finance (DeFi): DeFi applications, which enable financial services without traditional intermediaries, are built on the Ethereum blockchain. A surge in DeFi activity can lead to a higher demand for ETH, driving up the price.
• The Merge and Ethereum 2.0: The upcoming Ethereum 2.0 upgrade, also known as the Merge, is a much-anticipated event that aims to improve scalability and security. Excitement surrounding the Merge could be attracting investors and contributing to the price increase.
• Positive Sentiment in the Broader Crypto Market: If Bitcoin, the leading cryptocurrency, experiences a significant price increase, it often has a positive ripple effect on the entire crypto market, including Ethereum.
Looking Ahead: Will the Bulls Maintain Control?
While the current outlook for Ethereum is positive, there are still uncertainties. For instance, a regulatory crackdown on cryptocurrencies by governments or a major security breach on a DeFi platform could dampen investor sentiment and trigger a price decline.
Conclusion: A Cautiously Optimistic View
Ethereum's recent price surge above $3,300 is a welcome sign for bulls. Technical indicators and potential catalysts like DeFi growth and the Merge suggest the possibility of further gains in the near term. However, the cryptocurrency market remains unpredictable, and investors should exercise caution and conduct thorough research before making any investment decisions.
Ether

Ethereum(ETH) Analysis===>>15 minute time frameEthereum(ETH) has succeeded in breaking the lower line of the Symmetrical Triangle .
According to the theory of Elliott waves , Ethereum(ETH) seems to be completing corrective wave s.
I expect Ethereum(ETH) to fall at least to the Potential Reversal Zone(PRZ) .
Note: An important point you should always remember is capital management and lack of greed.
Ethereum Analyze (ETHUSDT), 15-minute time frame ⏰.
Do not forget to put Stop loss for your positions (For every position you want to open).
Please follow your strategy; this is just my Idea, and I will gladly see your ideas in this post.
Please do not forget the ✅' like '✅ button 🙏😊 & Share it with your friends; thanks, and Trade safe.

Technical Analysis of Ethereum (ETH/USDT) by Blaž FabjanTechnical Analysis of Ethereum (ETH/USDT)
Chart Overview:
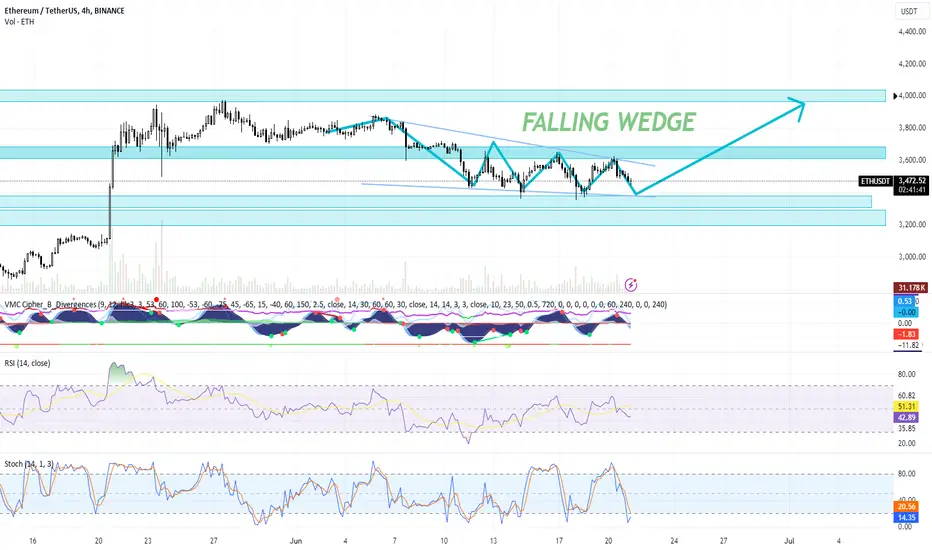
The chart depicts the ETH/USDT price action on a 4-hour timeframe, showcasing a falling wedge pattern, which is generally considered a bullish reversal pattern. Here are the key observations:
Falling Wedge Pattern:
The falling wedge is marked clearly, indicating a potential upward breakout. The pattern is confirmed by the higher lows and lower highs converging towards the apex.
Support and Resistance Levels:
Resistance Zones: $3,600 - $3,800 and $4,000.
Support Zones: $3,200 - $3,400.
Volume: The volume is relatively low but picking up near support zones, which is a typical characteristic before a breakout.
Indicators:
VMC Cipher B: Showing potential divergences with green dots indicating possible bullish momentum.
RSI (14): Currently at 42.06, suggesting the market is not overbought and has room to move up.
Stochastic RSI: Showing oversold conditions, which could indicate a buying opportunity as it crosses upwards.
Trading Plan
Intraday Trading
Strategy: Use support and resistance levels for quick trades.
Entry: Buy near the support zone ($3,200 - $3,400) when confirmed by bullish indicators (e.g., green dots on VMC Cipher B).
Target: Sell near the first resistance zone ($3,600 - $3,800).
Stop Loss: Place a stop loss below $3,200 to manage risk.
Scalping
Strategy: Take advantage of small price movements within the support and resistance zones.
Entry: Buy on minor pullbacks within the wedge near $3,300 - $3,400.
Target: Aim for small profits at $3,450 - $3,500.
Stop Loss: Place tight stop losses around $3,280 to minimize losses on quick trades.
Swing Trading
Strategy: Capitalize on the potential breakout from the falling wedge.
Entry: Buy once price breaks and retests the upper trendline of the wedge around $3,500 with confirmation from volume increase.
Target: First target at $3,800, with a potential move to $4,000.
Stop Loss: Place a stop loss below the retest level, around $3,400.
Conclusion and Advice
Given the technical indicators and the falling wedge pattern, Ethereum (ETH) is showing signs of a bullish reversal. Traders should consider the following:
Long Positions: Favorable for all trading strategies (intraday, scalping, and swing trading) as the pattern and indicators suggest an upward movement. Enter positions near support levels and on confirmed breakouts.
Short Positions: Not advisable at this stage unless there's a confirmed breakdown below the support zone of $3,200, which could invalidate the bullish pattern.
Recommendation: Based on the chart, a long position is recommended with careful attention to the support and resistance levels. Monitor the indicators for any shifts in momentum and adjust the trading strategy accordingly. Always use stop losses to manage risk effectively.
Ethereum ETH price ready to move. ETH ETF soon ?In 2 months, the #ETHUSDT price rose from $3000 to $4000 and firmly established itself above $3400. Clearly according to the blue scenario 💙
+ the news background around the #ETH ETF is actively recovering that large funds are ready to buy, just "agree" and launch)
So let's try to assume that the next wave of #Ethereum price growth will be at least up to $5400
_____________________
Did you like our analysis? Leave a comment, like, and follow to get more

200,000 ETH Options Expiry: The Perfect Time to Go LongHold onto your seats because we have some thrilling news coming your way! The Ethereum market is buzzing with excitement as we approach a massive 200,000 ETH options expiry. This is a pivotal moment that could send Ethereum's price soaring to new heights, and you won't want to miss out on the action!
As the expiry date looms, demand for Ethereum is already spiking. Traders across the globe are gearing up for what could be a monumental price movement. The big question on everyone's mind: How far can Ethereum's price go?
Here's why this could be a golden opportunity:
**High Demand:** The sheer volume of options set to expire is creating a frenzy of activity. More demand often translates to higher prices.
**Market Sentiment:** Positive sentiment around Ethereum and its future developments is stronger than ever. This is a prime time to capitalize on the bullish momentum.
**Technical Indicators:** Many technical analysts are pointing to bullish patterns that suggest a significant upward movement is on the horizon.
Now is the time to make your move and consider going long on Ethereum. The potential for substantial gains is within reach, and you don't want to be left on the sidelines.
Don't miss out on this electrifying opportunity. Get in on the action now and position yourself for potential significant returns. Let's ride this wave together!
Happy trading,
Remember, the early bird catches the worm! Make your move before the market reacts.

BTC - 4H Rise PossibilityIn the recent price action, Bitcoin has shown a notable reaction to the resistance zone around $71,000 - $72,000, leading to a decline characterized by three distinct downward pushes. The third push, however, demonstrated reduced selling pressure as it failed to make a significantly lower low, indicating potential weakening of the bearish momentum.
Crucially, the last two lows have formed around the previously established order block zone from the last leg up, a key area of interest that typically acts as a support. This area appears to have provided a base for BTC, preventing further declines. Given the current price structure and the formation of lows, there's a strong possibility for Bitcoin to recover and test the previous resistance zones again.
Looking ahead, if BTC continues to maintain support at this order block zone and builds on the bullish structure, we could see a move towards the resistance levels at $69,000 - $71,000. Market participants should watch for bullish signs like consolidation or higher lows forming above the current support to confirm a potential rise. Overall, Bitcoin's ability to hold this support and recover suggests a favorable outlook for upward momentum in the near term.


ETH - 4H more correctionIn the 4-hour timeframe, Ethereum's recent upward movement was a classic pullback after failing to hold its previous support level. This pullback reached the resistance zone around $3,600, which acted as a significant barrier. Now, ETH is showing signs of weakening and is likely to continue its downward trajectory.
Expect Ethereum to target the next support levels around $3,310 and possibly $3,110, as indicated in the chart. These zones are crucial as they represent potential areas where buyers might step in.

Ethereum Returning to the EtherEthereum lost an uptrend it has been in for >6.5 years back in July of this last year.
That uptrend also forms the bottom of a rising wedge that has taken shape when drawing a trend from peak to peak over the years.
Upon losing its uptrend, it briefly saw a pullback during Feb - March of this year, but then lost it again and has since bounced down from a re-test it did in May.
It's BINANCE:ETHBTC pair also lost a 7.2 year uptrend back in March and has also since failed to get back above it upon re-test:
Possible scenarios for new ATHs before down:
It could drag out through July or later and re-test again, which might even give it a new / slightly higher ATH before starting the long haul down.
Or, it could break back into the rising wedge and move near the top, around 10k as some have expected, and that could delay and mitigate its downside.
Another look at ETH/BTC 2-Weekly and daily charts with chances to become bullish or bearish:
2-Weekly:
Daily Chart zoom in on re-test of 7.2 year uptrend, where it formed a rising wedge and hit downside targets, so far:

ETHUSD - Bounce Up? Drawing trend lines like this shows the support line and possible higher line that leads to a large upward reaction which I have high lighted in green
Lets see how this goes, if it continues upward
I am very bullish on ETHUSD

ETHUSD - Angled Inverted H&SRight Shoulder is currently under formation with the big bull move yet to come
H is the head of the structure
Top dotted line is just a potential price move and forecast aligning with the lower diagonal lines
Bullish

The Bright Future of Ethereum"Past performance is no guarantee of future results" - We all know this famous phrase...
Nonetheless, Ethereum still has a very bright future in the next decade.
*Why I'm bullish on Ethereum:*
- Every competing "superior" and newer blockchain (Fantom, Avalanche, Harmony, ...) includes EVM (Ethereum Virtual Machine) Compatibilty.
- These types of products that are always compared with often have a long future, because they are the golden standard every competing company wants to be (Apple, Bitcoin, Tesla, ...)
- Ethereum's transition to PoS will ensure lighter regulation compared to PoW Blockchains in the coming years, where sustainability and net zero emission is a core element of the global agenda.
- Bankers & Wallstreet LOVE Ethereum because it is the backbone of every major DeFi Application that replaces traditional Financial Instruments (AAVE - Lending, UMA - Insurance, SNX - Derivatives, UNI -Exchanges, DAI - Stablecoins, LINK - Infrastructure, YFI - Asset Management)
- The majority of the Web3 Economy builds upon Ethereum (Metaverses, DAOs)
- ERC-721 (NFT's) are revolutionizing the art market.
- ERC-1155 is revolutionizing the entire gaming Industry. (Enjin, Axie)
- It is completely open source.
*Possible bearish scenarios:*
- Eth2.0 (if it ACTUALLY ever launches) is completely underwhelming.
- Cryptocurrency gets banned in the United States as well.
- "Black Swans" (Pandemics, Terrorism, War)
- Vitalik Buterin gets caught in money laundering (?) and his holdings will be confiscated by the government.
- Satoshi Nakamoto returns from the dead and dumps his entire BTC stack on the market, which will drag Ethereum with it.
- Ethereum gets exploited.
- Global Internet outage.
To wrap it up: I'm bearish in the short term due to the extreme correlation with US Stocks and ETFs. ETH is still completely overbought on the monthly chart.
I'm looking at price levels around $1'200, if there is a black swan event, even around $700 is a possibility.
I hope you enjoyed my thoughts and analysis on Ethereum. May the fortune be with you :)
-CYANE

Ethereum's Potential Surge: Bouncing Back from a 7-Year Support The recent weeks have been pivotal for Ethereum, the world's second-largest cryptocurrency. While its price faced some fluctuations, a crucial technical development suggests a potential for significant growth in the near future. Analysts are closely watching a technical indicator that hints at a bullish outlook for Ethereum in the coming months.
The Power of the 7-Year Support Line
The indicator in question is the ETH/BTC ratio, a metric that compares the performance of Ethereum relative to Bitcoin. This ratio recently bounced off a significant support trend line that has been in place for a staggering seven years. This trend line essentially represents a historical price barrier below which the ETH/BTC ratio hasn't fallen for an extended period.
Technical analysts view such bounces from long-term support lines as potentially bullish signals. The argument is that when prices find support at these historical levels, it often precedes a period of price appreciation. In simpler terms, the fact that the ETH/BTC ratio held above this key support line suggests a potential reversal of the recent downtrend and a possible upswing for Ethereum relative to Bitcoin.
Dissecting the Bullish Signal
There's more to the story than just the bounce itself. The specific candlestick pattern formed at the support line adds further weight to the bullish interpretation. This pattern, known as a "hammer," is characterized by a long lower wick and a relatively small body, indicating selling pressure that was ultimately overcome by buying pressure. In the context of the ETH/BTC ratio, this hammer suggests that while there were attempts to push the ratio lower, bulls stepped in and prevented a significant decline.
What Could This Mean for Ethereum Prices?
While the bounce from the support line and the hammer candlestick pattern are positive signs, it's important to manage expectations. Analysts aren't suggesting an immediate surge to $4,900, the number mentioned in some headlines.
However, the technical signals do hint at a potential for a sustained increase in the value of Ethereum relative to Bitcoin. This could translate to a notable rise in the USD price of Ethereum as well.
Factors to Consider Beyond Technicals
While technical analysis plays a role, it's not the sole factor influencing cryptocurrency prices. Here are some additional considerations:
• Overall market sentiment: A bullish trend in the broader cryptocurrency market would undoubtedly benefit Ethereum.
• Developments on the Ethereum network: Upcoming upgrades or positive news surrounding the Ethereum blockchain technology could further fuel its growth.
• Regulatory landscape: Regulatory clarity and adoption of Ethereum-based applications could attract more users and investors.
A Cautious Approach with a Hint of Optimism
The bounce from the 7-year support line offers a glimmer of optimism for Ethereum's future. However, investors should exercise caution and conduct their own research before making any investment decisions. The cryptocurrency market remains volatile, and unforeseen events can always impact prices.
Conclusion: A Potential Turning Point for Ethereum
The technical indicators surrounding the ETH/BTC ratio suggest a potential turning point for Ethereum. While the exact price trajectory remains uncertain, the bounce from the long-term support line and the bullish candlestick formation paint a hopeful picture for Ethereum's relative strength in the coming months. By staying informed about broader market trends, technological advancements, and regulatory developments, investors can make informed decisions about their Ethereum holdings.

Ethereum Eyes $3800 as Weekly Wedge Breaks: Bulls Charge ForwardEthereum (ETH), the world's second-largest cryptocurrency by market capitalization, is signaling a potential breakout after a period of consolidation. This technical upswing comes after ETH/USD decisively broke out of a well-defined weekly wedge chart pattern, raising hopes of a surge towards $3800.
Understanding the Weekly Wedge Pattern
The wedge pattern is a common chart formation used by technical analysts to identify potential trend continuations or reversals. In a rising wedge, two converging trendlines, one acting as support and the other as resistance, form a triangle-like shape. This price action often indicates a period of consolidation before a breakout.
In the case of ETH/USD, the recent price movement formed a rising wedge on the weekly chart. The price action respected the trendlines for several weeks, suggesting indecision amongst buyers and sellers. However, a decisive break above the upper trendline signifies a potential bullish continuation.
Bullish Sentiment Emerges
The breakout from the wedge pattern is a bullish technical indicator for Ethereum. It suggests that buyers have finally overpowered sellers and are pushing the price higher. This could be the beginning of a new uptrend, with the upper target of the wedge around $3800 coming into focus.
Several factors could be contributing to the renewed bullish sentiment surrounding Ethereum. The successful completion of the Merge, transitioning Ethereum from a Proof-of-Work to a Proof-of-Stake consensus mechanism, could be a key driver. This upgrade is expected to improve scalability, security, and energy efficiency for the Ethereum network in the long run.
Indicators Support the Breakout
Technical indicators on the weekly chart are also aligning with the bullish breakout. The Relative Strength Index (RSI) is currently hovering around 60, indicating neither overbought nor oversold conditions, leaving room for further upside potential. Additionally, the Moving Average Convergence Divergence (MACD) has generated a bullish crossover, suggesting a potential shift in momentum towards the upside.
Potential Roadblocks and Considerations
While the technical indicators are flashing bullish signals, it's important to acknowledge potential roadblocks that could derail the ETH/USD rally. The overall health of the cryptocurrency market and broader economic conditions will significantly influence Ethereum's price movement.
A resurgence of regulatory scrutiny on the cryptocurrency industry or a broader market sell-off could lead to a pullback in ETH's price. Additionally, unforeseen technical challenges related to the Merge or delays in Ethereum's scaling roadmap could dampen investor sentiment.
What to Watch Out For
Traders and investors should closely monitor key price levels and technical indicators to gauge the strength of the breakout. If ETH/USD can hold above the broken resistance line of the wedge pattern, it would be a positive sign for the bulls. Conversely, a drop back below the trendline could signal a potential breakdown and a return to the consolidation phase.
The trading volume associated with the breakout will also be crucial to watch. High volume breakouts are generally considered more reliable than those with lower volume, as they indicate stronger conviction from buyers.
Conclusion
The breakout of ETH/USD from the weekly wedge pattern is a welcome development for bulls. While the upper target of $3800 remains in sight, continued investor confidence, healthy market conditions, and successful implementation of Ethereum's roadmap will be essential for the bulls to maintain control. As always, proper risk management and close monitoring of technical indicators are crucial for navigating the ever-volatile cryptocurrency market.

Congress Throws Weight Behind Spot Ethereum ETFs: SEC Approval?Congress Throws Weight Behind Spot Ethereum ETFs: SEC Approval on the Horizon?
On May 22nd, 2024, a bipartisan group of US lawmakers sent a strong message to the Securities and Exchange Commission (SEC). In a letter, they urged the regulatory body to approve applications for spot Ethereum exchange-traded funds (ETFs). This move signifies a growing momentum in Congress for legitimizing Ethereum within the traditional investment landscape.
The letter's signatories included heavyweights like House Majority Whip Tom Emmer (R-MN) and Financial Services Committee Vice Chairman French Hill (R-AR). Notably, Democrats were also present, with Representatives Josh Gottheimer (D-NJ), Mike Flood (R-NE), and Wiley Nickel (D-NC) joining the call for regulatory clarity. This bipartisan support highlights a potential turning point for the cryptocurrency industry, as it demonstrates a willingness from both sides of the aisle to embrace innovation.
Why Ethereum ETFs Matter
Exchange-traded funds, or ETFs, are investment vehicles that track the performance of an underlying asset, like a basket of stocks or a commodity. A spot ETF would directly hold Ethereum, allowing investors to gain exposure to the cryptocurrency without the complexities of managing their own digital wallets. This could significantly increase investor participation in the Ethereum market, potentially leading to greater price stability and mainstream adoption.
For many lawmakers, approving spot Ethereum ETFs is a logical next step after the SEC's green light for spot Bitcoin ETFs earlier this year. The argument goes that the SEC has already established a framework for evaluating these products, and Ethereum, as the second-largest cryptocurrency, deserves similar treatment.
The Lawmakers' Argument
In their letter, the lawmakers specifically urged the SEC to apply consistent standards. They argued that the "principles" used to approve spot Bitcoin ETFs should also be employed for Ethereum. This consistency is crucial for building trust in the regulatory process and fostering a fair market environment for all cryptocurrencies.
Furthermore, the letter highlights the potential benefits of Ethereum ETFs for investors. Increased accessibility could attract new capital to the market, bolstering innovation and economic growth within the Ethereum ecosystem. Additionally, the lawmakers suggest that a regulated ETF structure would offer greater investor protection compared to the current, less-regulated avenues for acquiring Ethereum.
The Road Ahead
The SEC is currently facing deadlines for decisions on several spot Ethereum ETF proposals. The letter from lawmakers arrives at a critical juncture, potentially influencing the regulatory body's final verdict. While the SEC has historically expressed concerns about potential market manipulation and investor protection in the cryptocurrency space, the recent Bitcoin ETF approvals suggest a shift towards a more open stance.
Potential Challenges
Despite the growing momentum, some hurdles remain. The SEC might still raise concerns about the volatility of the Ethereum market and the potential for manipulation. Additionally, unlike Bitcoin, Ethereum's underlying technology is constantly evolving, which could introduce complexities for regulators.
Conclusion
The bipartisan push for spot Ethereum ETFs signifies a growing recognition of the potential of cryptocurrencies within the US financial system. With lawmakers advocating for regulatory clarity, the SEC faces a crucial decision that could shape the future of Ethereum and the broader cryptocurrency landscape. Whether the SEC approves these ETFs remains to be seen, but the recent developments suggest a potential paradigm shift in the regulatory approach to digital assets.

$ETH chart's bearish RSI+MACD Divergence#eth #ethereum has formed the divergence in lower time frame. Sudden dump and pumps are expected till the ETF approval decision and later. Not financial advice.

ETH (Y23.P2.Video1). No surprises for ETH returning bullishHi Traders,
We talk about the macro outlook and what setups we can look for trading the current price levels.
I will be talking more about ETH with regards to BTC on YT and other metrics for how we see the market progressing.
Regards,
S.SAri

Ether Eyes $10,000: Could ETFs Be the Key, But Will We Have to WEther (ETH), the world's second-largest cryptocurrency, has been on a rollercoaster ride in recent years. After reaching all-time highs exceeding $4,000 in 2021, it has experienced significant volatility alongside Bitcoin. However, a new factor could propel ETH to new heights: the potential approval of Ether-based exchange-traded funds (ETFs) in the United States.
Why ETFs Matter for Ether
ETFs are investment vehicles that track the underlying value of an asset, like a basket of stocks or commodities. A successful Ether ETF would allow investors to gain exposure to ETH's price movements without directly buying and holding the cryptocurrency itself. This could be a game-changer for several reasons:
• Increased Accessibility: ETFs offer a familiar and regulated investment avenue for traditional investors who might be hesitant to enter the complex world of cryptocurrency exchanges. This broader investor base could significantly increase demand for ETH.
• Institutional Investment: The approval of ETFs would likely pave the way for institutional investors, such as pension funds and hedge funds, to allocate a portion of their portfolios to ETH. This influx of institutional capital could dramatically boost ETH's price.
• Enhanced Credibility: A green light from the U.S. Securities and Exchange Commission (SEC) for Ether ETFs would signify a level of regulatory acceptance for the cryptocurrency. This could bolster investor confidence and fuel a broader market rally.
The $10,000 Dream: A Catalyst for Ether
Analysts believe a well-structured Ether ETF could be the catalyst that pushes ETH towards the coveted $10,000 mark. Here's why:
• Demand Surge: As mentioned earlier, increased accessibility and institutional investment through ETFs could create a significant surge in demand for ETH, driving the price upwards.
• Supply Squeeze: Unlike Bitcoin, with a capped supply of 21 million coins, Ether has an issuance mechanism that creates new coins regularly. However, the recent Ethereum upgrade to Ethereum 2.0 is expected to significantly reduce the rate of new ETH issuance. This potential supply squeeze, coupled with rising demand, could propel the price.
• Market Sentiment: A successful Ether ETF launch could trigger a positive feedback loop in the cryptocurrency market. Increased media attention and investor interest could further amplify the price rise.
The Roadblock: Navigating the SEC Maze
While the potential benefits of Ether ETFs are undeniable, the road to approval is likely to be long and winding. The SEC has historically been cautious about cryptocurrency ETFs, citing concerns around market manipulation and underlying asset custody. Several Bitcoin ETF applications have been rejected in the past, and the process for Ether ETFs is expected to be similarly rigorous.
2025 on the Horizon: A Waiting Game for Investors
Experts predict that the SEC's approval process for Ether ETFs could drag on until 2025. This delay could dampen investor enthusiasm in the short term. However, it also presents an opportunity for the cryptocurrency industry to address the SEC's concerns and build a stronger case for regulation-compliant Ether ETFs.
The Takeaway: A Long-Term Play with High Stakes
The potential arrival of Ether ETFs in the U.S. is a significant development for the cryptocurrency market. While the wait might be long, the potential rewards for ETH's price could be substantial. Investors interested in this space should closely monitor regulatory developments and conduct thorough research before making any investment decisions.
This article is for informational purposes only and should not be considered financial advice. Always consult with a qualified financial professional before making any investment decisions.

Ether breaking up from bullflag.Very likely validating the breakout up from this flag with this big candle move/close today.. If so the target is all the way up at $5034. Reaching this price target can take price well above the purple line which is a neckline to a big inverse head and shoulders pattern. Once we were to trigger the breakout of the big inverse head and shoulders target we will likely be looking at a measured move target for it around 7300-7400! For now the current target to focus on is 5034, as it could still correct enough to dip back below the purple neckline after reaching the bull flags breakout target. Also chances at consolidations or pullbacks along the way to the bull flag target as well so tread wisely. *not financial advice*

ETHUSD - More Bull Evidence (MACD)Using the MACD on this monthly timeframe we can see a clear cross allowing bullishness on the monthly timeframe for ETH
Just another example of why the market should act very bullish currently.
MACD is a great indicator.

ETHUS - Daily BullishnessThe bullish activity is evident when you take a look at the descending RSI on this daily timeframe, while the price is moving up.
This is a huge divergence and I expect the breakout to be massive
The curved pattern in green is where I expect the breakout to occur, which it is very close to.

ETHUSD at a Crossroads: Long or Hold on Ethereum?`The Ethereum (ETH) price action against the US Dollar (USD) presents an interesting conundrum for traders. Recent price movements suggest a potential turning point, and the decision of whether to long (buy) or hold ETHUSD hinges on several key factors.
Prior High as Support: A Bullish Signal?
The current price of ETHUSD sits above a crucial support level – the prior high of around $2,915. This level acted as a resistance barrier in the past, but if breached and held as support, it can indicate a bullish reversal. In technical analysis, support levels are areas where buyers are likely to step in and prevent further price declines. A successful retest of this level strengthens the support and can signal a potential price upswing.
The 200-Day SMA: A Long-Term Trend Indicator
Another significant factor to consider is the 200-day Simple Moving Average (SMA). The 200-day SMA acts as a line of demarcation between a long-term uptrend and a downtrend. Currently, the 200-day SMA for ETHUSD sits around $3,100. If the price can break above this level and sustain it, it can be interpreted as a bullish sign, indicating a potential shift in the long-term trend.
Deciding to Long or Hold: Weighing the Evidence
While the prior high and the 200-day SMA suggest potential bullishness, there are reasons to be cautious before going long on ETHUSD. Here's a breakdown of the factors to consider:
• Market Volatility: The cryptocurrency market is notoriously volatile. Recent price swings highlight this, making it challenging to predict future movements with certainty.
• Macroeconomic Factors: Broader economic factors, such as interest rate hikes and inflation, can significantly impact the cryptocurrency market. Keeping an eye on these developments is crucial before making any trading decisions.
• Technical Analysis: While the prior high and 200-day SMA offer insights, they shouldn't be the sole indicators. Utilize other technical indicators like Relative Strength Index (RSI) and Stochastic Oscillator to gauge price momentum and potential overbought or oversold conditions.
Holding vs. Longing: A Strategic Approach
Given the current market uncertainty, holding ETHUSD might be a more conservative approach. This allows you to observe how the price reacts around the support level and the 200-day SMA. Here are some additional considerations:
• Dollar-Cost Averaging (DCA): DCA involves buying ETHUSD at regular intervals, regardless of the price. This strategy can help average out the cost per unit over time and potentially mitigate the risk associated with buying at a peak.
• Stop-Loss Orders: Implementing stop-loss orders can help manage risk. A stop-loss order automatically sells your ETHUSD holdings if the price falls below a predefined level, limiting potential losses.
Conclusion: Stay Informed and Adapt
The decision to long or hold ETHUSD depends on your individual risk tolerance and trading strategy. By closely monitoring the price action around the prior high and the 200-day SMA, alongside broader market factors and technical indicators, you can make an informed decision. Remember, the cryptocurrency market is dynamic, so staying updated on news and adapting your strategy accordingly is crucial for success.

Momenth of truth for ETHBTCI'll try and be as brief as possible in this one.
I believe this to be a pivotal month for ETHBTC.
Either we see a full-fledged no-excuses breakdown confirmed with a weekly close below the last wick on said timeframe, or I will continue to think that a macro low is being formed here.
There is everything you want to see here if you're going to take a bullish stance.
1) Confirmed triple bullish divergence on both 1D and 1W.
2) Fake break of structure with a dip down and then pop back up on the 1W.
3) Chance for a 55EMA and 200EMA death cross fakeout inbound on the 1W.
4) Stochastics ready to go back up on both 1W and 1M.
5) Six months and counting of price action hanging onto the lows without truly breaking down.
6) History of ETHBTC losing value after BTCUSD breaks all-time high, only to go back into an uptrend after a few weeks.
7) BTC.D painting a swing failure on the 1W with a confirmed bearish divergence and rejection of the RSI bullish control zone.
This might get all thrown out of the window tomorrow, but as long as the aforementioned points stand, I'll keep believing that one should exercise maximum caution in being bearish at this time and place.
A weekly close above the 55EMA before it crossed the 200EMA will make me even more of a believer of the bullish case.
If that happens, and ETHBTC can also trade above 0.061, I would have no more reason whatsoever to fear a breakdown, thus absolutely confirming a macro low, and looking for a higher valuation.
