BITCOIN CASH LONGS 💰💰💰Expect bullish price action on this coin as price is rejecting with a huge bullish momentum from 400$, we have a lot of liquidity that has been taken out on ,,support area,, where a lot of margin stops where sitting in my opinion.
We are going for the BUY SIDE LIQUIDITY above 600$
What do you think ? Comment below..
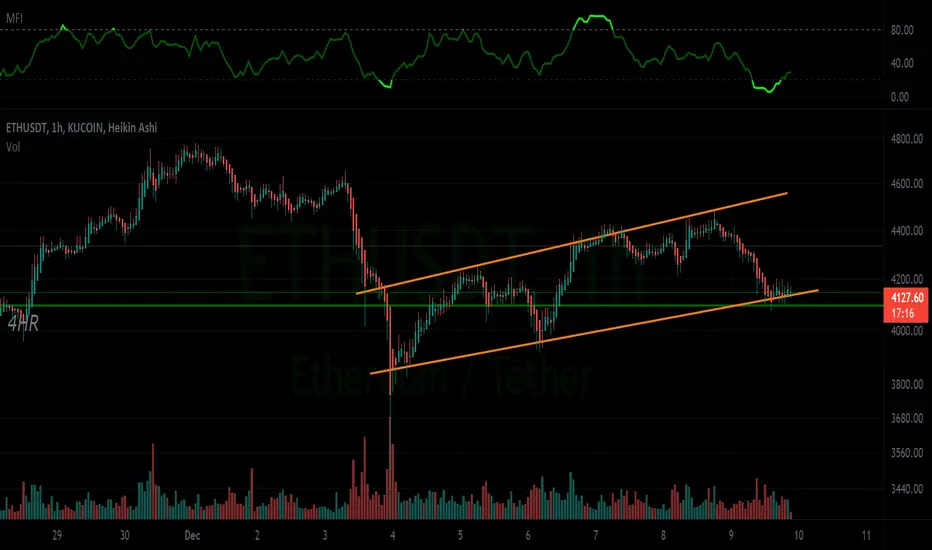
Ethereum-bitcoin

ETHEREUM (Daily) : Bull or Bear ? $ETHThe price is in a significant support range, which is currently trading in the $ 3800 range. If this important support is lost, the price target will be in the range of $ 3100 to $ 3300, and if this support is not lost, the next important targets will be $ 4700.
Follow our other analysis & Feel free to ask any questions you have, we are here to help.
⚠️ This Analysis will be updated ...
👤 Arman Shaban : @ArmanShabanTrading
📅 20.DEC.2021
⚠️(DYOR)
❤️ If you apperciate my work , Please like and comment , It Keeps me motivated to do better ❤️

ETH/BTC need some support I guessThere is a trendline support which has no guarantee by looking at the amount of time it has tried to break. There there is a 50% weekly fib retracement which is probably acting like a resistance, there there was a run from 78.6% fib level to 50%, what a run which needs to calm down a bit. So where is the confluence??? at around .072 there is support/resistance/fib levels/this/that and so many things. Just meet me at .075 first and I will take a look and catch it at .072. if not it's a nice setup to sell more at monthly 38.2% monthly fib. This is my opinion. IT'S OK TO BE WRONG, We are all learning together in tradingview. Good luck.

ETH - Potential Bearish Pattern Detected It appears ETH is breaking down from a falling wedge, looking to target the next monthly support level.

alt season is still coming bitcoin will continue to go sideways and correct further to the down side while we enjoy alt season

SOL lets see how this play's outSolana has been in a bullish trend for a while and I do not see it ending anytime soon.


YO YO! WE BULLISH! ETHIm typing to please the AI...
The pic says it all, just wanted everyone to be "all bets on" and take our money back!
LETS GET THIS MONEY FAMILY $$$
MY SETUP ETHThis is how i organize my futures trading chart for any asset.
Will eth pop into the upper chan? Let me hear what u think!..


Can Ethereum Regain Highs??Ethereum made a run for higher levels, after crossing the vacuum zone to $4258, and punching through the cluster of levels above. The rally seemed to lack characteristic aspects of proper crypto pumps like large green candles on the 30 min chart and a large bull run in the Kovach OBV. Furthermore, we are seeing some red triangles on the KRI starting to form suggesting that we are beginning to encounter resistance. If so, we could easily break down through those cluster of levels at $4351 and $4258, and cross through the vacuum zone to support at $4020. Otherwise, $4670 is the next target.

ETH-BTC OMICRON POWERs up ETH against BTC! New ATHs for ETH!Interval: 4hrs
Description: Interval taken for 4 hrs, Ethereum gaining major leg on BTC!

Ethereum 8K or 2K First?Hello all!
Ethereum has been outperforming Bitcoin during this bull cycle. Ethereum is still holding the triangle support, 200ma (daily), and the trend curve from Sep. 2020. A break out from this resistance can push Ethereum into a complete parabola following the curve.
However, always keep in mind the market is still mainly decided by Bitcoin. If Ethereum broke all of these support levels expect a violent fall to our key support levels and expect bounce as those key levels.

TOTALMCAP Analysis - All you need Comparison zones in green
Resistance turned support zone in blue
Support areas in yellow
Heading for a June 2022 top!
Falling wedges are a very apparent bullish pattern also

Relative strength of Ethereum over BitcoinIt might be a stretch to do technical analysis on a ratio of two individual cryptos, but I have been interested in the ratio of ETH/BTC from a fundamental perspective with the premise that $ETH is more functional going forward. There has been an odd behavior that I don't understand with a character of quick increases followed by 1-2 month linear decays. This character might be resolving soon as $ETH reaches a higher relative strength of coming out of this last correction.
A look at the weekly also points to higher relative strength of $ETH returning.

Etherume and Bitcoin .As you know, one of the signs of starting an Altcoin party is checking the Atrium vs. Bitcoin chart.
We have some interesting points in the weekly time frame:
- We have a long-term uptrend line of 1729 days
- The long-term downtrend line of 1400 days is broken
- In the MacD indicator, the downtrend is over and the first green candle appears and the MacD line and the signal intersect
- CCI indicator has gone above +100
- The RSI indicator has not yet entered the saturation zone
- The trading volume in the Valium indicator has been better than in the last 7 weeks
- In the last 245 days, the flag pattern has been formed and the targets will have 24%, 48% and 80% potential profit.
- In the last 1281 days, we are also witnessing the formation of a cup pattern! According to this model, the potential for growth and profit of 71% is not far from the mind
- The Ichimoku indicator is also in a good uptrend
Good luck and profitable

Ethereum and BitcoinETHBTC is breaking out of what might be an ascending triangle pattern with a nice bullish candlestick. Together with the bullish MACD crossover, this signals higher prices ahead for crypto.

HEX bearish AF Daily 21 EMA is sloping down.HEX ready to retest BB lower band .DMI ADX is neutral bearish --->HEX bearish AF !but every sell under .18c is a buy ....whales are accumulateing under 18c .Buyers and sellers are fighting.Who will win, is everybody`s guess.
HEX neutral :over .225c
HEX bullish :over 29c on daily close.
Downside targets ....nothing changed since my last update : 0.125c ,~10c and ~0.085 c.
I dont expect lower prices ATM and pretty much never.

Ethereum vs Bitcoin Set To New All-Time High!We are looking at ETHBTC (Ethereum) long-term, this is the monthly chart.
The stage is set for new All-Time Highs.
ETHBTC is looking strongly bullish.
We have the cup pattern clearly marked, which shows that any correction is in the past and already over.
We have prices trading above EMA50 and flying above EMA10.
We have a bullish count on the TD Sequential indicator, with plenty of room left available for growth.
The MACD is looking good.
The RSI is super strong.
It will be sudden and when it starts it will just go and go and go...
50% can be done easily, then the last ATH and 189% as the new jump.
There can be more...
We will let market take care of the rest as our strategy is simply to buy low and hold, just wait for the prices to go up.
Namaste.

Cryptos: buy the stoploss that you would have planned for.Crypto is trappy, but the bullish trend is still intact. If you want to buy the dip, buy the stoploss. Not saying it will work out, but trap is just way too common here in this market.

Ethereum ETF in the Works!! What this Means or Ethereum PricesEthereum has gotten a lift from a strong support level at $4450, as we anticipated yesterday. We are currently in the range between $4450 and $4670, also predicted yesterday. Kelly Strategic Management has filed for an ETF on Ethereum futures. Watch how the SEC responds to this, as ETH should rally on positive news regarding this ETF. But for now, We anticipate the price to stabilize in the current range. If not, we have support levels from below at $4341 and $4258, with a vacuum zone down to $4020. From above we have one more level at $4748 before we can consider highs at $4858 again. We have strong confidence that ETH will be holding the $4K handle for now.

ENS to $100+Paper handed sellers capitulated. Bigger players provided with long liquidity. $100+ incoming.

Olympus DAO (OHM) Critical Support Area Must Be HeldOlympus DAO (OHM) has been in a downtrend since October 15th and now we're facing a major area of support at around $670 that needs to be held at the 0.382 Fibonacci level of $668. If we cannot hold this level then we will probably head back down to the 0.236 Fibonacci level of $475 which is not too pretty.
As of right now we're trying to see where Olympus DAO finds its new swing low before another change of trend. Once we break this downtrend I do believe we will run back up to around $900 given that is where most of the price recognition and action has occurred at.
Much peace, love, health, and wealth!
