The ETH low for BTC pairing may be inSimple support analysis structure shows that we may be at a bottoming point for ETH compared to BTC and a 4 month time horizon may show sizeable gains when comparing the two cryptos, with ETH outperforming BTC.
Best of luck trading.
Ethereum-bitcoin

ETH to BTC Fractal (Y20.P6.E1).ComparisonHi All,
Many people expect ETH to out perform BTC in the long run in terms of ROI...I tend to agree.
Reasons are many,
As for the chart, BTC was the first and has left its historical chart from it early days.
Followed by LTC and then ETH some years later.
So is it fair to use that trend with a new product many years later and assign this fractal...might be right.
However back then, the market conditions were different and ETH wasn't that hyped....now its more with industrial potential.
Hence I think its fair to compare this fractal.
I was listening to 1 commentator who said that the whales might push ETH down to the low $500s levels where many would have entered, grab that liquify and for them fill their orders as
ETH has big potential. Who knows when...but 1 thing for sure, 2021 is going to be big for crypto and the stock moarkets.
My thoughts:
Early next year is ALT season, Jan or Feb.
One must have a healthy portion of ETH when that happens.
For now, I'm 95% BTC, next ETH and then others.
Just waiting for that signal to flip to the ALTs.
We are weeks away from that in my opinion.
All the best with trading.
S.SAri.
ref.M.chart

Short term ETH/BTC tradeIf you like fibs.
Heres an idea playing out right now, if the ratio can hold its current level we could see a nice bump in the ratio here.

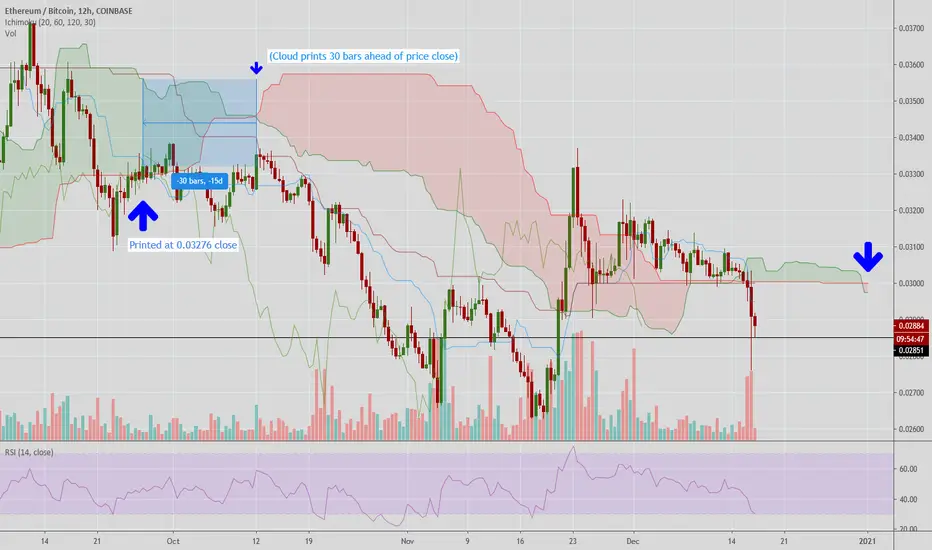
12H ETH/BTC Bearish Kumo TwistThe 12H ETH/BTC ichimoku cloud is printing a bearish flip, but a ~29 RSI reading has me cautious on shorting quite yet. With BTC in blue sky breakout, shorting ALT/BTC pairs seems like a high-probability way to accumulate more sats.
Outlook on Ethereum as BTC breaks ATH:BULLISHSimple chart, enjoy doing charts for you, doing this live as we see the pump, volume is high, stay safe out there.
No clear resistance till 850
Weak resistance at 620-630 Range
Definitely no longer a point of entry
The risk of entering at such a point is too high, a short trade would be more reasonable
I would not recommend trying to short a chart like this, it is like throwing money away.
-Bo Sukas
SHARE&LIKE&COMMENT
BINANCE:ETHUSDT BINANCE:ETHBTC COINBASE:ETHUSD KRAKEN:ETHUSDT

KAVA Descending WedgeThis one looks like a great set up. There's been some huge volume and then a steady decrease during this descending wedge .
At the moment on lower timeframes it is edging along the top resistance, which is a good sign
Wait for a breakout, retest and resumption on at least the 4Hr chart.
Depending where it breaks the wedge (I'm guessing it will be tomorrow), a measured move should take it somewhere around the first major resistance, which is a bit of extra confirmation that this move should play out.
I won't take any profits there as this looks like a big accumulation that will fly.
I will take 50% of profits at Target 2 and then let the rest run as high as it can, with current target somewhere in the range of 3.5 - 3.9
If it can break the second target, it's got a pretty clear run to at least 3.5

Are you interesting to accumulate Ethereum? Check out!!!Ok, i wanting to show you if you're an Ethereum holder, Ethereum investor or simple Ethereum enthusiastic. But, there're any thing taht you will need to know.
If you have 10 ETH right now, noticed that if you save your 10 ETH still hold your Ethereum assets when the value in Etherum reach up 0.1 BTC, you get your first and your own 1 Bitcoin. Now, looking this diagram, it's easy to know. My strategy consist to find up 30% monthly with a risk management of 15% monthly.
So, if you follow this strategy. You can to get your first Bitcoin, your own Bitcoin or your 1 BTC to medium to long term when Ethereum grow up the Bitcoin value.
It's for that reason that I'm so enfocous a lot in Ethereum to accumulate this assets making trading consistent throughts of the months.
Look this strategy:
First Month: If you starting with 1 ETH = 30% = 1.30 ETH you end with earns of 0.30 ETH
Second Month: 1.30 ETH = 30% = 1.69 ETH
Thrid Month: 1.69 ETH = 30% = 2.20 ETH
Fourth Month: 2.20 ETH = 30% = 2.86 ETH
Fifth Month: 2.86 ETH = 30% = 3.71 ETH
Sixth Month: 3.71 ETH = 30% 4.83 ETH
Seventh Month: 4.83 ETH = 30% 6.27 ETH
Eight Month: 6.27 ETH = 30%= 8.16 ETH
Nineth Month: 8.16 ETH = 30% 10.60 ETH
With 10 ETH it's the minimum if you want to take this plan!!! You would get time 9 months to accumulate your own 10 ETH for this smart plan. Now, you can to accumulate over 10 ETH if you want just apply the compount interest to find up 30% monthly not enfocous in the U.S. Dollar in the value of your Ethereum. You should need to enfocous more to accumulate in the Ethereum assets and value of your own Ethereum assets.
Example: If you have 1.50 ETH and the value it's right now $588 USD. You have $882 USD in your Ethereum assets. The most inteligent it's open up a trade with this value. Example: $882 USD in BTC in your trading, $882 USD in LTC in your trading to enfocous more to accumulate Ethereum assets in the value. Now, to calculate your risk management it's 15%, that mean your own risk will be 0.85 ETH in the end of the month. That's simple. The key it's enfocous to accumulate Ethereum assets consistent throught of the time. .
I reccomend the Quantfury App, in Quanfury you can to trade cryptocurrency, stocks market, Forex, futures, commodities, bonds and more. I just use Quantfury to trade Cryptocurrency. Also, there's another best broker that I know and that it's called Prime XBT. Also, using Bitcoin deposit method you can to apply the same strategy if you want to accumulate satothis using and find up 30% monthly with 15% of risk management.
But right now I'm enfocous more in Ethereum!!!
So, in the future later that cryptocurrency pass the bull rally and then, stating the bearish trend. I will going to accumulate more Ethereum again for the future using the same strategy to get the compount interest. So, If I want to accumulate 10 ETH, I'd interesting in the future to accumulate maybe 100 ETH later of the bull rally of cryptocurrency. And why not 500 ETH, or 1,000 ETH thoughout of the time.
So, to say you, my strategy it's simple accumulate 10 ETH, and that it's all. So, in summary for accumulate 10 ETH we would need the patience and big discipline to reach our dreams how we want.
In this chart it's the ETH/BTC or Ethereum/Bitcoin and that I explain why ETH it's growing up agains the BTC value or Bitcoin value. And it's so interesting to accumulate Ethereum right now independent how much Ethereum you have in your hand. But that strategy that I show it's for people to understand how the altseason work.

Ethereum ETH, The 550 - 620 Range, Part 2This analysis played out pretty well, with the drop (bit extended) inside that green box and bouncing pretty hard since. Now past half day it has been dropping again just like the rest of the market and also has reached a key point it seems. ETH should hold 550/547 zone from now on, because then the previous analysis with the arguments i gave still make sense.
As you can see on the right, it seems that curved line was real, because yesterdays bounce got rejected from that line again. Which makes it easy to say that as long as it moves below it, it shows bears are in control. Which also says that the first big level bulls need to break is that same line, which is around 570 now. The 570 is i think similar to the 18.500/600 for Bitcoin.
So on the downside, 447/450, below that level the only support zone i see is around 500/510. Actually, assuming the channel is real, it could give support around 525ish as well. On the upside its a harder road, with the first resistance around 560 and then the important curved line resistance around 570. The 580 seems to be a level as well, but think the 590/600 zone might be the biggest resistance, which stands in the way for news highs this year for ETH.
Don't forget to like if you appreciate this :)
Previous analysis:

$ETHBTCI'm 3x long, risk-tuned out 3%.
Sam may try to stop, but he will be fruitless in the end.
I want .040.
Ethereum will outperform Bitcoin on almost every metric.
Play the quarter.

2 Bull Flags 1 WedgeETH, LINK, and BTC are all in descending channels.
LINK looks more like a descending wedge than the others, while ETH and BTC look more like Bull Flags.
In any case, go long off the bottom, or wait for a break out of the top of the channel for more confirmation.

ETH ABOVE FIB CHANNEL GOLDEN POCKET ZONEvery very strong support. sell if we get a daily close under. Target 1000's. Probably leads bitcoin up

Predicted 20% drop from $600 with 100% accuracy 20hrs beforefollow up to my doomsday scam wick post hope y'all made money

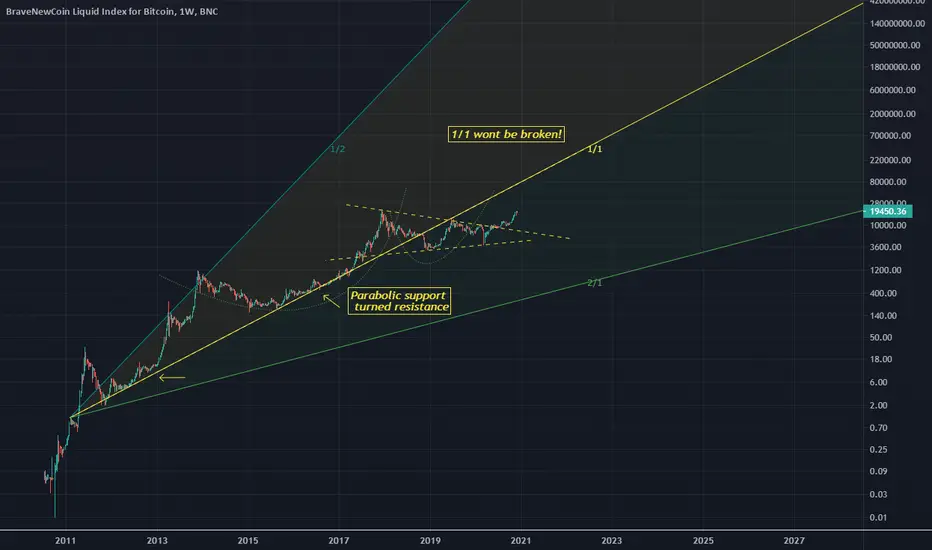
ETH > BitcoinMy rational thought behind a bearish bitcoin scenario vs Ethereum long.
As you can see you 1/1 line has been broken.
A support (along the 1/1) (indicated with yellow arrow) is now resistance (1/1)
Scalability is everything.
I have linked a more detailed version of this here
Bixley
Ethereum Ascending Triangle - Bullish Continuation?$ETH is forming an ascending triangle on the 1H timeframe, succession of higher lows and repeated tests of the resistance around $602. If resistance breaks we'll be looking back up at the high of $635.70, stop losses in place beneath the ascending trendline incase of a breakdown.

Bitcoin is close to a decision point!Hello everyone,
Bitcoin has seen a fantastic rally over the last months. We've managed to reach all the way to the all-time highs.
There hasn't been any serious pullback yet.
I've found a bearish divergence on the daily timeframe in the RSi and a rising wedge pattern.
The target of the rising wedge is calculated by the height of the wedge, so around 16200.
If the rising wedge is to complete, we will see one more pump towards 20k and then a real pullback will start.
However, that being said, if bitcoin manages to clearly pump above 20200 and actually closes there, I think much higher prices are in play.
Thanks for reading my analysis,
Goodluck!

ETH Weekly Bull Run TargetLooking at previous ETH bull-run (remember, there has only been 1) and looking back at BTC and what we may be able to expect. Often times alts run a little hotter than BTC and therefore I expect a run to about $27k (about a 55 to 60x return) over the course of the next year.
Best of luck trading.
