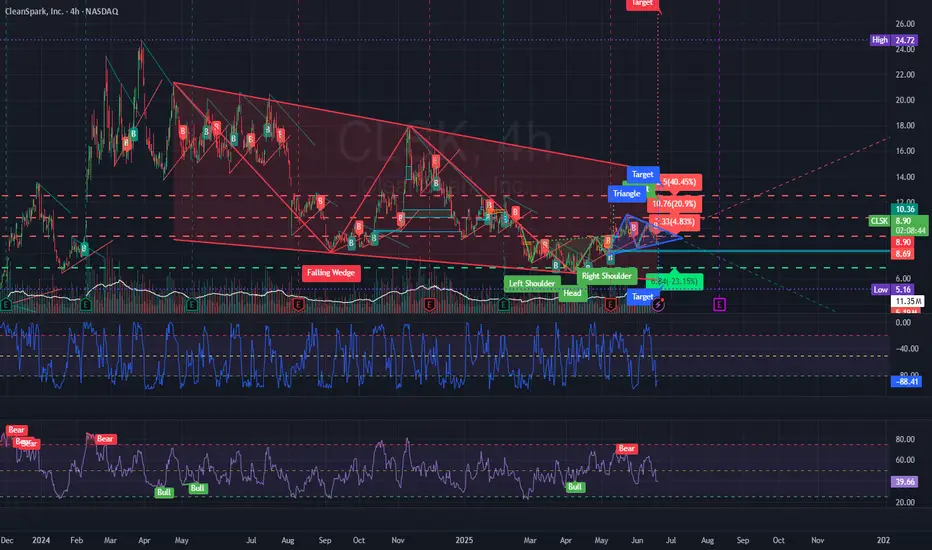
CLSK Going to $27There is always a downside, but I believe Risk vs Reward is here. It's not if, it's when. If we breakout to the downside of the triangle then we will test the support and the bottom of the wedge. If we break to the top of the triangle then we go for the breakout of the wedge and on the way to $27. I am adding at these levels and of course if it goes down, I am adding more.
Ethereum (Cryptocurrency)
ETHUSD Is Very Bullish! Buy!
Take a look at our analysis for ETHUSD.
Time Frame: 10h
Current Trend: Bullish
Sentiment: Oversold (based on 7-period RSI)
Forecast: Bullish
The market is on a crucial zone of demand 2,508.60.
The oversold market condition in a combination with key structure gives us a relatively strong bullish signal with goal 2,717.66 level.
P.S
Please, note that an oversold/overbought condition can last for a long time, and therefore being oversold/overbought doesn't mean a price rally will come soon, or at all.
Disclosure: I am part of Trade Nation's Influencer program and receive a monthly fee for using their TradingView charts in my analysis.
Like and subscribe and comment my ideas if you enjoy them!

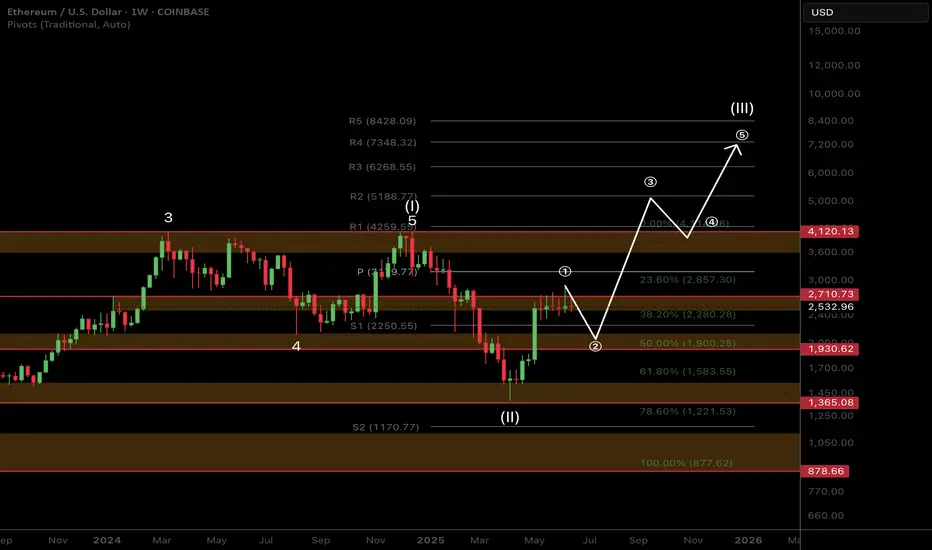
ETH Macro Analysis☕ 𝙂𝙈. CRYPTOCAP:ETH Macro analysis update...
📈 𝙇𝙤𝙣𝙜 𝙩𝙚𝙧𝙢 outlook remains unchanged and recent price action printing a doji. Target is still $7k for this cycle.
📉 𝙎𝙝𝙤𝙧𝙩 𝙩𝙚𝙧𝙢 outlook has investors looking lower towards the $1900 target but this isn't guaranteed to be reached and price action may front tat $2200.
War escalation's and retail selling are keeping price suppressed. ETF inflows and staking continue to grow!
The time for patience continues. Money is made in the sitting, weathering volatility, not flipping in and out of trades on every bit of news and price movement
𝙏𝙚𝙘𝙝𝙣𝙞𝙘𝙖𝙡 𝘼𝙣𝙖𝙡𝙮𝙨𝙞𝙨
Price is consolidating at its recent highs. Consolidation under resistance has high probability of breaking out, the longer it remains the higher the probability.
Elliot Wave (EW) analysis suggests a motif wave ended at the $2700 resistance, with a wave 2 retracement underway, likely a shallow one.
Safe trading
$banana PARALLEL CHANNEL ON BANANA GUN$banana parallel channel on banana gun.
Have we bottomed?
Do we now go to the top of the parallel channel?
I think we go there in june.
Q3 aka july, aug, sep going to be consolidation
Q4 we begin the bull run.

Ethereum H1 | Potential bearish reversalEthereum (ETH/USD) is rising towards a pullback resistance and could potentially reverse off this level to drop lower.
Sell entry is at 2,543.15 which is a pullback resistance that aligns with the 38.2% Fibonacci retracement.
Stop loss is at 2,625.00 which is a level that sits above the 61.8% Fibonacci retracement and a swing-high resistance.
Take profit is at 2,451.35 which is a multi-swing-low support.
High Risk Investment Warning
Trading Forex/CFDs on margin carries a high level of risk and may not be suitable for all investors. Leverage can work against you.
Stratos Markets Limited (tradu.com ):
CFDs are complex instruments and come with a high risk of losing money rapidly due to leverage. 63% of retail investor accounts lose money when trading CFDs with this provider. You should consider whether you understand how CFDs work and whether you can afford to take the high risk of losing your money.
Stratos Europe Ltd (tradu.com ):
CFDs are complex instruments and come with a high risk of losing money rapidly due to leverage. 63% of retail investor accounts lose money when trading CFDs with this provider. You should consider whether you understand how CFDs work and whether you can afford to take the high risk of losing your money.
Stratos Global LLC (tradu.com ):
Losses can exceed deposits.
Please be advised that the information presented on TradingView is provided to Tradu (‘Company’, ‘we’) by a third-party provider (‘TFA Global Pte Ltd’). Please be reminded that you are solely responsible for the trading decisions on your account. There is a very high degree of risk involved in trading. Any information and/or content is intended entirely for research, educational and informational purposes only and does not constitute investment or consultation advice or investment strategy. The information is not tailored to the investment needs of any specific person and therefore does not involve a consideration of any of the investment objectives, financial situation or needs of any viewer that may receive it. Kindly also note that past performance is not a reliable indicator of future results. Actual results may differ materially from those anticipated in forward-looking or past performance statements. We assume no liability as to the accuracy or completeness of any of the information and/or content provided herein and the Company cannot be held responsible for any omission, mistake nor for any loss or damage including without limitation to any loss of profit which may arise from reliance on any information supplied by TFA Global Pte Ltd.
The speaker(s) is neither an employee, agent nor representative of Tradu and is therefore acting independently. The opinions given are their own, constitute general market commentary, and do not constitute the opinion or advice of Tradu or any form of personal or investment advice. Tradu neither endorses nor guarantees offerings of third-party speakers, nor is Tradu responsible for the content, veracity or opinions of third-party speakers, presenters or participants.

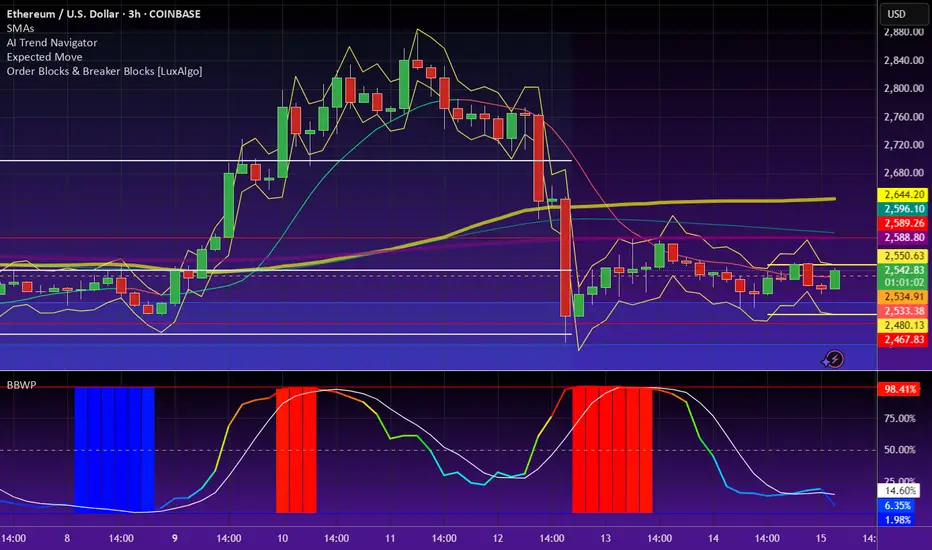
Breakout point: 2706.15
Hello, traders.
If you "follow", you can always get the latest information quickly.
Have a nice day today.
-------------------------------------
(ETHUSDT 1D chart)
The key is whether the price can rise above the important support and resistance area of 2419.83-2706.15 and maintain it.
Therefore, when the 2706.15 point is broken upward, it can be said that a breakout trade is possible.
The conditions for a breakout trade are:
- OBV must rise above the High Line and be maintained,
- OBV oscillator must show an upward trend,
- StochRSI indicator must show an upward trend.
However, it is better if StochRSI indicator has not entered the overbought zone.
When the rise begins, the resistance zone is expected to be around 3265.0-3321.30.
-
Although funds are continuously flowing into the coin market, it may feel like the trading volume has decreased.
The reason for this is thought to be that BTC dominance is generally showing an upward trend.
The meaning of BTC dominance rising means that funds in the coin market are concentrated toward BTC.
Therefore, I think that the overall trading volume has decreased because more funds are needed for the price to rise.
When the altcoin bull market begins, more transactions will occur, which will make you think that liquidity has increased in the coin market.
Therefore, for the altcoin bull market to begin, the BTC dominance must fall below 55.01 and remain there or continue to fall.
If the USDT dominance remains below 4.97 or continues to fall, the coin market is likely to rise.
At this time, depending on the BTC dominance mentioned earlier, you can distinguish whether the rise is focused on BTC or whether the altcoin is also rising.
If the BTC dominance continues to rise, most altcoins are likely to gradually move sideways or fall.
Therefore, if you are trading altcoins in this situation, I think it would be useful to increase the number of coins (tokens) corresponding to profit while responding quickly and briefly.
In other words, it means selling the purchase amount (+including transaction fees) when the price rises by purchase price, leaving the number of coins (tokens) corresponding to profit.
The coins (tokens) increased in this way are coins (tokens) with an average purchase price of 0, which will reduce the psychological burden when the altcoin bull market begins, allowing you to obtain a good average purchase price.
-
Thank you for reading to the end.
I hope you have a successful transaction.
--------------------------------------------------
- This is an explanation of the big picture.
(3-year bull market, 1-year bear market pattern)
I will explain more details when the bear market starts.
------------------------------------------------------

Ethereum Holds the Line – Is $2,300 the Key to the Next Rally?By examining the #Ethereum chart on the weekly (logarithmic) timeframe, we can see that after rising to $2,880, the price faced selling pressure and corrected down to $2,500. This upward move created a large Fair Value Gap (FVG) between $1,870 and $2,300, which is likely to be filled in the medium term if the price drops further.
However, as long as Ethereum continues trading above the $2,300 level and does not close below it, we can still expect further bullish movement.

HolderStat┆ETHUSD continues to accumulateOKX:ETHUSDT is catching bids at the 2.50 k rail after triangle retest, converting shakeout into upside continuation. Staying above 2.40 k keeps bias north; clearing 2.75 k releases the 3 k target rocket 🚀

BTC Dips After ATH – $100K Support in Focus Amid TensionsBy analyzing the #Bitcoin chart on the weekly timeframe, we can see that after rallying to $111,980 and printing a new all-time high, price faced a correction down to $100,000.
Currently, Bitcoin is trading around $105,700, and with geopolitical tensions escalating, particularly the risk of war, we could see further downside — potentially taking price as low as $90,000.
However, if BTC manages to hold above the $100,000 level, there’s a strong chance we’ll see a short-term rally toward $120,000.
This analysis will be updated as the situation evolves. Stay tuned!
Please support me with your likes and comments to motivate me to share more analysis with you and share your opinion about the possible trend of this chart with me !
Best Regards , Arman Shaban

DeGRAM | ETHUSD held the trend line📊 Technical Analysis
● Price just printed a long-tailed rebound on the 4-month purple up-trend and the 2 520-2 560 demand strip, also reclaiming a broken pennant base—confirming a fake breakdown and locking the zone as fresh support.
● A higher-low sequence is compressing against the descending 2 650 trend cap; a 4 h close above it activates the 2 723 horizontal target and projects the channel-median swing toward 2 865.
💡 Fundamental Analysis
● Net staking deposits keep outpacing withdrawals while CME ether futures open-interest hit a six-week high, signalling renewed institutional hedging ahead of the spot-ETF ruling and supporting upside bias.
✨ Summary
Buy 2 540-2 580; clearance of 2 650 aims 2 723, stretch 2 865. Invalidate below 2 450.
-------------------
Share your opinion in the comments and support the idea with like. Thanks for your support!
Safello Group AB - Bullish Outlook - Small Cap Crypto Firm Safello is starting to show signs of a breakout from its weekly triangle. If Bitcoin or altcoins start to show life, I believe this stock could outperform most crypto stocks. The company is constantly innovating its offerings and is regulated under Swedish law.
I have been DCA’ing into this stock for quite a while now and will continue to do so until the consolidation is over.
Current market cap is about 10 Million USD.
Nothing here should be considered financial advice. Always do your own research and make your own decisions.
OMXSTO:SFL
CRYPTOCAP:OTHERS
CRYPTOCAP:TOTAL
COINBASE:BTCUSD
NASDAQ:COIN
COINBASE:ETHUSD

Bitcoin Or Gold? Real Safe Haven In Middle East tension When the world shakes, where does money go— Bitcoin or gold ?
You may think crypto is the ultimate safe haven… but data tells a different story.
This breakdown compares digital dreams vs. physical trust —with charts, tools, and the psychology behind every move.
Hello✌
Spend 3 minutes ⏰ reading this educational material.
🎯 Analytical Insight on Bitcoin:
Contrary to common expectations, Bitcoin has shown relative resilience amid recent geopolitical tensions, refraining from a sharp sell-off.
This price behavior signals a potential shift in market psychology—something I’ll explore further in an upcoming educational post.
Based on my previous analyses, I continue to anticipate an upward breakout above the $110K resistance zone in the current structure.
Now , let's dive into the educational section,
📌 Gold: The Legacy of Trust
For thousands of years, gold has been the go-to safe asset. In wars, inflation, sanctions, and crashes—it remains the mental anchor of value. Tangible, historic, and out of government control.
🪙 Bitcoin: Revolutionary but Unstable
Bitcoin promises freedom, decentralization, and anti-inflation. But during actual crises, trust wavers. High volatility, regulatory risk, and lack of a long history make investors hesitate when fear hits hard.
🛠️ TradingView Tools That Reveal Where Smart Money Flows
One reason TradingView stands out is its wide set of tools that help you track market psychology—not just price action. When it comes to analyzing the Bitcoin-vs-Gold battle during global crises (like the Iran-Israel war), these tools are essential:
Correlation Coefficient: This shows how closely BTC and gold move together. In panic moments, it helps reveal where the real trust is flowing.
On-Balance Volume (OBV): Key for spotting where big money is headed. If OBV on gold rises while BTC’s falls, smart money isn’t betting on crypto just yet.
Fear & Greed Index Logic (DIY): While not a native TradingView tool, you can mimic it by combining volatility and volume indicators to reflect market emotion.
Overlay XAUUSD and BTCUSD: Place both on a single chart with “percentage scale” enabled. You’ll see exactly which one holds up better during chaos.
Marking Geo-Political Events: Tag key events (like missile strikes or sanctions) on your charts. Track how Bitcoin and gold react immediately after.
📊 How Investors React in Crisis
During events like an Iran-Israel war, data shows money often flows into gold—not BTC. When panic peaks, people run toward the “known,” not the “new.”
🧠 The Illusion of Crypto as Safe Haven
We want to believe BTC is the new gold. But the human mind—under threat—defaults to ancient instincts. Fear doesn’t innovate. It runs to what it knows: shiny, physical, historical gold.
💡 When Will Bitcoin Truly Compete?
When the next generation fully embraces digital assets. When institutions store BTC alongside gold. When BTC no longer crashes on scary headlines—that’s when the shift becomes real.
⚠️ Lessons from War
Wars reveal that markets don’t behave rationally in fear. Even if Bitcoin makes sense on paper, emotion drives flows. Right now, that flow still favors gold.
🔍 What to Watch Next
If, during a future conflict, Bitcoin drops less—or even rises while gold does—you may be witnessing a turning point. Until then, keep tracking both with your TradingView setups.
🧭 Final Takeaway
Gold still owns the trust game in a crisis. Bitcoin is on its way but hasn’t crossed that psychological line. If you’re a smart trader, know how to read both—and move before the herd does.
✨ Need a little love!
We put so much love and time into bringing you useful content & your support truly keeps us going. don’t be shy—drop a comment below. We’d love to hear from you! 💛
Big thanks,
Mad Whale 🐋
📜Please remember to do your own research before making any investment decisions. Also, don’t forget to check the disclaimer at the bottom of each post for more details.

ETH didn’t rally — it cleared inefficiency and pausedThis isn’t the move. This is the setup for the move.
ETH tagged 2658.22 — premium — and stalled right where Smart Money pauses before redistributing or rotating.
Here’s how this lines up:
Price swept into the 0 fib (2658.22), then hesitated — that’s not weakness, that’s precision
Just below sits a clean FVG at 2594–2575, right between the 0.382–0.5 fibs
Below that: OB near 2527–2492 — last line of defense before momentum flips
Right now, ETH is offering a reactive pullback opportunity. If bulls hold 2594–2575 with a bounce, we rotate higher again. But if they don’t — 2527 becomes the decision zone.
Execution lens:
Ideal re-entry zone: 2594–2575
Invalidation: sustained close below 2555 = expect OB tap
If FVG holds, expect revisit of 2658 → extension toward 2680s
This setup isn’t done. It’s developing. Wait for price to speak — not hope.
For more plays built like this — mapped in advance, not after the fact — check the profile description


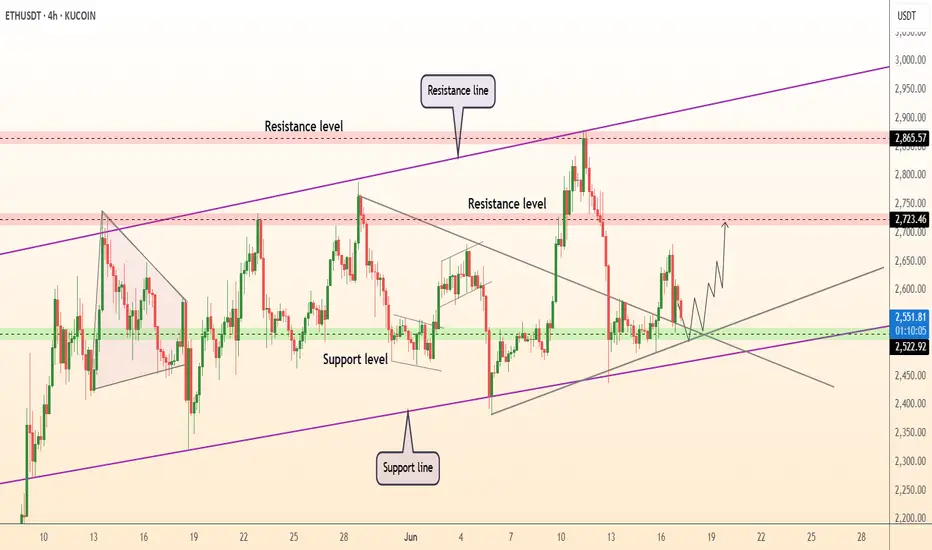
ETH/USDTEthereum (ETH/USDT) is currently maintaining its bullish momentum above a well-respected ascending trendline that has been active since early April. After a strong breakout above the 2347 level, the price entered a consolidation phase between 2600 and 2800, suggesting that the market is preparing for its next significant move. As of now, ETH is trading near 2627 and forming higher lows, which is a positive sign of buyer strength.
The key support zones are located at 2347 and 2266, while resistance levels to watch are 2768 and 2834. As long as the price holds above the ascending trendline, the bullish structure remains intact. A bounce from the current region, especially near the trendline, may present a favorable long opportunity. In such a scenario, a breakout above 2768 could open the path toward 2834 and potentially higher levels in the medium term.
A suitable long setup would involve entering around the 2620–2640 zone with a stop loss below 2347 to protect against trend invalidation. The first profit target can be set at 2768, and the second at 2834. However, traders should remain cautious: if ETH breaks below the trendline with strong bearish volume, the bullish outlook would weaken, and the price may revisit lower supports. Until then, the market structure favors buying the dips in alignment with the prevailing uptrend.

Ethereum’s 19-Day ETF Inflow Streak: What Really HappenedEthereum’s 19-Day ETF Inflow Streak: What Really Happened to Price, Structure, and Sentiment
Table of Contents
1. Executive Summary
2. ETF Backdrop: How the 19-Day Inflow Wave Took Shape
3. Chronology of Price: Day-by-Day Performance
4. Weekly Chart Anatomy: The “Pre-Tower Top” Signal Explained
5. Intraday Technicals: From $2,450 Low to the $2,620 Hurdle
6. On-Chain & Derivatives Lens: Funding, OI, CEX Balances
7. Fundamental Undercurrents: Dencun Afterglow, L2 Fees, Staking Yields
8. Risks & Catalysts: ETH vs. Macro, vs. BTC Dominance, vs. SEC Noise
9. Playbooks for Traders and Long-Term Allocators
10. Conclusion: A Pause, Not a Peak—If Key Levels Hold
________________________________________
1. Executive Summary
• Ethereum received 19 consecutive days of net inflows into spot-linked exchange-traded products (ETPs) totaling $1.37 billion, the longest positive streak since the 2021 bull-run.
• Over the same period ETH/USD rose 18.4 %, printing a local high at $2,750, but has since pulled back to $2,575 amid broad crypto risk-off and Middle-East tensions.
• The latest weekly candle morphs into a “pre-tower top” pattern—two tall green candles followed by a small-bodied doji—often a harbinger of heavy distribution if confirmed by another red week.
• Short-term structure improved Monday: price pierced a contracting-triangle ceiling at $2,550, reclaimed the 100-hour SMA, and now eyes $2,620 as the gatekeeper to renewed upside.
• Funding rates flipped neutral, exchange reserves hit a 7-year low, and staking deposits outpace withdrawals 1.7 : 1—on-chain signs that the sell-off is more leverage shakeout than top formation.
________________________________________
2. ETF Backdrop: How the 19-Day Inflow Wave Took Shape
2.1. The Players
Unlike Bitcoin’s mammoth U.S. spot ETFs, Ethereum’s inflow streak drew from Europe and Canada, where physically backed ETPs have traded since 2021. The three biggest contributors:
Product Country 19-Day Net Flow AUM Growth
21Shares Ethereum ETP (AETH) Switzerland +$502 m +38 %
CI Galaxy Ethereum ETF (ETHX) Canada +$458 m +29 %
WisdomTree Physical Ethereum EU +$227 m +24 %
Rumors of an SEC approval window “after the U.S. election” sparked pre-positioning; asset managers figured it was cheaper to accumulate now than chase later once liquidity explodes on Wall Street.
2.2. Flow Mechanics
When an ETP issues new shares, it must buy spot ETH or tap an AP that can supply coins—direct demand unmatched by equivalent selling pressure. Over the 19-day window, the net 396 k ETH of creation equaled 57 % of all new issuance from block rewards post-Dencun, creating a measurable supply squeeze.
2.3. Historical Context
The only longer stretch was January–February 2021 (27 days), which culminated in ETH exploding from $1,400 to $2,000. The key difference today: market cap is six times larger, so identical inflows exert a milder percentage impact, explaining why price “only” added ~18 %.
________________________________________
3. Chronology of Price: Day-by-Day Performance
Day Date ETF Net Flow Price Close % Δ vs. Prior Day
1 Mar 18 +$58 m $2,110 —
5 Mar 22 +$73 m $2,265 +7.3 %
10 Mar 27 +$94 m $2,430 +2.4 %
15 Apr 1 +$125 m $2,690 +3.8 %
19 Apr 5 +$81 m $2,750 +0.9 %
Across the stretch, realized volatility rose from 32 % to 46 %, but skew stayed positive, showing call demand outpaced puts until the very end, when geopolitical headlines flipped sentiment.
________________________________________
4. Weekly Chart Anatomy: The “Pre-Tower Top” Signal Explained
4.1. What Is a Tower Top?
In candlestick lore, a tower top comprises:
1. A tall green candle (strong breakout)
2. Another tall green candle (exhaustion)
3. A narrow doji or spinning top (equilibrium)
4. A large red candle (breakdown confirmation)
We currently have the first three pieces: the last two weeks of March delivered back-to-back 10 % advances; the first week of April closed as a +0.6 % doji. The pattern is not confirmed until a decisive red week engulfs the doji body (< $2,540).
4.2. Indicators
• RSI (weekly): 59 → ticking down from 68 high; still shy of overbought.
• MACD histogram: Positive but flattening.
• Bollinger bands: Price mid-point of upper band, room for one more expansion.
Conclusion: the candle warns of fatigue, but momentum hasn’t rolled over—yet.
________________________________________
5. Intraday Technicals: From $2,450 Low to the $2,620 Hurdle
5.1. Hourly Chart (Kraken Feed)
• Triangle Breakout: Price sliced through descending trend-line at $2,550, tagging $2,590.
• Moving Averages: ETH trades marginally above the 100-hour SMA ($2,575) but below the 200-hour ($2,610).
• Fibonacci Zones: $2,620 aligns with 0.5 retrace of the $2,750→$2,450 fall—classic reversal pivot.
A clean hourly close >$2,620 opens the door to $2,680 (0.618 Fib) and psychological $2,700. Failure rejects to $2,520 support cluster.
5.2. Order-Book Heat Map
Coinbase Pro data shows 1,300 ETH ask wall at $2,620 and a thinner 890 ETH bid at $2,520. Liquidity skew favors dip-buying, but bulls need market orders >1 k ETH to smash the ask block.
________________________________________
6. On-Chain & Derivatives Lens
6.1. Exchange Reserves
Centralized exchanges now hold 12.9 million ETH, lowest since July 2017. The 19-day ETF harvest accelerated an already extant down-trend of roughly 60 k ETH/week outflows, mostly into staking contracts and L2 bridges.
6.2. Staking Flows
• Beacon deposit contract: +188 k in April’s first week.
• Withdrawal queue: 11 k ETH—tiny relative to deposits.
• Effective deposit APR after Dencun: 3.2 %, still beating U.S. 2-year T-notes post-tax for many investors.
6.3. Perpetual Funding & OI
• Funding normalized to 0.007 %/8 h (≈ 3.2 % APR), down from 9 % at March highs—spec longs flushed.
• Open Interest shed $420 m in the two-day dip—liquidations, not fresh shorts, drove the wash-out.
6.4. Options Skew
• 25-delta risk reversal (1-month): flipped to –4 % (puts pricier than calls) for first time since January—hedging demand but nowhere near panic-level (–12 % in 2022 bear).
________________________________________
7. Fundamental Undercurrents
7.1. Dencun Afterglow & L2 Fees
Proto-danksharding (EIP-4844) slashed L2 data costs by 85 %, pushing average Arbitrum and Optimism transaction fees under $0.02. Cheaper blockspace fuels on-chain activity:
Metric Pre-Dencun Post-Dencun Δ
Daily L2 Txns 2.4 m 4.1 m +71 %
Bridged ETH to L2s 6.8 m 7.9 m +16 %
More usage → more gas burned → structural tailwind to ETH as a fee-burn asset.
7.2. DeFi TVL
Total value locked rebounded to $61 billion, led by EigenLayer and restaking hype. ETH comprises 68 % of TVL collateral—every lending loop pins additional demand.
7.3. Competing Narratives
• Solana season siphoned retail mind-share; SOL/ETH ratio popped 42 % YTD.
• Bitcoin L2s (Stacks, Rootstock) attempt to mirror Ethereum’s smart-contract moat, but dev tooling remains nascent.
•
Net: Ethereum retains developer supremacy (70 % of new GitHub commits among smart-contract chains) and therefore garners institutional comfort.
________________________________________
8. Risks & Catalysts
Factor Bearish Angle Bullish Rebuttal
Macro Sticky U.S. CPI halts Fed cuts → higher real yields weigh on non-yielders ETH staking yield + MEV is real cash-flow; Dencun lowers L2 costs → adoption offset
SEC Spot ETF Delay past Jan 2026 or outright denial kills U.S. inflow dream 19-day streak proves ex-U.S. capital is hungry; approval >0 is all it takes for supply shock
BTC Dominance Halving FOMO may keep Bitcoin’s share >55 %, starve ETH rotation Historical pattern: ETH rips 6-10 weeks post-halving as beta plays catch-up
Tower-Top Pattern Weekly confirmation could spark drop to $2,200 support Pattern fails if bulls recapture $2,750 quickly, turning doji into bullish flag
________________________________________
9. Playbooks for Traders and Long-Term Allocators
9.1. Short-Term Momentum (0–7 days)
• Bias: Range-trade $2,520–$2,620 until breakout.
• Instruments: ETH-perp on Bybit/Deribit, 3× leveraged tokens for reduced funding bleed.
• Trigger: 15-minute candle above $2,620 with ≥ $50 m aggregated CVD buys.
• Stop: $2,560 (triangle retest).
• Target: $2,680 then $2,700.
9.2. Swing (1–8 weeks)
• Bias: Accumulate dips as long as weekly stays >$2,350 (0.382 Fib of Oct→Mar leg).
• Tools: 1-month $2,500-$2,800 call spreads; spot with 25 % collar protection.
• Catalysts: SEC commentary May 23, FOMC June 18.
9.3. Position (6–18 months)
• Bias: Dollar-cost average into staking nodes; carry 4 % ETH on portfolio NAV.
• Thesis: EIP-4844 usage boom + probable U.S. ETF = $4–5 k fair value by 2026.
• Risk Control: Hedge 25 % notional via BTC-perp short if BTC.D >58 %.
________________________________________
10. Conclusion: A Pause, Not a Peak—If Key Levels Hold
The 19-day ETF inflow streak proves that institutional demand for Ethereum exists even without a U.S. spot vehicle. Price responded vigorously but not parabolically, reflecting the asset’s growing market-cap gravity. The nascent “pre-tower-top” weekly candle warns of exhaustion; confirmation, however, requires another bearish week that cracks $2,540 support.
Short-term order-flow shows willing dip buyers, staking metrics scream supply sink, and the macro backdrop—while shaky—fails to dent ETH’s relative value proposition versus fiat yields. Translation: Ethereum is vulnerable to headline-driven squalls but structurally sound.
If bulls recapture $2,620, the path to retest $2,750 and ultimately $3,000 reopens. Lose $2,450 and the tower top will complete, sending ETH toward $2,200 where ETF inflow buyers likely reload. For now, the balance of evidence favors consolidation with an upward skew—tower construction, perhaps, but no wrecking ball yet.

Bullish bounce off pullback support?The Ethereum (ETH/USD) is falling towards the pivot and could bounce to the 1st resistance.
Pivot: 2,407.74
1st Support: 2,092.59
1st Resistance: 2,816.29
Risk Warning:
Trading Forex and CFDs carries a high level of risk to your capital and you should only trade with money you can afford to lose. Trading Forex and CFDs may not be suitable for all investors, so please ensure that you fully understand the risks involved and seek independent advice if necessary.
Disclaimer:
The above opinions given constitute general market commentary, and do not constitute the opinion or advice of IC Markets or any form of personal or investment advice.
Any opinions, news, research, analyses, prices, other information, or links to third-party sites contained on this website are provided on an "as-is" basis, are intended only to be informative, is not an advice nor a recommendation, nor research, or a record of our trading prices, or an offer of, or solicitation for a transaction in any financial instrument and thus should not be treated as such. The information provided does not involve any specific investment objectives, financial situation and needs of any specific person who may receive it. Please be aware, that past performance is not a reliable indicator of future performance and/or results. Past Performance or Forward-looking scenarios based upon the reasonable beliefs of the third-party provider are not a guarantee of future performance. Actual results may differ materially from those anticipated in forward-looking or past performance statements. IC Markets makes no representation or warranty and assumes no liability as to the accuracy or completeness of the information provided, nor any loss arising from any investment based on a recommendation, forecast or any information supplied by any third-party.

Daily vs 4H: Mixed Signals, Clear BounceOn both the 1D and 4H timeframes, price is still below the 200MA.
On the daily chart, it's also trading under the BB center line, the SMA, and the MLR.
However, on the 4H chart, price is now above the BB center line, SMA, and MLR — and it’s not far from triggering a long entry signal.
On the daily, we’ve seen a bounce from strong support: the 0.5 Fib level and the 200-week MA.
On the 4H, price looks ready to close above the last daily close — a promising sign.
Always take profits and manage risk.
Interaction is welcome.

Vitalik didn’t draw this box. I did — and I’m trading itPrice delivered the sweep. Now it’s coiling inside my range, hovering just above the 1H OB like it’s waiting for permission. I don’t need permission. I need structure — and I’ve got it.
The logic:
ETH dropped into a clear demand zone — not a guess, a confirmed 1H Order Block. Since then, it’s printed compression just above the OB. Every wick into the range was absorbed — no expansion, just preparation.
Above us? Two objectives:
TP1: 2650 — inefficiency fill and previous high-volume rejection
TP2: 2770 — full reprice and external liquidity sweep
If price dips into the OB again? That’s not invalidation — that’s refinement.
Execution:
Entry: 2480–2500 (or on OB retest)
SL: Below 2434
TP1: 2650
TP2: 2770
You don’t chase this. You wait for it — then load it without hesitation.
Final thought:
“Smart Money doesn’t buy the candle. It buys the context.”

EHTUSD15 min TF
Buy on next breakout
Cup and Handle Format
Risk Reward mentioned in chart with TP SL EP

ETHUSD: Next Move Is Down! Short!
My dear friends,
Today we will analyse ETHUSD together☺️
The market is at an inflection zone and price has now reached an area around 2,545.9 where previous reversals or breakouts have occurred.And a price reaction that we are seeing on multiple timeframes here could signal the next move down so we can enter on confirmation, and target the next key level of 2,529.4..Stop-loss is recommended beyond the inflection zone.
❤️Sending you lots of Love and Hugs❤️

Ethereum Weekly Chart Shows Strength Above Key SupportEthereum is showing strong structure on the higher time frame. After rejecting lower levels, price has reclaimed the mid support/resistance zone, and is now consolidating just above it.
What’s key here is the long-term rising trendline, which has held beautifully since 2020 and once again acted as a springboard for the recent bounce. This kind of confluence — trendline + zone flip — adds weight to the current price structure.
If ETH maintains this zone, we could see accumulation continue, followed by a breakout toward the upper resistance line. For now, the chart leans bullish, but patience is key as consolidation plays out.
DYOR, NFA

Ethereum LP Range TighterVolatility has continued to decline, enabling us to tighten the liquidity provision range on Ethereum within the Base network, as indicated by the horizontal red lines. However, trading volume in ETH remains relatively low, which is resulting in minimal fee generation from the pool, we expect that to change: app.uniswap.org