Will Ethereum reach 15K soon?In my video I share why is it possible for Eth to reach 14-17K in the next months.
Disclaimer: Not a financial advice
Ethereum (Cryptocurrency)

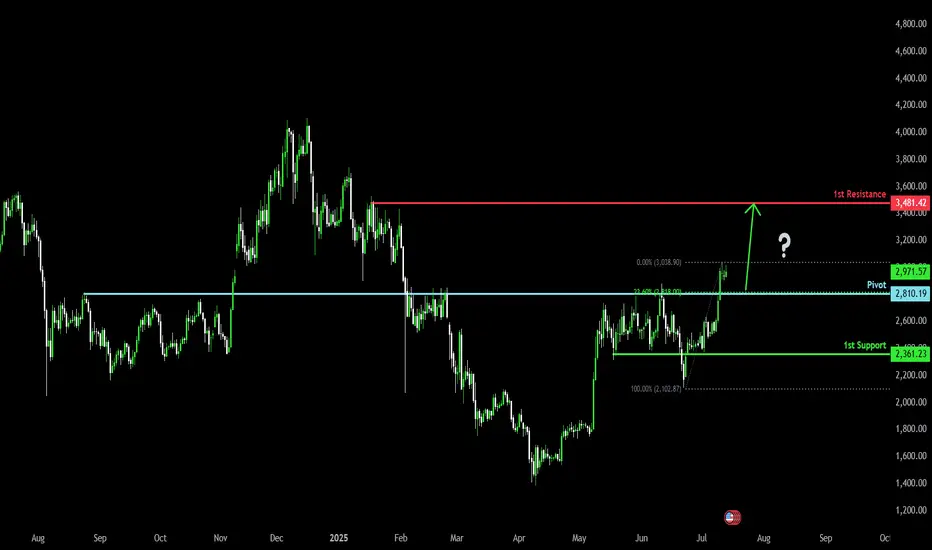
Bullish bounce?Ethereum (ETH/USD) is falling towards the pivot and could bounce to the 1st resistance.
Pivot: 2,810.19
1st Support: 2,361.23
1st Resistance: 3,481.42
Risk Warning:
Trading Forex and CFDs carries a high level of risk to your capital and you should only trade with money you can afford to lose. Trading Forex and CFDs may not be suitable for all investors, so please ensure that you fully understand the risks involved and seek independent advice if necessary.
Disclaimer:
The above opinions given constitute general market commentary, and do not constitute the opinion or advice of IC Markets or any form of personal or investment advice.
Any opinions, news, research, analyses, prices, other information, or links to third-party sites contained on this website are provided on an "as-is" basis, are intended only to be informative, is not an advice nor a recommendation, nor research, or a record of our trading prices, or an offer of, or solicitation for a transaction in any financial instrument and thus should not be treated as such. The information provided does not involve any specific investment objectives, financial situation and needs of any specific person who may receive it. Please be aware, that past performance is not a reliable indicator of future performance and/or results. Past Performance or Forward-looking scenarios based upon the reasonable beliefs of the third-party provider are not a guarantee of future performance. Actual results may differ materially from those anticipated in forward-looking or past performance statements. IC Markets makes no representation or warranty and assumes no liability as to the accuracy or completeness of the information provided, nor any loss arising from any investment based on a recommendation, forecast or any information supplied by any third-party.
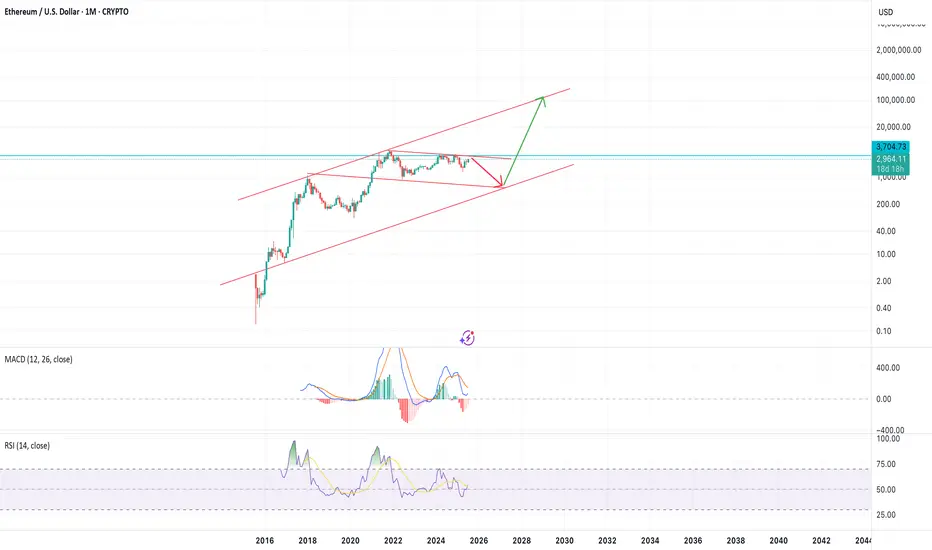
ethusd to 70 000 or 700 and 70 in two Months we seeEthereum in parallel channel and huge bull flag. if in next two months it will break out of the 4000 could go to 75000.
If not will range in channel till 700 and breaking down would mean even 70 and lower

ETH/USD Setup | Thief Trading Blueprint for Profit.🔥🚨THE ETHEREUM HEIST PLAN: Thief-Style Trading Blueprint for Maximum Gains🚨🔥
💰Thief Mode: Activated | Time to Rob the Bulls 💰
📢🌍 Hello Money Makers, Crypto Crooks & Chart-Breaking Bandits! 🐱👤🤑💸
Welcome to the “Thief Trading Style” breakdown — a high-stakes, high-reward crypto market blueprint built on deep technical & fundamental intel. This isn’t your average strategy… it’s a full-blown heist on the ETH/USD market!
🧠 THE MASTER PLAN (ETH/USD – Day & Swing Trade)
🔎 Based on our Thief Mode analysis — blending market sentiment, trend psychology, and price action — Ethereum is ripe for a bullish robbery. We’re setting up shop at high-risk liquidity traps and targeting bearish overconfidence.
💥ENTRY STRATEGY – "The Vault Is Open, Time to Strike!" 💥
🟢 Go Long:
Swipe in on bullish momentum.
🕒 Set Buy Limit Orders at key pullback zones (swing highs/lows from 15m or 30m timeframes).
💼 Use DCA (Layered Orders) for multiple precision entries. The more layers, the stronger the loot stack.
🛑STOP LOSS – "Thief Rule: Don’t Get Caught"
📍Place SLs at logical swing highs/lows using the 1H timeframe
💡 Adjust according to lot size & how many entries you're stacking
Risk smart, steal smarter!
🎯TARGET – "Make the Escape at 2850.0 or Jump Early if Cops Close In!"
📌Set TP at 2960.0, or
📌Exit early if the market starts turning shady (exit before reversal signs appear)
⚔️SCALPER'S CODE – "Fast Hands Only!"
🧲Only scalp Long-side plays
🧠Use trailing SLs to protect stolen profits
💼Big wallets? Front-run the move
🪙Smaller bags? Team up with swing traders and follow the blueprint.
🚨MARKET CONTEXT – Why This Heist is Bulletproof
💥ETH/USD is showing bullish energy due to:
Macro & Fundamental Drivers
On-Chain Metrics showing accumulation
Sentiment Analysis leaning toward over-leveraged bears
Intermarket Correlation signaling rotation into altcoins
🔗Stay sharp, keep updated with: COT Reports, Macro Calendar, Crypto News Feeds
⚠️NEWS RELEASE WARNING – "Robbers Hate Surprises"
📛Avoid new entries during major news releases
📈Use Trailing Stop Losses to lock in profits
⛔Don’t leave positions unmanaged during volatility spikes
💖LOVE THE PLAN? THEN BOOST THE GANG!
🎯Tap the 🔥 Boost Button 🔥 and show support for the Thief Trading Style!
The more boosts, the more plans drop — let’s build a community of smart traders robbing the market legally (😉).
✍️DISCLAIMERS
📌This analysis is for educational purposes only — not financial advice.
📌Always trade within your own risk management rules.
📌Market conditions change fast — adapt, evolve, and don’t trade blindfolded.
🚀Stick around for more blueprints — the next heist is always just around the corner.
Until then… Lock. Load. Loot. 🐱👤🤑💰

ETHUSD: Bulls Are Winning! Long!
My dear friends,
Today we will analyse ETHUSD together☺️
The price is near a wide key level
and the pair is approaching a significant decision level of 2,980.5 Therefore, a strong bullish reaction here could determine the next move up.We will watch for a confirmation candle, and then target the next key level of 3,001.1.Recommend Stop-loss is beyond the current level.
❤️Sending you lots of Love and Hugs❤️

ETHEREUM - ETH Weekly Recap & Projection 13.07.2025Current Structure
Ethereum is showing a clear bullish bias.
Last week’s price action broke above a significant weekly swing level with solid candle closures — suggesting continuation.
Short-Term Scenarios
We could see two potential outcomes:
• A consolidation range forming at current levels
• A short-term retracement influenced by Bitcoin’s movement
Due to ETH’s high correlation with BTC, traders should review Bitcoin’s chart to understand ETH’s likely path.
Trading Plan
Wait for Bitcoin to complete a retracement
Monitor ETH for LTF (lower timeframe) confirmation and bounce
Seek long setups below the CME Gap (pink line)
Step 2 will serve as the trigger to initiate any positions on ETH.
Macro Risk-On Catalyst – Powell Resignation?
There are growing rumors regarding Federal Reserve Chairman Jerome Powell potentially resigning.
If confirmed, this could result in a strong rally across risk assets, including ETH — likely pushing prices higher without traditional pullbacks.
Summary
• ETH broke major weekly structure
• Watch BTC for clues — correlation remains high
• Plan favors long entries after BTC retrace + ETH LTF confirmation
• Powell resignation rumors could accelerate bullish trend

ETH / USDC Liquidity Pool RangeEthereum is climbing alongside Bitcoin, but it’s clearly outperforming. In many ways, ETH is the Microsoft of the crypto space—serving as a foundational platform on which countless networks and tokens are built, much like Windows supports a broad software ecosystem. In contrast to Bitcoin’s role as a digital currency, Ethereum functions more like a software operating system.
We broke out of the previous range for strong profits. The new range is tighter, with the lower boundary set just above the current ETH spot price at $2,995.91 and the upper boundary at $3,340.90, as marked by the horizontal yellow lines. On the 3-hour chart, momentum is beginning to turn upward. To enter the liquidity pool within this range, we must be fully allocated in ETH.

ETH/USD ROBBERY IN PROGRESS! Long Now, Exit Before Bears Attack!🚨 ETH/USD HEIST ALERT: Bullish Loot Before the Trap! 🚨
Thief Trading Style: Steal Profits & Escape Before the Cops Arrive!
🌟 Greetings, Market Pirates & Profit Bandits! 🌟
(Hola! Oi! Bonjour! Hallo! Marhaba!)
🔥 The Ethereum vault is WIDE OPEN! Time to execute the Thief Trading Strategy—bullish momentum is primed for a heist. Long entries only! Target the highs, then vanish before the overbought trap snaps shut.
🔑 Heist Plan (Day/Swing Trade)
🎯 Entry: "The vault is unguarded—swipe bullish loot at any price!"
Pro Tip: Use buy limits within 15-30min for pullback entries (recent swing lows/highs).
🛑 Stop Loss:
Thief SL (4H): 2240.0 (Nearest swing low)
Adjust SL based on risk, lot size & multiple orders.
🏴☠️ Target: 2800.0 (or escape earlier if bears ambush!)
⚡ Scalpers’ Quick Loot:
Only scalp LONG!
Big wallets? Charge in! Small wallets? Join swing traders & rob smart.
Trailing SL = Your Escape Rope!
📢 Why Ethereum?
🐂 Bullish momentum + strong fundamentals = Perfect heist conditions!
(Check COT reports, macro trends & sentiment— check 👉🔗!)
⚠️ WARNING: Cops (Bears) Are Setting Traps!
Avoid fresh trades during news!
Trailing SL = Lock profits & run!
💥 BOOST THIS HEIST!
🔥 More boosts = Faster profits!
🚀 Daily robberies = Easy money!
Stay tuned—next heist coming soon! 🤑💎 (Like & Follow for more loot!)

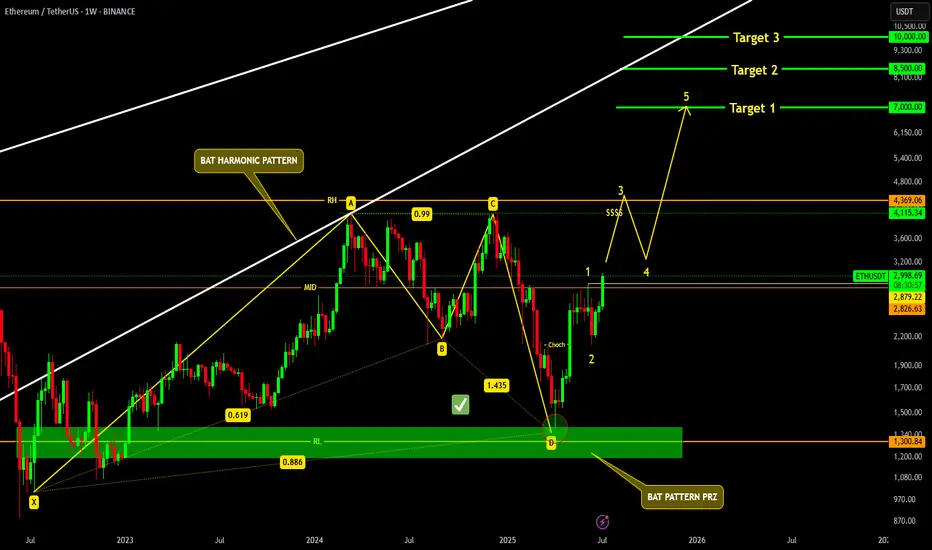
ETHEREUM READY TO SMASH 10K !!!AS per previous Ethereum update, CRYPTOCAP:ETH successfully tapped our Bat PRZ and making it's way to the top.
as per micro elliott wave count, we will see Ethereum slamming 7k, and could potentially smash 10k in coming months.
[UPD] Trend analysis: BTC / ETH / SOL / XRP and other Just recorded a new video overview of the crypto market and the current trend developments in major coins: CRYPTOCAP:BTC , CRYPTOCAP:ETH , CRYPTOCAP:SOL , CRYPTOCAP:XRP , CRYPTOCAP:LINK , GETTEX:HYPE , BSE:SUPER , $FLOKI.
Among the new assets on my radar I shared my view on the trend structure of $RENDER.
In my personal investment planning, I continue to treat any potential corrections into key support zones as opportunities to add or open new positions.
Thank you for your attention and I wish you successful trading decisions!
If you’d like to hear my take on any other coin you’re tracking — feel free to ask in the comments (just don’t forget to boost the idea first 😉).

ETH/BTC: Golden Cross Reloaded?This is ETH/BTC on the daily chart.
A major event is about to unfold: the golden cross, where the 50MA crosses above the 200MA.
The last time this happened was in early 2020, around the same price zone, right after a bounce off the 2019 low double bottom and a rejection from the 0.5 Fib level, which sits halfway between the 2019 low and the 0.786 Fib.
In 2025, we’re seeing a strikingly similar pattern:
– Price bounced off the 2019 low
– Got rejected again from the 0.5 level
– And now appears to be gathering strength to flip that level and the 200MA to confirm the Golden Cross
Always take profits and manage risk.
Interaction is welcome.

Bear market starts August 2025 and Bottoms January 2027 Ethereum will bottom at $450 then 2027 and 2028 will be the best 2 years in the history of crypto and the world and ethereum will reach above $100,000 by end of 2028
the charts are obvious!
Not a Financial advise
ETH Hits $3K — Next Stop: Moon or Pause?ETH just tagged the psychological $3 000 barrier after a sharp impulse, printing a fresh higher high inside its rising channel.
🧠 Game plan:
1️⃣Pullback zone: The orange structure area at $2 550 – $2 700 aligns with the channel’s lower trend-line — a prime spot for bulls to reload.
2️⃣Continuation trigger: A clean 4H close back above $3 000 turns the level into support, unlocking the path toward $3 100 (first target) and potentially higher into the summer.
3️⃣Invalidation: A decisive break below the channel would neutralise the setup and shift focus back to the macro support near $2 400.
Until then, every dip toward the orange demand is a gift in this bullish structure. Trade the plan, not the noise.
📚 Always follow your trading plan regarding entry, risk management, and trade management.
Good luck!
All Strategies Are Good; If Managed Properly!
~Richard Nasr

Trend Resumes: Ethereum Breaks Consolidation, Eyes $4050Market Structure Overview:
Markets typically move in two major phases:
🔹 Trend Phase (directional movement)
🔹 Consolidation Phase (sideways movement or accumulation/distribution)
These phases repeat as: Trend → Consolidation → Trend → Consolidation
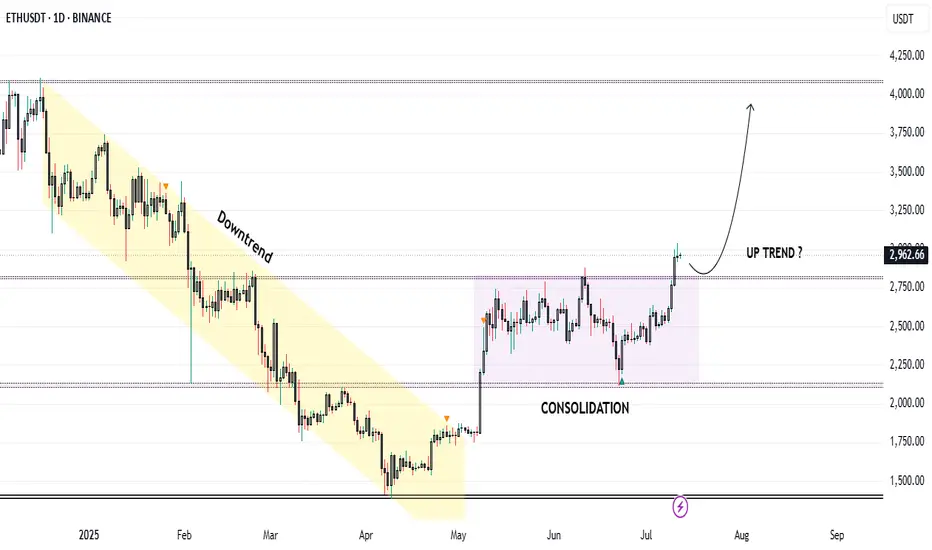
Ethereum Price Action Breakdown (Daily Timeframe):
Mid-December to End-April: Clear downtrend phase.
May to Early July: Entered a consolidation zone, forming a tight range.
Current Status (July):
🔹 Ethereum has broken out of the consolidation range.
🔹 Currently trading around $3000, confirming strength.
🔹 This breakout may potentially signal the start of Altcoin Season.
Trade Setup – Long Position Idea:
Entry (Buy Zone): Around $2850 (retest of breakout resistance).
Target:
🔹 Primary Target: $4050
🔹 This aligns with a major resistance and Fibonacci extension zone.
Stop Loss: $2600 (below key structure support).
Technical Confluences:
* Breakout above multi-week range.
* Retest of resistance turned support at \$2850.
* Psychological round level near \$3000 acting as a magnet.
* Volume confirmation on breakout (optional to mention if on chart).
Risk Note:
⚠️ Caution: The Market may turn volatile due to unexpected geopolitical or macroeconomic news. Always follow risk management and avoid overleveraging.
Conclusion:
Ethereum’s breakout from a multi-month consolidation phase indicates a potential shift in momentum. If retest levels hold, this could be the beginning of a strong upside rally, possibly leading to a broader Altcoin Season. Traders can position themselves accordingly with a well-defined risk-reward setup.
Ethereum’s Next Fair Value Gap is $3.8K — And the Road to $26K 🚀 Ethereum’s Next Fair Value Gap is $3.8K — And the Road to $26K Remains On Track
Ethereum ( CRYPTOCAP:ETH ) just reclaimed key structure — and despite a temporary pullback, all signals remain aligned for a parabolic breakout toward $26,000 this cycle.
Here’s why the next Fair Value Gap (FVG) sits near $3.8K, and why the Schiff Pitchfork structure still implies Ethereum is coiling for exponential upside in the coming months.
🔹 The $3.8K FVG: ETH’s Next Magnet
Looking at the daily chart:
The $3.8K zone is a clear untapped FVG (Fair Value Gap) from late 2021, created by a sharp breakdown candle that never got properly filled.
ETH is currently consolidating just below the $3.1K resistance band, and once that breaks, liquidity will naturally gravitate toward the next inefficiency — at $3,800–3,900.
This gap aligns with a previous supply zone and intersects with the upper resistance trendline from late 2021, creating a powerful magnet for price once momentum returns.
🔹 All-Time Schiff Pitchfork Still Intact
The Schiff Pitchfork structure drawn from Ethereum’s 2018 low through its COVID crash low and 2021 all-time high paints a highly disciplined range:
ETH is respecting the midline of the lower channel and recently bounced off the support of the median zone, with price now grinding higher within the ascending structure.
The upper band of the pitchfork intersects with price in late 2025 near the $26,000–28,000 zone, forming a natural cycle top target.
Historically, Ethereum has respected this long-term structure remarkably well — and this current move is no different.
🔹 Moving Averages & Bullish Market Structure
ETH recently flashed a Golden Cross — the 50-day SMA crossing above the 200-day SMA — which historically front-runs explosive upside in post-halving years.
All major SMAs (20/50/100/200) are now curling upward, creating a supportive launchpad.
Price is breaking out of the consolidation wedge that defined Q2 2025 — and has room to run toward $3.8K before meeting major overhead resistance.
🔹 Post-Halving Explosiveness
Let’s not forget: we’re in a post-halving year — and ETH has a consistent pattern of multiplying 5x–10x in the 9–12 months following Bitcoin halving events:
In 2017 (after 2016 halving): ETH went from ~$8 to $1,400 — nearly 175x.
In 2021 (after 2020 halving): ETH went from ~$120 to $4,800 — roughly 40x.
A move from the current ~$3K level to $26,000 is just an 8.5x — well within historical precedent.
🔹 Macro Tailwinds: ETH ETFs & Institutional Flows
BlackRock, Fidelity, and other asset managers are positioning Ethereum ETFs for approval, which would unlock billions in institutional inflows.
A staking ETF would dramatically compress supply — Ethereum already has over 27% of its supply locked — amplifying upside through supply-demand squeeze.
Meanwhile, stablecoin settlement volume is growing faster than Visa — all powered by Ethereum infrastructure.
🔹 Timing the Move: August to December Explosion?
The verticals on your chart highlight key windows:
A breakout window between early August and mid-September coincides with both macro liquidity injections and historical altseason patterns.
If ETH hits $3.8K by August, the runway to $8K–$14K opens by October, with $26K still well within reach by December 2025, in line with your pitchfork’s top boundary.
🟣 Summary: Ethereum’s Next Stop Is $3.8K — Then Moon
✅ Untapped FVG magnet at $3.8K
✅ Schiff Pitchfork upper boundary intersects near $26K
✅ Post-halving year + Golden Cross = Explosive setup
✅ ETH ETF narrative just beginning
✅ Structural breakout from consolidation wedge
Ethereum is no longer just the base layer of DeFi — it’s becoming the base layer of global financial infrastructure. And price hasn’t yet priced that in.
"If the internet had a price, it would be Ethereum."
Don’t fade this breakout. We’re still early.

ETHUSD Break- Test- GO!!! Nothing Changed! 3rd EditionI have been warning about this for some time. Please visit my previous two posts for more info and updates.
Magic!
Click boost, follow, and subscribe for more. Let's get to 5,000 followers ))

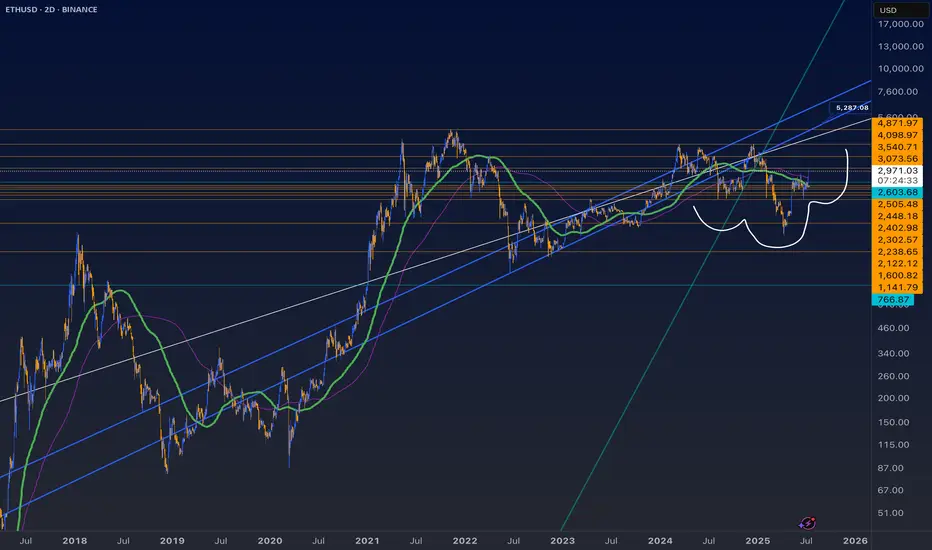
ETH Update 25-7-11so I know this is a bit of a weird view but I like to zoom out sometimes and I like this blue corridor. Personally, I think the demand for ETH speaks for itself so eventually it will see new highs and everything. This is just a way to gauge the next moves. It will probably mimic BTC with its head and shoulders pattern but be more amplified even though it’s lagging behind still and has been for years.
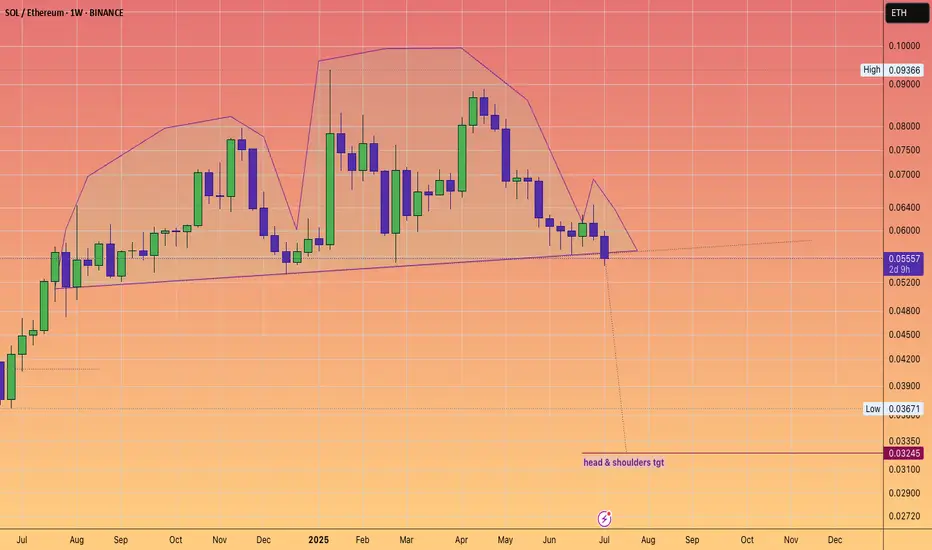
Boomers buying Ethereum not SolanaRatio has broken a head and shoulders
Stablecoin supercycle
Tom Lee
SBET
ETH treasury #fomo
Ethereum can make a small correction before it continues to growHello traders, I want share with you my opinion about Ethereum. After a long period of consolidation within a descending triangle, Ethereum broke out and started forming a steady upward channel. The impulse move from the buyer zone gave the market fresh bullish energy. We saw the price pushing through key resistance levels, showing strong momentum and confidence from buyers. Eventually, ETH reached a local peak and is now hovering just above the current support level at 2835. This area is crucial - it previously acted as resistance and has now turned into a support area, giving bulls a chance to regroup. Based on the structure, I expect a short-term correction toward the support area, followed by a continuation to the upside. The trend remains strong, and the impulse is not yet exhausted. That’s why I set my TP at 3240 points, which aligns with the upper expansion target based on previous movement. Given the breakout, strong uptrend, and support zone now being retested, I remain bullish and anticipate further growth from the current levels. Please share this idea with your friends and click Boost 🚀
Disclaimer: As part of ThinkMarkets’ Influencer Program, I am sponsored to share and publish their charts in my analysis.

If Pulsechain reaches a penny, it would = a 325XOr around $165 billion in user-based valuation, excluding the significant portion of coins held by the founder.
It's certainly a long shot, and it would probably depend on Ethereum's price reaching well into the teens
(which, as you know, I strongly support).
Thus, it is definitely within the realm of possibility considering the low initial user base and the potential influx of individuals who will join EVMs in the upcoming years.

HolderStat┆ETHUSD seeks to $3200KUCOIN:ETHUSDT surged after breaking out of a triangle and pushing through multiple resistance levels. The latest move above $2,900 confirms a bullish continuation, with $3,200 as the next major zone. Consolidation below resistance has built the base for the current rally.


BTC/USDT : Breaks Out – New Highs In Sight After Smashing $111K!By analyzing the Bitcoin (BTC) chart on the weekly timeframe, we can see that the price has finally started to rally as expected—successfully hitting the $111,700 target and even printing a new high at $111,999 with an impressive pump.
This analysis remains valid, and we should expect new all-time highs soon.
The next bullish targets are $124,000 and $131,800.
THE WEEKLY TF ANALYSIS :
