ETHUSDTHere is a great move for ETH after a long time.
So I can recommend some levels to trade and bullish move has been started.
good luck
DYOR!
Ethereum (Cryptocurrency)

ETH New Analysis (12H)This analysis is an update of the analysis you see in the "Related publications" section
The previous analysis is still valid | its timeframe is higher, but in this update, we've moved to the lower timeframes.
It seems a valid bottom has been formed on Ethereum, and we may not see a lower low, provided that the price doesn't move higher first but instead drops directly into our support zone. If that happens, the price could potentially move upward from there.
Ethereum seems to be searching for a support zone to reach higher levels. The marked area could potentially launch the price upward.
In this analysis, the support zone, targets, and invalidation level have been updated.
For risk management, please don't forget stop loss and capital management
When we reach the first target, save some profit and then change the stop to entry
Comment if you have any questions
Thank You

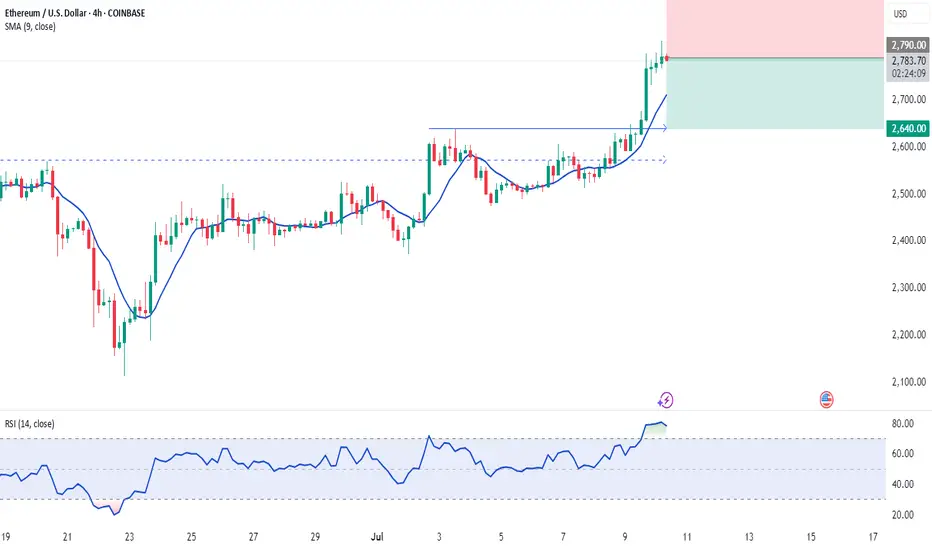
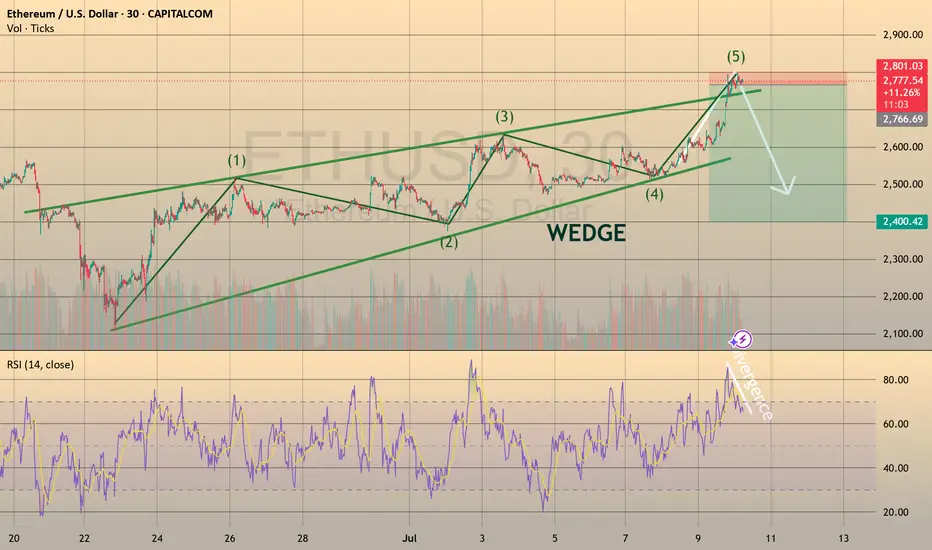
TRADING IDEA - ETHUSD SHORT
ETHUSD rose towards 2,700.00 level and reached the take profit. And even went further towards 2,800.00 resistance level despite my 2,700.00 retest predict! (pic 1)
So, congrats to everyone, who stayed long here, we took the cash!💵
I am preparing for the next trade. Here is the plan: if the price rises once again towards 2,800.0 resistance level and retests it, I will open the short position with
🔽 a pending sell stop order at 2796.84 with
❌a stop loss at 2818.86 and
🤑a take profit at 2740.05
Additionally, the RSI shows divergence on 30-m timeframe.
I suppose this to be quick trade. Will see how it will work out.
ETH Long / Buy SetupAs of many times mentioned that, will short eth above 3k or 3k, but it still shows Bullish momentum no sign of weakness, maybe this entry triggers during weekend due too low volume, search for ifvg, if any 1D or 4hr Bullish fvg truns into bearish ifvg then will take short on ETH. For now will take long with SL and proper risk management.

$ETH - See you later!CRYPTOCAP:ETH - See you later!
CupnHandle breakout
Volume gap up to $3400
Cupnhandle MM up to $4400+

$ETH: The 1-week chart is an absolute disaster!Once again, I want to make it clear: I’m naturally a bull. But I live in Thailand, far from the noise of influencers shouting "buy, buy, buy!" I’ve learned my lesson—when they scream buy, you get rekt. That’s why I rely solely on the charts.
Charts are just mathematics—they don’t lie. So here’s my honest interpretation of what I’m seeing for Ethereum:
🕐 Daily Outlook
Yes, we might see a few nice bounces in the short term. But if your plan is to hold ETH, you should be paying attention to higher timeframes, especially the weekly.
📉 Weekly Chart — It's Ugly
We’re clearly in a descending wedge, and overall, ETH is bearish. Don’t be fooled by the hype or the people trying to take your money.
- RSI is bearish, with a strong bearish divergence still unfolding.
- MACD is on the verge of a bearish crossover, and what’s worse, it’s doing that without even touching the neutral zone—a major red flag.
The last time we saw this setup? November 2021. The price crashed below $1,000.
🔍 Where’s the Support?
This cycle, the support zone looks closer to $1,500, mainly due to institutional interest and the ETF narrative. A full retracement seems unlikely, but technically speaking—it’s still a possibility.
🤔 Why Is This Happening Despite Institutional FOMO?
Here’s the key: ETH has staking, and every month, new CRYPTOCAP:ETH is minted to pay stakers. This creates constant inflation. On top of that, many stakers compound their rewards, accelerating the inflation. And guess what? These same stakers are selling as soon as ETH pumps.
So fundamentally, Ethereum is under pressure because of its own staking mechanics—a system flaw that creates long-term selling pressure.
Do your own research (DYOR). I could be wrong—but at least I’m not trying to sell you a course.

Symplegades Part II – Ethereum at the Threshold of Breakout or B⚔️🌉 Symplegades Part II – Ethereum at the Threshold of Breakout or Breakdown 💥🧭
In the previous post, we explored Ethereum’s mythical challenge — the Symplegades, or Clashing Rocks. That post resonated, and now… here comes Part II.
ETH is once again caught in a narrowing passage, this time defined by:
📌 $2,805 – $2,911 resistance overhead
📌 $2,616 – $2,565 support just below
💡 Pectra could be the fuel to break out — or just another wave that crashes on the rocks. The chart shows the potential for both:
➡️ A clean breakout could spark a move to “Destination 1” (~$4.8K)
⚠️ A rejection here might drag us back under $2.6K, even toward $2.1K and $1.8K zones
The Pectra breakout box is clear. But the market won’t hand it to us easily. It rarely does.
🧠 With Vitalik still “asleep,” it’s a tight spot. But if this move gathers momentum? We could be at the very start of Ethereum’s next wave.
📽️ The full video posted earlier today dives into this thesis and why macro + micro signals are conflicting but critical.
📊 Stay tuned — Bitcoin post is up next.
One Love,
The FXPROFESSOR 💙
Disclosure: I am happy to be part of the Trade Nation's Influencer program and receive a monthly fee for using their TradingView charts in my analysis. Awesome broker, where the trader really comes first! 🌟🤝📈

July 10th Market Outlook –Charted Waters & Uncertain Momentum🗓️📊 July 10th Market Outlook – Charted Waters & Uncertain Momentum 🌊⚠️
Today’s breakdown is a reality check for traders navigating a market full of setups but short on clarity. Resistance is stacking across the board, but that doesn’t mean we can’t break through — it just means we need to stay sharp and keep our charts close.
🔎 Highlights from the 19-minute video:
Bitcoin is approaching a third and crucial resistance test. A breakout could trigger ultra-FOMO, but failure here could send us lower.
Ethereum is in a pressure zone — the "Symplegades" setup from Greek mythology reflects today’s narrow trading path.
Bitcoin Dominance is clinging to support — if it breaks, altseason could be on. If it holds, alts may stay sidelined.
NASDAQ & Nvidia have delivered massive runs, but signs of exhaustion and reversal risk are showing.
Dollar Index (DXY) showing a Golden Cross, but unresolved rate expectations could catch markets off guard.
💬 I also speak candidly about market manipulation, being someone else’s exit liquidity, and why we might be heading toward a formative trap before any true breakout.
🎥 Watch the full video to catch all the details — from long-term setups to real-time chart reactions.
📌 Stay tuned for detailed updates today on Bitcoin, Ethereum, Bitcoin Dominance, NASDAQ and more.
One Love,
The FXPROFESSOR 💙
Disclosure: I am happy to be part of the Trade Nation's Influencer program and receive a monthly fee for using their TradingView charts in my analysis. Awesome broker, where the trader really comes first! 🌟🤝📈

ETHEREUM ahead of the most critical break-out of the Cycle.Ethereum (ETHUSD) is on the cusp of a major bullish break-out as this week it is already trading above its 1W MA50 (blue trend-line). If it manages to close the 1W candle above it, it will be the first time since January 06 2025 to do so.
This whole price action remains inside a massive Megaphone pattern and resembles the same structure ETH had during June 24 2019 - July 20 2020. Both patterns had a final decline of around -67% with the 2020 structure eventually starting a (green) Channel Up that broke above the Megaphone and made a first Top on the 1.382 Fibonacci extension.
As a result, if the break-out does happen this time around also, we expect the emerging Channel Up to target at least $6300 (Fib 1.382 ext).
-------------------------------------------------------------------------------
** Please LIKE 👍, FOLLOW ✅, SHARE 🙌 and COMMENT ✍ if you enjoy this idea! Also share your ideas and charts in the comments section below! This is best way to keep it relevant, support us, keep the content here free and allow the idea to reach as many people as possible. **
-------------------------------------------------------------------------------
💸💸💸💸💸💸
👇 👇 👇 👇 👇 👇

ETH Not Taking Profits Yet – System Still Long
ETH on the 4H is pausing right at the 3D 200MA, picture perfect, actually.
Now we wait to see if this resistance flips into support.
If that happens, price could go for the 0.382 Fib level around $3,040.
Of course, that’s the ideal scenario, but the market could easily contradict me, so keep that in mind.
Personally, it’s not time to take profits yet.
Both my 4H and 1D systems are still in long positions.
For extra safety, you could set a partial take-profit just under the second-to-last PSAR dot.
Always take profits and manage risk.
Interaction is welcome.

Ethereum & monthly 20MAEthereum is gaining strength and will likely break above the monthly 20 MA. Will it maintain this momentum by month's end and remain bullish in the coming months?
Good luck HODLRS ✌️🤞

ETH Decision Zone: Breakout or Bull Trap?Ethereum (ETHUSD) just broke out of a tight symmetrical triangle on the 1H chart — but price is now stalling near the previous high, signaling a critical decision point.
📊 Key Technical Notes:
🔹 Triangle Breakout: Clean push above downtrend resistance, but no candle close above key high.
🔹 Previous High Acting as Resistance: Bulls need continuation to validate this move.
🔹 Two Scenarios in Play:
1️⃣ Bullish Continuation:
→ ETH breaks and holds above ~$2,865
→ Next resistance levels sit at $3,000+
2️⃣ Bearish Rejection / Fakeout:
→ Rejection from highs
→ Retest of triangle → Failure = drop toward previous low near $2,150
🎯 Risk-Reward Defined — both long and short setups are clearly outlined.

ETH POTENTIAL BULLISH GARTLEY Seeing a potential bullish gartley forming on ETH if it is unable to break above the .886 of the AB wave. Targets would be $2004 to $1786 for the .786 or 1.618 of the BC leg

ETHUSD h4 next move downThe resistance at 1.36554 may be weak due to:
Multiple taps already
Reduced seller interest
A breakout above this zone could trigger short covering → sharp rally
✅ 2. Higher Low Structure
Recent low at 1.35475 held strong
Current consolidation appears like a bullish flag or accumulation range
Could indicate continuation, not rejection
✅ 3. Fakeout Reversal Setup
If price dips into the support at 1.35475 again, it might:
Trap breakout traders
Reverse and form a new impulse leg upward
Target = 1.3700–1.3750 zone

ETH Pullback Before Next Rally? Hello guys!
Ethereum is currently testing a strong resistance zone around the $2,678 level, which has previously acted as a key barrier. Price action has been climbing steadily within an ascending channel, indicating a clear bullish trend in play.
However, since ETH is right at the resistance, we could see a short-term correction or pullback toward the $2,560–$2,580 support range (highlighted zone), which also aligns with the midline of the channel and previous consolidation structure.
If this support holds, a healthy bounce from this area would likely push ETH toward the next bullish target around the $2,760–$2,800 zone, which sits near the upper boundary of the current channel.

HolderStat┆ETHUSD retest of the resistance lineBINANCE:ETHUSDT has exited a falling wedge and is forming a bullish continuation pattern. With price action building above $2,500, a breakout toward $2,800 is in play, targeting the supply zone around $3,000. Structure favors bulls.

ETHEREUM BREAKOUT CONFIRMED!Hey Traders!
If you’re finding value in this analysis, smash that 👍 and hit Follow for high-accuracy trade setups that actually deliver!
After months of consolidation inside this massive symmetrical triangle, ETH finally breaks out on the daily chart—and this could be the spark for the next major rally! 🔥
📈 Structure: Symmetrical Triangle
✅ Breakout Confirmed
📍 CMP: ~$2,760
🎯 Next Major Target: $5,000+
This is the breakout bulls have been waiting for! If momentum sustains, ETH could enter price discovery territory soon. Buckle up—the real move might just be beginning. 🚀
Let’s see how far it runs from here!
Drop your targets in the comments 👇

Why Ethereum’s Will 10×🚀 Ethereum’s Next 10×: Why bank-grade adoption + the stable-coin avalanche make a moonshot look conservative
Big banks are building on-chain right now. JPMorgan & Bank of America began 2025 pilots for dollar-backed tokens that settle on Ethereum, while Societe Generale just unveiled its USD CoinVertible stable-coin on main-net.
Stable-coins already move more money than Visa + Mastercard combined. $27.6 trillion flowed through stable-coins in 2024—most of it routed over Ethereum block-space.
Ethereum clears four-fifths of that stable-coin volume. More than 80 % of all stable-coin transactions occur on ETH or its L2s, locking in network effects that rivals can’t match.
ETF wall-of-money is already hitting the gate. 2025 Ethereum ETFs posted a record $743 million month of inflows—the strongest vote of institutional confidence to date.
ETH supply keeps shrinking while demand spikes. Post-Merge burn has removed roughly 332 k ETH, flipping issuance negative; base-line inflation is now < –1.3 %/yr.
30 million ETH is locked in staking, slicing liquid float by 25 %. The yield engine tightens supply just as banks and ETFs need inventory.
Real-world assets are going token-native. Tokenized bond issuance jumped 260 % in 2024 to €3 billion, and virtually every pilot settles on ERC-standards.
Layer-2 roll-ups slashed average gas fees to <$4. Cheaper block-space makes day-to-day payments viable, driving still more stable-coin throughput (and fee burn).
User base is exploding toward mass scale. Active ETH wallets hit 127 million—up 22 % YoY—showing that retail, devs, and institutions are onboarding together.
Energy-efficient PoS removes the last ESG roadblock. With > 99 % less energy use than PoW chains, Ethereum checks the sustainability box that banks and asset managers need for wide-open deployment.
Bottom line: when TradFi giants plug directly into Ethereum rails and stable-coins dwarf legacy payment rails, every transfer torches a little more supply. Add the ETF flywheel and a vanishing float, and a 10× move shifts from “moon-boy” to math.
OTHER EXAMPLES
TSLA
www.tradingview.com
Total 2
www.tradingview.com
MartyBoots here—trading for 17 years, and I would like to hear YOUR take!
👉 Can Ethereum really 10× from here? Drop your best argument below, hit the 👍 if you learned something, and smash that Follow to stay in the loop on every crypto deep-dive I post.

ETHUSDTThis is very easy...
best support level 2300 to 2500 for jump price. but was needed for jump price for get enrgy for movement to high levels by fake breakout.
First level of resistance 2800 to 3000.
⚠️Control Money Management in your capital.

$ETH clear for an impulsive move to $3600?CRYPTOCAP:ETH has slowly but surely cleared resistance, with just the swing high to tackle which will activate another trade signal in my Trade Signals Substack.
Major support High Volume Node, daily pivot and daily 200 EMA proved tough support and demand continues to come in.
ETFs had an astonishing amount of inflows yesterday at $200M+
Analysis is invalidated below $2100
Safe trading

Ethereum Analysis – Vitalik’s Gas Cap Proposal Adds PressureToday, I want to show you the possible moves for Ethereum ( BINANCE:ETHUSDT ) this week.
Please stay with me .
Let’s first take a look at the important news that has come for Ethereum in the last 24 hours :
Ethereum’s Gas Cap Proposal Sparks Concerns
Ethereum co-founder Vitalik Buterin recently proposed EIP-7983 , introducing a gas limit cap to prevent potential DoS (Denial of Service) attacks on the network.
Bearish Takeaways:
This proposal reveals a current vulnerability in Ethereum’s infrastructure. If gas limits grow unchecked, nodes may fail to sync, leading to possible network instability.
Imposing a gas cap could temporarily reduce transaction throughput, affecting DeFi protocols and NFT platforms that rely on Ethereum’s scalability.
The market tends to react cautiously to core protocol changes, and this uncertainty could trigger short-term selling pressure.
Bullish Counterpoints:
The cap aims to strengthen the network’s long-term stability against spam and DoS attacks.
It’s still in the proposal stage, with no immediate impact on users or network performance.
Conclusion:
While the long-term impact may be positive, the short-term uncertainty and exposed risks provide a bearish narrative for Ethereum, especially amid growing competition from alternative chains.
--------------------------------------
Now let's take a look at the Ethereum chart on the 4-hour time frame .
Ethereum is currently trading near the Heavy Resistance zone($2,929-$2,652) and Resistance lines , and is also trying to break the Support line .
In terms of the Elliott Wave theory , it seems that Ethereum has completed the Zigzag Correction(ABC/5-3-5) , so we can expect the next bearish wave .
I expect Ethereum to fall to at least $2,433 AFTER breaking the Support line, and if the Support zone($2,491-$2,323) is broken, we should expect further declines.
Second Target: $2,374
Note: Stop Loss (SL) = $2,689= Worst Stop Loss(SL)
Please respect each other's ideas and express them politely if you agree or disagree.
Ethereum Analyze (ETHUSDT), 4-hour time frame.
Be sure to follow the updated ideas.
Do not forget to put a Stop loss for your positions (For every position you want to open).
Please follow your strategy and updates; this is just my Idea, and I will gladly see your ideas in this post.
Please do not forget the ✅' like '✅ button 🙏😊 & Share it with your friends; thanks, and Trade safe.

#ETH Update #2 – July 10, 2025🟢 #ETH Update #2 – July 10, 2025
Ethereum has formed a new high above its previous impulsive leg. Although this peak is lower than the one a month ago, the current structure looks healthy. During this move, ETH left an imbalance around the 2373 level, which aligns closely with a potential retracement zone. Volume appears to be decreasing or reaching exhaustion, suggesting the rally may be losing strength. A correction towards 2685 could be on the table. For now, the setup does not favor either a long or short position.
