ETH NEW UPDATE (4H)This analysis is an update of the analysis you see in the "Related publications" section
Inside the red zone from the previous analysis, there was also a SWAP zone that price reacted to. The pullback trendline has also been broken. After re-evaluating the chart, the best area for a potential re-entry is the $2,165 to $2,250 range.
Do not enter a position without a proper setup and risk management | you could easily become market maker bait.
A daily candle close above the invalidation level would invalidate this bearish scenario.
For risk management, please don't forget stop loss and capital management
Comment if you have any questions
Thank You
Ethereum (Cryptocurrency)

SUSDTAnalysis is the same analysis, it just seems like the type of pattern is different... we have another low and then a high...

SHORT ON ETHEREUM ETH/USDEthereum has created a lower high after a triple top and is currently looking very bearish.
Huge imbalance to the downside to be filled.
I will be selling eth to the next demand level looking to catch over 500-600 points.

#ETH/USDT#ETH
The price is moving within a descending channel on the 1-hour frame, adhering well to it, and is heading for a strong breakout and retest.
We are seeing a rebound from the lower boundary of the descending channel, which is support at 2460.
We have a downtrend on the RSI indicator that is about to be broken and retested, supporting the upward trend.
We are looking for stability above the 100 moving average.
Entry price: 2506
First target: 2550
Second target: 2600
Third target: 2656

ETHUSD: The Market Is Looking Down! Short!
My dear friends,
Today we will analyse ETHUSD together☺️
The price is near a wide key level
and the pair is approaching a significant decision level of 2,512.0 Therefore, a strong bearish reaction here could determine the next move down.We will watch for a confirmation candle, and then target the next key level of 2,501.7..Recommend Stop-loss is beyond the current level.
❤️Sending you lots of Love and Hugs❤️

$ETH - New ATH This Year! But it takes time (as usual)I tend to believe the patience pays off
A sharp growth of almost X2 earlier this year granted #Ethereum an opportunity to take hold above major support levels and CRYPTOCAP:ETH gladly took this chance. Now the price is staying above the $2100 - $2400 support zone.
If you are looking for a safe way to X2 your capital this year, you should definitely consider buying Ethereum in this price range.
In fact, there are two possible options of further price movements:
Orange path (~33%) : light touch of the support zone, followed by a sharp pump upwards towards the $3200 resistance by the month of August 2025. Then some consolidation there and continuation with the coming of Autumn (traditionally bullish season for crypto) .
Red path (~66%) : a full-fledged dive in the support zone, down to $2150 (shadows can even reach $1950ish zone) . It will take more time, but allow people to build more proper positions, if they have not done so already. This dive can also help in gathering liquidity (from liquidating early LONGs with high leverage, everything with lev. higher than x6 will be washed down) that will later be used for pushing the price higher .
As you could understand, I'd prefer the second option , but those who know Ethereum erratic behaviour they just... know. I will start accumulating CRYPTOCAP:ETH once it reaches $2450 and will continue doing it down to $2100 using x5 leverage (if such price will ever be achieved) .
Target is $4500 - $5000. Being realistic here.


ETH New Update (4H)After being rejected from the higher levels and losing the trigger line, Ethereum now appears to have pulled back into the range zone and the trigger line.
It is expected that the price will be rejected once again from the red zone to the downside, and then turn bullish again from one of the two green zones and move upward.
This is our current outlook on Ethereum. The analysis will be updated accordingly.
Keep in mind that taking short positions in these zones is not low-risk either!
For risk management, please don't forget stop loss and capital management
Comment if you have any questions
Thank You

ETHUSD Is Going Down! Sell!
Here is our detailed technical review for ETHUSD.
Time Frame: 1D
Current Trend: Bearish
Sentiment: Overbought (based on 7-period RSI)
Forecast: Bearish
The market is trading around a solid horizontal structure 2,485.23.
The above observations make me that the market will inevitably achieve 2,013.51 level.
P.S
We determine oversold/overbought condition with RSI indicator.
When it drops below 30 - the market is considered to be oversold.
When it bounces above 70 - the market is considered to be overbought.
Disclosure: I am part of Trade Nation's Influencer program and receive a monthly fee for using their TradingView charts in my analysis.
Like and subscribe and comment my ideas if you enjoy them!

ETH. seed at 2400 zone today. Poised for +1000$ price growth.ETH was met with a good healthy correction back to 38.2 Fib. An ideal retracement zone for new buyers to converge.
ETH was able to tap 2800 zone before retreating back to -400 -- and everything is moving based on expectation. The current behavior just made the bull scenario much attractive now conveying some healthy metrics for the bulls.
Best to seed at the current price as 2400 levels. Based on our diagram this is replicating the same structure as the last surge from 1500 area last April 2025.
From this range hibernation, we can see some good setup forming for the BULLS -- an apparent accumulation zone in progress.
Don't miss out if you missed the last pump -- its your chance today. It does'nt come often.
Spotted at 2400
Mid Target at 3400.
* The chart above is in USDETH, an eth reverse metrics -- depicting the heavy gravity bears at the moment. Bulls are about to take over soon.
TAYOR.
Trade safely.

Ethereum: No Sellers, No Bears, No Pressure; Bullish ConfirmedTo put it simple, there is absolutely no selling pressure on ETHUSDT. And this is reasonable, Ethereum is now so cheap that not many people are looking to sell.
Let's dive into this chart and see what we can find.
Spoiler alert: I am no longer bearish on ETHUSDT. "The retrace" simply isn't a thing on this pair. There is no bearish action. Let's read the chart and see what it has to say.
The low 7-April... Ok.
8-May ETHUSDT produced a very strong green candle to break above EMA55 and EMA89. Volume was also high on this date. These levels tend to work as strong resistance and the fact they broke decisively, means that the bullish bias is confirmed and Ethereum isn't likely to move back below again. Whenever there is a drop, these lines will work as support.
The peak soon happened and Ethereum went sideways, it has been sideways in a small phase of consolidation. The lowest point came 18-May. There was a failed attempt by the bears to push prices lower but this ended as a big fail. Ethereum continues strong.
Here we have again EMA55 and EMA89, magenta and blue lines on the chart. These levels remain untested as support which is a signal of strength. While some pairs went down 20%, 30%, 50%, Ethereum's maximum drop has been 14%, now, that's strength.
As seen from the diagram on the chart, we are about to enter the third wave of a bullish impulse. There can be a correction after the third wave ends followed by additional growth.
The break of EMA55/89 as resistance confirms that Ethereum is bullish mid- to long-term. This means 3-6 months of growth.
Once MA200 is broken as resistance, we have at least six months of bullish growth confirmed, this will happen later this month.
No bears means the bulls are in control.
A very small retrace means buyers are strong.
It all makes sense, who would be willing to sell their Ether when there is so much room left for prices to grow?
No one, that is why prices remain strong.
Adapt to market conditions fast and live.
Some pairs are going down while others are going up.
Some pairs are sideways; some are growing strong.
This is the early stage of the 2025 bull-market, just wait and watch... Just watch! It will get wild faster than you think and it will become so wild that you won't be able to handle the market at all. Everything will become so good, so fast, that you will feel blessed for deciding to enter the Cryptocurrency market during April's low.
It is still early though, remember, $7,000 is the minimum price for Ethereum in late 2025. $11,000 is also possible.
Thanks a lot for your continued support.
Namaste.

Is Ethereum Back In Business? A Confluence of Bullish Patterns Is Ethereum Back In Business? A Confluence of Bullish Patterns, Brutal Liquidations, and Fundamental Strength
The cryptocurrency market is a theater of perpetual drama, a relentless cycle of fear and greed, innovation and volatility. In this unforgiving arena, Ethereum, the world’s second-largest digital asset, has once again captured the spotlight. After a period of underperformance that left investors questioning its momentum, a confluence of technical signals, market-shaking liquidations, and strengthening fundamentals has ignited a fierce debate: Is Ethereum truly back in business? The answer is not a simple yes or no but a complex narrative woven from bullish chart patterns, the chaotic fallout of political spats, and the quiet, inexorable growth of its underlying network.
At the heart of the bullish thesis lies a classic technical analysis signal: the Morningstar candlestick pattern. For traders and analysts who scour charts for clues about future price movements, the appearance of a Morningstar on Ethereum's monthly chart is a development of profound significance. Simultaneously, the market has been violently shaken by an $800 million liquidation event, a brutal culling of leveraged positions in both Bitcoin and Ether, reportedly triggered by a public feud between political and tech titans Donald Trump and Elon Musk. This event serves as a stark reminder of the market's fragility and its susceptibility to external shocks.
Yet, beneath this surface-level chaos, a different story is unfolding. On-chain metrics point to a network that is not just surviving but thriving. Institutional interest is surging, evidenced by substantial inflows into newly approved spot Ethereum Exchange Traded Funds (ETFs). Whales, the market's largest players, are sending mixed but largely accumulative signals. And technological upgrades continue to enhance the network's scalability and utility. This article will delve into these competing narratives—the hopeful story told by the Morningstar pattern, the cautionary tale of massive liquidations, and the quietly confident hum of Ethereum's fundamental growth—to paint a comprehensive picture of where the pioneering smart contract platform stands today.
The Morningstar's Dawn: A Technical Harbinger of a Bullish Reversal
In the lexicon of technical analysis, candlestick patterns provide a visual language for market sentiment. The Morningstar is one of the most revered bullish reversal patterns, a three-candle formation that often signals the end of a downtrend and the beginning of a new upward climb. Its appearance on a high-timeframe chart, such as the monthly chart for Ethereum, carries significant weight, suggesting a major shift in market psychology from bearish despair to bullish optimism.
To understand its power, one must first understand its structure. The pattern consists of three distinct candles appearing after a prolonged price decline. The first is a long bearish candle (typically colored red or black), which confirms the continuation of the downtrend and reflects the sellers' firm control. The second candle is the "star" of the pattern—a small-bodied candle that can be either bullish or bearish. This candle often gaps down from the previous one, indicating a moment of acute indecision in the market. The selling pressure that characterized the first candle has waned, but buyers have not yet seized full control. It represents a point of equilibrium, a pause where the prevailing trend loses its momentum. The third and final candle is a long bullish candle (typically green or white) that closes well into the body of the first bearish candle. This final candle is the confirmation; it signifies that buyers have decisively taken over, overwhelming the sellers and initiating a reversal.
The psychology behind the Morningstar pattern is a story of a power shift. The long bearish candle shows sellers are confident. The small middle candle reveals that confidence is cracking; a battle for control is underway. The final strong bullish candle declares the buyers as the victors, signaling that the path of least resistance is now upwards.
Recently, several crypto analysts have highlighted the formation of this very pattern on Ethereum’s monthly chart. After a period of consolidation and price decline, the emergence of a Morningstar suggests that the bottom of the recent downtrend may be in. Analysts see this as a macro reversal signal, a technical foundation for a potential rally. Some have set initial price targets around $3,300, viewing the current resistance levels as temporary hurdles that will likely be broken in the face of this powerful bullish formation. When combined with other indicators, such as trading volume, which ideally should increase during the formation of the third candle, the Morningstar provides a compelling technical argument that Ethereum is gearing up for a significant move higher. While no technical pattern is infallible, its appearance on a macro scale has undeniably injected a strong dose of optimism into the market, suggesting that Ethereum’s period of slumber may be coming to an end.
The $800 Million Purge: A Tale of Liquidations and Political Tremors
Just as technical analysts were celebrating the bullish omens on the charts, the market delivered a brutal reminder of its inherent volatility. A massive liquidation event, totaling over $800 million and by some estimates approaching $1 billion, swept through the cryptocurrency markets, disproportionately affecting leveraged traders in Bitcoin and Ethereum. In a span of just 24 hours, hundreds of thousands of traders saw their positions forcibly closed, a cascade of selling that sent prices tumbling.
Liquidations are the boogeyman of leveraged trading. When a trader uses borrowed funds (leverage) to amplify their position, they must maintain a certain amount of collateral. If the market moves against their position and their collateral falls below a required threshold, the exchange automatically closes the position to prevent further losses. This forced selling creates a domino effect. As prices fall, more long positions hit their liquidation points, triggering more selling, which in turn drives prices down further, liquidating even more positions. This is a liquidation cascade, and it can lead to rapid and violent price drops.
Recent data showed that long positions accounted for the overwhelming majority of these liquidations, indicating that the market was caught off guard by the sudden downturn. Exchanges like Bybit and Binance were at the epicenter of this financial storm, with Bybit alone reportedly accounting for nearly $354 million in liquidations. The largest single liquidation order was a multi-million dollar position, underscoring the high stakes involved.
What triggered this sudden market panic? Many analysts pointed to an unlikely source: a public and increasingly acrimonious feud between former U.S. President Donald Trump and Tesla CEO Elon Musk. The dispute, reportedly stemming from disagreements over a major tax and spending bill, spilled out onto social media, creating a storm of uncertainty that rattled investors. In today's interconnected world, high-profile clashes between powerful figures can have an immediate and tangible impact on financial markets, particularly on assets perceived as "risk-on," such as cryptocurrencies.
The public fallout was seen as a destabilizing event, injecting political uncertainty into an already fragile market. The fear was that the conflict could have broader economic implications or affect the regulatory landscape for technology and digital assets. This sentiment sparked a broad-based sell-off, not just in crypto but across traditional equities as well. For a market driven heavily by narrative and sentiment, the Trump-Musk tussle provided a powerful bearish catalyst, spooking investors and triggering the cascade of liquidations that sent Bitcoin and Ethereum prices sharply lower. The event serves as a crucial counterpoint to the bullish technical picture, highlighting how susceptible the crypto market remains to macroeconomic and political shocks, regardless of its own internal fundamentals.
The Bullish Undercurrent: On-Chain Metrics and Institutional Adoption
While the liquidation event painted a picture of chaos and fear, a deeper dive into Ethereum's on-chain data and ecosystem developments reveals a much more optimistic and resilient narrative. These fundamental metrics, which track the health and growth of the network itself, often provide a clearer long-term signal than the noise of short-term price fluctuations.
A Thriving and Growing Network
One of the most reliable indicators of a blockchain's long-term value is its network activity. On this front, Ethereum is showing undeniable strength. The number of unique active addresses interacting with the blockchain has been on a steady rise. Recent data shows a significant surge, with weekly active addresses surpassing 17 million, a testament to growing engagement and adoption. This isn't just speculative trading; it reflects genuine usage across Ethereum's vast ecosystem, including decentralized finance (DeFi), non-fungible tokens (NFTs), and Layer 2 scaling solutions.
Furthermore, the growth in new users joining the network is a powerful leading indicator of future demand. The rate of new address creation has been on an upward trajectory, signaling that Ethereum's value proposition continues to attract a broader audience. This organic growth is the lifeblood of any network, creating a flywheel effect: more users attract more developers, who build more valuable applications, which in turn attract even more users.
The Rise of Layer 2 and Technological Upgrades
A key driver of this network growth has been the maturation of Layer 2 scaling solutions like Arbitrum, Optimism, and Base. These networks handle transactions off the main Ethereum chain, allowing for faster speeds and dramatically lower fees while still inheriting Ethereum's security. The explosion of activity on these Layer 2s has been a game-changer, alleviating congestion on the main network and making Ethereum accessible to a wider range of users and applications.
Simultaneously, core protocol upgrades continue to enhance Ethereum's capabilities. The recent Pectra upgrade, for example, has improved scalability and further refined the network's deflationary mechanics. Since the implementation of EIP-1559, a portion of every transaction fee is "burned," or permanently removed from circulation. This, combined with the vast amount of ETH locked in staking contracts, creates a dynamic where the supply of available ETH is constantly shrinking. This principle of decreasing supply coupled with increasing demand is a fundamental recipe for long-term price appreciation.
The Arrival of Institutional Capital
Perhaps the most significant bullish development for Ethereum in recent times has been the approval and successful launch of spot Ethereum ETFs in the United States. This provides a regulated and accessible on-ramp for institutional investors to gain exposure to ETH, unlocking a potential wave of new capital. The early data is promising. In May 2025 alone, spot Ethereum ETFs recorded net inflows of over half a billion dollars, a sharp increase from the previous month.
This institutional validation is a powerful signal. It signifies that some of the world's largest financial players view Ethereum not just as a speculative asset, but as a foundational technology with long-term strategic value. This flow of "sticky" institutional money is expected to provide a strong support floor for the price and reduce volatility over the long run.
The Whale Watch: Accumulation and Confidence
The behavior of "whales"—large holders of Ethereum—provides another crucial, albeit sometimes conflicting, layer of insight. On one hand, there have been reports of significant accumulation by these large players. Data shows massive transfers of ETH from exchanges to private wallets, a classic sign of long-term holding, as it reduces the immediately available supply for selling. One notable transaction involved Galaxy Digital moving hundreds of millions of dollars worth of ETH into a private wallet, suggesting strong institutional confidence. Over the past month, data from on-chain analytics firms has shown that whale wallets have increased their holdings, while retail holdings have slightly decreased, a pattern often seen before a bullish market run.
However, the picture is not entirely one-sided. There have also been instances of long-term whales selling off portions of their holdings, contributing to short-term price drops. This reflects the diverse strategies among large holders. Some may be taking profits, while others are positioning for a long-term hold. Despite the mixed short-term signals, the broader trend appears to be one of accumulation and a net outflow of ETH from exchanges, which is a fundamentally bullish indicator. With exchange balances hitting seven-year lows, the potential for a supply squeeze is becoming increasingly real.
Conclusion: Navigating the Storm Towards a Bullish Horizon
So, is Ethereum back in business? The evidence suggests a resounding, if complex, "yes." The current market environment is a fascinating juxtaposition of short-term turmoil and long-term strength. The public spat between Trump and Musk, and the subsequent $800 million liquidation event, underscore the market's vulnerability to sudden shocks and the perils of leveraged trading. These events serve as a healthy dose of caution, reminding investors that the path forward will undoubtedly be volatile.
However, when we look past the immediate noise, the underlying picture is one of robust and accelerating health. The Morningstar pattern on the monthly chart provides a powerful technical signal that a macro trend reversal is underway, suggesting that the recent period of bearish sentiment has exhausted itself. This technical optimism is strongly supported by fundamentals. Ethereum's network is growing at a remarkable pace, fueled by the success of Layer 2 solutions and continuous protocol improvements that enhance its scalability and economic model.
The most compelling evidence, however, comes from the demand side. The launch of spot Ethereum ETFs has opened the floodgates for institutional capital, a structural shift that will likely define Ethereum's market for years to come. This, combined with the steady accumulation by whales and a shrinking available supply due to burning and staking, creates a powerful bullish cocktail.
Ethereum is navigating a perfect storm of conflicting signals. The violent waves of short-term liquidations and political drama can be disorienting. But beneath the surface, the deep currents of network growth, technological innovation, and institutional adoption are flowing strongly in one direction. For investors who can look beyond the immediate horizon, the story told by Ethereum's fundamentals, supported by classic bullish chart patterns, is not just one of being "back in business"—it's a story of a platform solidifying its position as a cornerstone of the decentralized future.

Ethereum Danger Zone —Protection, Correction or Continuation?Ethereum can be seen trading below EMA55 on the 4H timeframe. The biggest volume session happened 9-May and it was red. This tells us that there is correction potential after a very strong 101.1% bullish growth wave.
There are mainly three levels to consider for the correction potential after ~100% growth. 0.382, 0.618 & 0.786 Fib. retracement levels. After the test of these levels, whichever one comes last, we can read the chart again and see if Ethereum will continue lower or produce a bullish wave.
One thing is very certain though, after strong growth, there is always a correction/retrace. This is what you are seeing now in this chart. The start of the drop. Taking action is best.
The market moves in waves and will never stop this pattern, it fluctuates. To trade, one buy lows near support; sells high when resistance hit. 100% growth is very strong for the second biggest Cryptocurrency project, the #1 Altcoin.
After a strong bullish wave there is always a correction. After the correction there can be more correction but at some point the market turns. Each chart/pair needs to be considered individually on multiple timeframes to have a better understanding as to what will happen next.
In a single day, based on the news, market conditions can always change. Stay alert!
Namaste.

Ethereum, Guessing The Next Move ($1,500 or $2,000?)The million dollars question; What about Ethereum, lower or recovery?
And this is truly a million dollars question because knowing the answer can make you millions. It can either safe you lots of money or it can make you lots of money.
👉 Ethereum is going lower.
The 18-May low happened at $2,323, and this low wasn't challenged, the drop yesterday ended as a higher low. But, there is something... We lost some important support levels.
ETHUSDT lost the 0.236 Fib. retracement, when this happens, the action tends to move to the next lower-level which is below the 18-May low.
Looking at the 4H TF, ETHUSDT lost EMA55 and MA200, so these are also pointing lower.
Just a few days back I mentioned $2,000 entry LONG opportunity for Ethereum, this price might be possible but it is still really early.
The market has been sideways and this breakdown is new. It would be good to wait for the weekly session close to see what prices we will get, without this information, I can say that it is still too early to say, but I can still make my guess. My guess is that it is going lower.
Thank you for reading.
Namaste.

Ethereum & June's pivot supportEthereum price is now playing below the 200 daily MA, but the price about 2350 is the pivot and holding as a support, and I'm expecting to see upside movement in the coming days to about 3400 which is the resistance 2 for the pivot.

Ethereum's Downtrend Pauses—Reversal or Further Drop?FenzoFx—ETH/USD currently trades around $2,480, ranging between $2,336.0 support and $2,797.0 resistance. Given the recent break of structure, the bearish trend may resume, targeting $2,336 as the next liquidity trap.
This level may offer a discounted entry for long positions. Traders should watch for bullish signals like candlestick patterns and fair value gaps on lower timeframes (M5, M15) during the NY session.

BTCUSDTHello Traders! 👋
What are your thoughts on BITCOIN?
Bitcoin entered a corrective phase after a liquidity hunt above the recent highs and is currently in a short-term pullback.
We expect this correction to extend toward the identified support levels, after which a new bullish wave may begin, potentially leading to fresh all-time highs.
The broader trend remains bullish, and the current correction could offer a buy-the-dip opportunity in line with the ongoing uptrend.
Don’t forget to like and share your thoughts in the comments! ❤️

TOTAL Crypto Market. Games with the 800-Pound Gorilla. Series IIOver the 4 months since Donald Trump’s inauguration in January 2025, his administration’s policies have had a complex and in many ways negative impact on cryptocurrency markets, despite the overall pro-crypto agenda.
Short-Term Market Volatility Due to Tariff Policy
One of the most significant negative impacts has been caused by Trump’s aggressive tariff policy. The announcement and subsequent implementation of new tariffs sent shock waves through global financial markets, including cryptocurrencies.
The immediate effect has been increased volatility, with Bitcoin down a third from its highs, Ethereum and many other major coins also falling by more than half, and crypto futures seeing liquidations of over $450 million in a single day.
This turbulence was not isolated — experts noted that broader “risk aversion,” in which investors flee volatile assets for safer havens like gold, led to sharp declines in both the stock and crypto markets.
Uncertainty around tariffs — particularly reciprocal tariffs affecting up to 25 countries — created short-term headwinds for cryptocurrencies. As institutional and foreign investors pulled billions out of U.S. stocks, the resulting market volatility spilled over to cryptocurrency, which remains closely tied to tech indexes like the NASDAQ. This risk aversion delayed potential rallies and led to a volatile, unpredictable trading environment.
Regulatory Rollbacks and Market Integrity Concerns
The Trump administration has aggressively rolled back regulatory oversight in an attempt to create a more crypto-friendly environment. Key steps include disbanding the Justice Department’s National Cryptocurrency Enforcement Team (NCET), appointing pro-crypto officials to regulatory bodies, and directing agencies to streamline or repeal existing crypto regulations. While these actions have reduced the compliance burden on crypto businesses and spurred innovation, they have also raised serious concerns about the integrity of the market.
Critics argue that loosening oversight increases the risks of money laundering, fraud, and illegal transactions, which could undermine investor protections and the overall reputation of U.S. crypto markets.
Consumer advocacy groups warn that rapid deregulation could encourage abuse and undermine trust, especially since the Trump administration has also banned the development of a U.S. central bank digital currency (CBDC), setting the U.S. apart from other major economies pursuing digital currency initiatives.
Conflicts of Interest and Ethical Controversies
Another negative impact has been the perception — if not the reality — of conflicts of interest and ethical dilemmas. The Trump family’s direct involvement in crypto projects, including the launch of a stablecoin and investments in mining, has fueled suspicions of market manipulation and blurred the lines between personal and presidential interests.
Such controversies have further undermined investor confidence and contributed to a sense of unpredictability in regulatory and market outcomes.
Summary Table: Key Negative Impacts
Policy/Action =>> Negative impact on crypto markets
Rising Tariffs and Trade Uncertainty =>> Increased volatility, risk aversion, falling prices.
Regulatory Rollbacks/NCET Dissolution =>> Weakened oversight, higher risk of fraud and abuse.
CBDC Development Ban =>> US Lagging Global Digital Currency Innovation
Trump Family’s Direct Involvement in Crypto =>> Alleged Conflicts of Interest, Market Manipulation Concerns.
Technical Challenge
The technical picture in the main crypto market cap chart CRYPTOCAP:TOTAL points to the end of the recovery period, reaching a key resistance near the $3.5 trillion mark.
Conclusion
While the Trump administration has promoted a more liberal environment for crypto innovation, the last four months have seen significant negative effects: increased market volatility due to tariff policy, increased risk due to deregulation, and growing concerns about conflicts of interest.
These factors have combined to create an atmosphere of uncertainty and skepticism, which is undermining the stability and trust in the US crypto markets in the short term.
--
Best wishes,
@PandorraResearch Team 😎

Ethereum (ETH/USD) Technical Analysis — Bearish Rejection Below 🔍 Ethereum (ETH/USD) Technical Analysis — Bearish Rejection Below Resistance ⚠️
📅 Date: June 4, 2025
📊 Chart Type: 2-Hour Timeframe
💱 Exchange: Binance
---
🧠 Overview:
The chart displays a clear range-bound market between well-defined resistance and support zones. The most recent price action suggests a rejection from the resistance region, hinting at a possible downward move toward support.
---
🟧 Key Levels:
Resistance Zone: $2,720 – $2,760
Price has tested this zone multiple times and failed to break above decisively.
Marked as a strong supply area where sellers dominate.
Support Zone: $2,460 – $2,490
This area has historically attracted buying interest, causing price reversals.
---
📉 Market Structure & Price Action:
The recent swing high formed a lower high relative to the peak on May 29, suggesting bearish momentum.
A projected bearish move is marked on the chart with a blue arrow 📉, forecasting a drop from around $2,640 down to the support zone near $2,480.
Multiple failed attempts to break resistance signal a potential trend continuation to the downside within this trading range.
---
⚠️ Trading Implications:
Short-term bias: Bearish 🔻
Confirmation needed: A breakdown below $2,600 with volume would strengthen bearish conviction.
Target for bears: $2,480 support area
Invalidation zone for this outlook: A breakout and close above $2,760 would shift the bias to bullish.
---
📌 Conclusion:
Ethereum is currently trading within a well-defined horizontal channel. With the latest rejection near resistance, the probability favors a move down to the support area. Traders should monitor key levels closely for confirmation before entering positions.
📈 Tip: Use proper risk management and watch for candlestick confirmation at critical levels.

ETH Bullish | Inverse H&S | Cup and Handle PatternEthereum is still dragging its feet towards a new ATH, or at least, towards a high. But there are some positive signs showing up on the chart.
Make sure to check out yesterday's update on Bitcoin:
____________________________
BINANCE:ETHUSDT

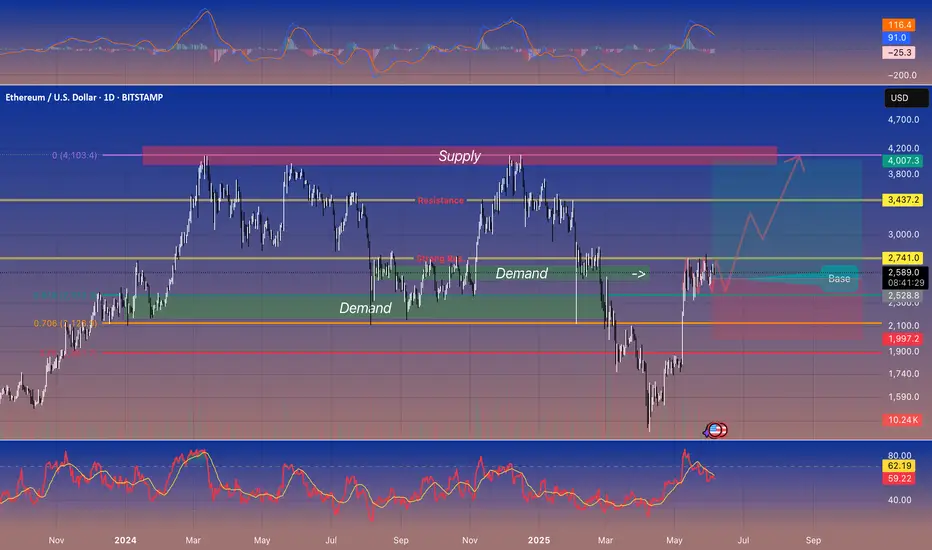
Ethereum (ETHUSD) • Daily • Trading ideaEthereum (ETHUSD) • Daily Chart 🚀
---
🔑 Key Levels
* Demand Zone (Support): \$2,350–2,550
* Price has bounced here twice in the last year.
* Immediate Resistance: \$2,741
* Multiple rejections around this level recently.
* Next Major Resistance: \$3,437
* Former highs in late 2024/early 2025.
* Big Supply Zone (Strong Sell Area): \$4,000–4,200
---
💡 What’s Happening?
* ETH is sitting in a “base” between \$2,528–2,741 (green box).
* If it breaks above \$2,741 on strong volume, it can run toward \$3,437 and eventually \$4,000+.
* If it falls below \$2,528 (demand), the next support is around \$1,997.
---
🎯 Trade Idea
* Bullish Entry: Buy on a daily close above \$2,741 + higher-than-usual volume.
* First Target: \$3,437 (take partial profit).
* Final Target: \$4,000–4,200 (major sell area).
* Stop-Loss: Below \$2,500 (just under support).
* Bearish Scenario:
* If price drops below \$2,528 with big volume, look for a possible move down toward \$1,997.
---
📈 Indicators (Confirmation Only)
* Volume: Watch for a spike on any breakout above \$2,741.
* MACD & RSI: If both are rising (not overbought), it adds confidence—though price and volume matter most.
---
👍 Summary
ETH is coiling in a strong support zone. A clean break above \$2,741 on good volume can send it to \$3,437, then \$4K+. If support fails, \$1,997 is next. Trade with proper stops and watch volume for confirmation.
— Feel free to leave a 🚀 if this helps!
#Ethereum #ETHUSD #Crypto #Support #Resistance #Volume
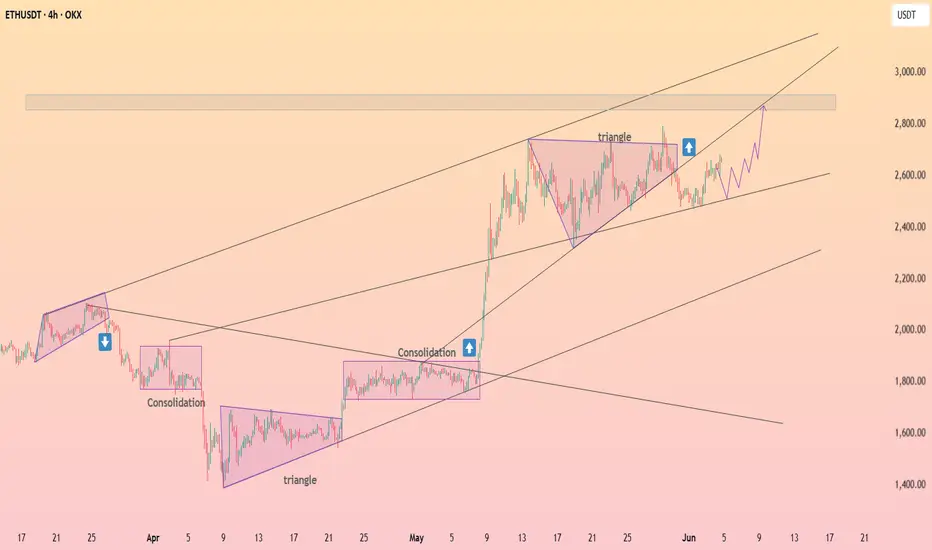
HolderStat┆ETHUSD channel climbCRYPTOCAP:ETH cruises within a steep four-hour rising channel; the latest triangle breakout paused near 2.6 k. Converging trendlines, former consolidation support and higher-low structure all aim for the 2.9 k liquidity zone. Bulls steer while the channel median holds.
ETHCHAN. Vitalik like it.ETHCHAN with a strong narrative experiences fluctuations and now the price can make a Fibo bounce.
