Ethereum | ETH | Long at $2,598.77Currently within my historical simple moving average area and consolidating. I suspect a move up is imminent, but 100% speculation. Crypto "bros" know more than I do.
Targets into 2028:
$4,000 (+53.9%)
$5,500 (+111.6%)
Ethereum (Cryptocurrency)

ETH: Buying in the DipCME: Micro Ether Futures ( CME:MET1! ), #microfutures
On May 22nd, #Bitcoin reached a new all-time high of $111,814. The king of cryptos rallied as bullish sentiment built up behind the most pro-crypto U.S. administration. As of last Friday, bitcoin realized a one-year return of +90.8%. For comparison, holding S&P 500 only yields 11.8% for a year, even after the US stock index made its ATH last week.
Meanwhile, #Ethereum, second only to Bitcoin in the cryptocurrency world, experienced a dramatic decline in 2025. ETH is currently trading around $2,500, down 40% since December. It is a far cry from its ATH of $4,815 on November 9, 2021.
Why Is Ethereum (ETH) Falling?
The most significant challenge facing Ethereum is the proliferation of Layer 2 scaling solutions. Networks such as Arbitrum, Base, and Optimism were developed to address Ethereum's scalability issues, but they've created a revenue problem for the main chain.
When users conduct transactions on these Layer 2 networks, transaction fees flow to third-party organizations rather than to the Ethereum network itself. Revenue diversion has weakened Ethereum's economic model.
Ethereum could counter the revenue erosion by implementing a fee on Layer 2 transactions. However, it would undermine the very purpose of these networks. Layer 2 solutions were designed specifically to reduce transaction costs by processing operations off-chain and submitting only batched results to the main network. Adding fees would increase costs and diminish their competitive advantage.
Increased competition in the blockchain space has further eroded Ethereum’s dominance. Investors have been withdrawing funds from Ethereum and redirecting them to competing projects with potentially better returns or technological advantages.
Future Outlook
Ethereum’s path forward appears challenging. While the platform still hosts thousands of decentralized applications and maintains a large developer community, its economic model is under pressure from multiple directions. Without finding new ways to generate value, Ethereum may continue to lose market share to more nimble competitors.
The platform’s supporters point to upcoming technical improvements and the maturation of the proof-of-stake consensus mechanism as potential catalysts for recovery. The recent approval of staking enabled ETF for Ethereum in Hong Kong is one of the ways forward. However, with increasing competitive pressures, Ethereum faces an uphill battle to reclaim its former status as the undisputed leader in smart contract platforms.
While the future remains challenging, Ethereum still has upside potential at the current price level. As ETH dropped below $1,500 in April, bargain hunters came in to scoop it up. As a result, ETH had a spectacular rebound of 70% in the last three months, outrunning Bitcoin’s 25% gain for the same period.
There are over 17,000 cryptocurrencies in existence, according to Coin Gecko. However, only a handful of them have proven to have a lasting investment value. We could refer to Bitcoin and Ethereum as the digital form of Gold and Silver. Historical trend shows that the spike in gold prices would likely prompts investors to buy silver at a lower cost, helping maintain a stable Gold/Silver price ratio. The same could be true for the BTC/ETH relationship.
For extensive reading, please refer to my Editors’ Picks, The Gold-Silver Ratio Explained, published on TradingView on April 28th.
Recent regulations on #stablecoins in the US and Hong Kong are good news to the crypto space. It legitimates crypto offerings from mainstream financial institutions. Bitcoin is positioned for another big lift as investors reallocate assets into cryptos.
On July 4th, President Trump signed into law the “Big and Beautiful Bill”. Above all, this massive package funds deficit spending and raises the national debit by $5 trillion. While we will carry the debt burden for many years, in the short run, injecting huge liquidity into the economy and the financial market would pop up asset prices.
The latest CFTC Commitments of Traders report shows that, as of June 24th, the total open interest for Micro Ether futures are 128,500 contracts.
• Leverage Fund has 94,167 in long, 112,442 in short, and 1,854 in spreading
• The long-short ratio of 0.84 does not provide a good indication of what the “Smart Money” views about Ethereum.
In summary, I hold the view that ETH may regain ground above 3,300 before year end. Investors sharing this bullish view could explore CME’s Micro Ether Futures ( NYSE:MET ).
Long Futures with Stop Loss
Last Friday, the August Ether Futures contract (METQ5) was settled at 2,518. Each contract has a notional value of 0.1 ETH, or a market value of $251.8. To buy or sell 1 contract, a trader is required to post an initial margin of $84. The margining requirement reflects a built-in leverage of 3-to-1. It’s cost-effective to invest with CME MET futures, vs. buying ETH from the spot market.
Let’s use a hypothetical trade to illustrate how the long futures with stop loss strategy would compare with buying spot ETH.
Hypothetical Trade:
• Buy 1 METQ5 contract at 2,518, and set a stop loss at 2,400
• Trader pays $84 for initial margin
High Price Scenario: Ethereum rises to $3,000
• Futures gain will be $48.2 (= (3000-2518) x 0.1)
• Futures return will be +57.4% (= 48.2 / 84)
• This compares to a 19.1% for investing in spot ETH. (= (3000 /2518) – 1)
Low Price Scenario: Ethereum drops to $2,000
• Futures stop loss at 2,400, and the maximum loss is $11.8 (= (2518-2400) x 0.1)
• Futures return will be -14% (=11.8 /84)
• This compares to a 20.6% loss for investing in spot ETH. (= (2000 /2518) – 1)
The above scenarios show that
• When ETH goes up, futures will have higher returns due to its leverage nature.
• When ETH falls, the stoploss will kick in to reduce losses.
Happy Trading.
Disclaimers
*Trade ideas cited above are for illustration only, as an integral part of a case study to demonstrate the fundamental concepts in risk management under the market scenarios being discussed. They shall not be construed as investment recommendations or advice. Nor are they used to promote any specific products, or services.
CME Real-time Market Data help identify trading set-ups and express my market views. If you have futures in your trading portfolio, you can check out on CME Group data plans available that suit your trading needs www.tradingview.com

ETHUSD: Next Move Is Down! Short!
My dear friends,
Today we will analyse ETHUSD together☺️
The in-trend continuation seems likely as the current long-term trend appears to be strong, and price is holding below a key level of 2,514.4 So a bearish continuation seems plausible, targeting the next low. We should enter on confirmation, and place a stop-loss beyond the recent swing level.
❤️Sending you lots of Love and Hugs❤️

BTC - Bullflag Pattern points to new ATHMarket Context
Bitcoin has been trading within a well-defined descending channel for several weeks now, respecting both upper and lower boundaries with precision (3 touches on the top, 2 on the bottom). This structure suggests an orderly pullback after a strong impulsive leg to the upside in Q2. As price compresses within this flag-like pattern, market participants are watching closely for signs of breakout or breakdown.
Bullish Fair Value Gap Reaction
Recently, price dipped into a Daily Fair Value Gap (FVG) and bounced strongly — a key bullish signal indicating that demand stepped in at the inefficiency. The FVG also aligns with a retest of the channel’s resistance-turned-support, further validating the bounce. This confluence zone acts as a springboard for potential continuation.
Channel Breakout & Liquidity Above ATH
Price has now broken above the channel structure, shifting the market narrative from consolidation to potential expansion. The breakout zone is located just beneath the All-Time High (ATH) — an area that’s likely loaded with stop orders and breakout buys. A sweep or clean break above the ATH would not only invalidate the prior bearish structure but also trigger a fresh wave of bullish momentum.
Bull Flag Continuation Potential
Structurally, this chart presents a classic bull flag breakout. After a strong impulsive leg up and a controlled consolidation phase, we now see bullish continuation potential toward the 112,000–114,000 region. If the ATH gets breached and reclaimed, it could become strong support in the next leg higher.
Final Thoughts
This is the type of setup that blends both technical precision and market psychology — structure, liquidity, and momentum all coming together. Whether you're already long or watching for confirmation, this move could set the tone for Bitcoin’s next major rally.
If you found this analysis helpful or thought-provoking, please give it a like! And let me know in the comments — do you see this as a true breakout or a trap in disguise?

ADA/USDT : First Target Reached, Ready for Next ? (READ)By analyzing the #Cardano chart on the 3-day timeframe, we can see that the price is currently trading around $0.57. After reaching the first target at $0.61, a slight correction occurred, but ADA has managed to hold above the key support level of $0.55 — which is a significant sign of strength. As long as this level holds, we can expect further bullish continuation.
The next potential targets are $0.76, $0.93, $1.05, and $1.33.
The Latest Analysis (Tap for More Details) :
Please support me with your likes and comments to motivate me to share more analysis with you and share your opinion about the possible trend of this chart with me !
Best Regards , Arman Shaban

Ethereum $5,791 followed by $8,500 Late 2025Ethereum is due a major, major bullish wave. No new highs since March 2024. Double-top December 2024.
The bear market ended June 2022. April 2025 marks a long-term higher low.
So the peak remains flat, March 2024 vs December 2024. While the bottom is rising, June 2022 vs April 2025.
You could say the top is a lower high of course, November 2021 vs 2024. This is also valid. Even with a lower high top a bullish wave is due leading to a minimum of around $3,800 or $4,000; back to baseline.
Now, if we really want to talk about minimum because we really don't care about worst case scenario, the fundamentals are improving and everything is getting better, consider $5,791. This would be the minimum. With the Ethereum ETFs and the 2025 bull market, we then open up $8,500 and so on. Growth potential is unlimited and we will have to use our imagination. These numbers are good though and definitely a strong level where action will happen. You will see some resistance, some something going on when Ethereum reaches these numbers.
Ethereum is due a major, major bullish wave. It is not a question of "if," it is a question of "when." When will it happen? "If it happens?" No! When, will it happen?
It will happen in 2025. You can be certain about it... Just watch!
....
Ethereum (ETHUSDT) has been consolidating two months above support. Support being $2,425. One week it broke below this level just to recover the next week. More than 8 weeks sideways wicking lower and higher.
The 7-April low, candle and rounded bottom, as well as long-term higher low makes this date a clear bottom. From the bottom we grow. Once the bottom is hit, the trend changes. The trend has been bearish since March 2024. A long time in Crypto term. We are in the bull market year, 2025. What is not happening now, is what will happen next.
The market was bearish for a long time and that's ok. The good news are the waves within cycles... We just came out of a strong correction; we have a small recovery and consolidation. The initial breakout is being consolidated before additional growth.
Lots of thinking, lots of reasoning, lots of studying... Everything you need to know is already present on the chart. Ethereum will grow. Mark by words. It is already happening.
Thank you for reading.
Namaste.

ETHUSD POTENTIAL LONGETHUSD potential bullish setup ↗️
ETH still showing bullish momentum. Might bounce on the bullish trend line, for now it’s hasn’t done the third touch so expect it go lower to the trendline first. A strong bullish confirmation would be a signal to go LONG. Share your thoughts on this in comment section.

Bitcoin [BTC1!] Draw and Bias. 05.07.25, SaturdayLooking for bullish action on BTC. No stance on alts.

ETH/USDT#ETH
The price is moving within a descending channel on the 1-hour frame and is expected to break and continue upward.
We have a trend to stabilize above the 100 moving average once again.
We have a downtrend on the RSI indicator that supports the upward break.
We have a support area at the lower limit of the channel at 2440, acting as strong support from which the price can rebound.
We have a major support area in green that pushed the price upward at 2440.
Entry price: 2500.
First target: 2545.
Second target: 2539.
Third target: 2641.
To manage risk, don't forget stop loss and capital management.
When you reach the first target, save some profits and then change your stop order to an entry order.
For inquiries, please comment.
Thank you.

ETH SWING TRADEETH Showing strong momentum against BTC, July is also good for eth and some alts, maybe we see correction in Aug, September but before expected pullback towards 2.9k-3k. Must use SL as market is very Volatile these days.
HolderStat┆ETHUSD correctedKUCOIN:ETHUSDT is moving inside a rising wedge after reclaiming support near $2,500. Recent breakout from consolidation supports a continuation push toward $2,720–$2,760. The current trendline structure and bullish price action suggest upside potential.

SOL/USDT : Strong Bullish Move Ahead?By analyzing the #Solana chart on the daily timeframe, we can see that the price is currently trading around $149.62. If the price holds above the key level of $146.28, we could expect the beginning of a strong bullish wave, potentially delivering over 25% short-term returns.
If this scenario plays out, the next bullish targets are $168.50, $187, $220, and $263.
(Personal research is strongly recommended for long-term investment decisions.)
Please support me with your likes and comments to motivate me to share more analysis with you and share your opinion about the possible trend of this chart with me !
Best Regards , Arman Shaban

ETH could be about to rip into a short-term rallyWhile the stock market has seen surprising upside in the past weeks (presumably due to pricing in rate cuts / a more positive liquidity picture / high expectations for Q2), crypto has lagged behind. I don't believe anything significantly above current prices - no matter in which market - is sustainable for now, but we can certainly milk it for whatever it's worth.
Notably, BTC has shown way more resilience and dominance in the current cycle so far. This makes sense in a high interest environment. However, within the bias of the markets pricing in expectations for rate cuts and as such more liquidity, we could also assume that demand for assets other than "safe havens" would now increase as well, leading us to the biased conclusion that we could see altcoins wildly outperforming BTC over the next weeks.
Indeed, if we look at the BTC chart, technicals such as VWAP stddevs show significantly less potential for upside if compared to ETH in the current moment in time. We therefore would focus on ETH at this point (as money flow seems to cycle BTC->ETH->Others).
PLEASE NOTE: SL and TP are not accurate. This is not a precise trading idea. Please use your own judgement in accordance with your trading style.

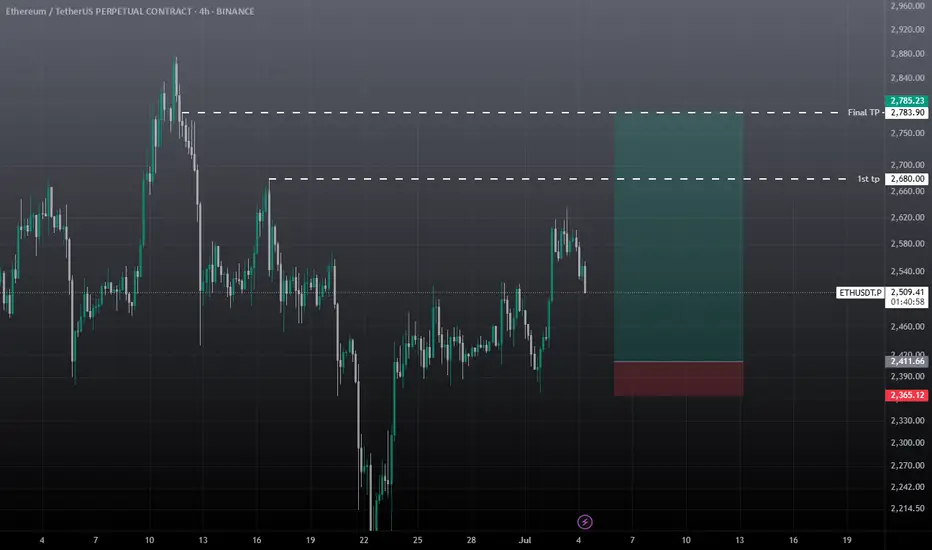
Ethereum Trading Strategy: 5:1 Risk-to-Reward Ratio"Ethereum Showing Strength on the 4-Hour Chart — A New Bullish Trend Emerging?"
The 4-hour timeframe is starting to show strong bullish momentum. Could this be the beginning of a new uptrend?
A potential 5:1 risk-to-reward setup is forming:
Entry: 2,620
Stop Loss: 2,364
Target: 4,062
Support 2500 must hold!!!

Ethereum H4 | Falling toward a pullback supportEthereum (ETH/USD) is falling towards a pullback support and could potentially bounce off this level to climb higher.
Buy entry is at 2,519.65 which is a pullback support that aligns with the 23.6% Fibonacci retracement.
Stop loss is at 2,360.00 which is a level that lies underneath a multi-swing-low support and the 50% Fibonacci retracement.
Take profit is at 2,731.45 which is a pullback resistance.
High Risk Investment Warning
Trading Forex/CFDs on margin carries a high level of risk and may not be suitable for all investors. Leverage can work against you.
Stratos Markets Limited (tradu.com ):
CFDs are complex instruments and come with a high risk of losing money rapidly due to leverage. 63% of retail investor accounts lose money when trading CFDs with this provider. You should consider whether you understand how CFDs work and whether you can afford to take the high risk of losing your money.
Stratos Europe Ltd (tradu.com ):
CFDs are complex instruments and come with a high risk of losing money rapidly due to leverage. 63% of retail investor accounts lose money when trading CFDs with this provider. You should consider whether you understand how CFDs work and whether you can afford to take the high risk of losing your money.
Stratos Global LLC (tradu.com ):
Losses can exceed deposits.
Please be advised that the information presented on TradingView is provided to Tradu (‘Company’, ‘we’) by a third-party provider (‘TFA Global Pte Ltd’). Please be reminded that you are solely responsible for the trading decisions on your account. There is a very high degree of risk involved in trading. Any information and/or content is intended entirely for research, educational and informational purposes only and does not constitute investment or consultation advice or investment strategy. The information is not tailored to the investment needs of any specific person and therefore does not involve a consideration of any of the investment objectives, financial situation or needs of any viewer that may receive it. Kindly also note that past performance is not a reliable indicator of future results. Actual results may differ materially from those anticipated in forward-looking or past performance statements. We assume no liability as to the accuracy or completeness of any of the information and/or content provided herein and the Company cannot be held responsible for any omission, mistake nor for any loss or damage including without limitation to any loss of profit which may arise from reliance on any information supplied by TFA Global Pte Ltd.
The speaker(s) is neither an employee, agent nor representative of Tradu and is therefore acting independently. The opinions given are their own, constitute general market commentary, and do not constitute the opinion or advice of Tradu or any form of personal or investment advice. Tradu neither endorses nor guarantees offerings of third-party speakers, nor is Tradu responsible for the content, veracity or opinions of third-party speakers, presenters or participants.

Ethereum in JULYEthereum should close above $3000 by the end of July to stay in the bull run, Monthly candle is so important now.

BTC - Will the Bearish Channel continue?Market Context
After a strong impulsive rally earlier in the year, BTC has been trading within a descending channel on the daily timeframe. This corrective structure suggests a period of consolidation and redistribution, as price oscillates between the channel's boundaries. The repeated rejection from the upper trendline and the inability to break through key highs reinforce the bearish bias in this structure.
Buy Side Liquidity Sweep Potential
Price is currently positioned just beneath a relatively clean swing high, sitting above the mid-range of the channel. This high represents a clear area of Buy Side Liquidity—stop losses from short positions and pending breakout orders from longs are likely clustered there. An engineered sweep of this high would serve as a strategic move for larger participants to collect liquidity before driving price lower.
Fair Value Gap as a Pivot Point
Beneath current price lies a Fair Value Gap—a visible inefficiency formed during a fast upward move earlier in the structure. This Gap remains unfilled and offers a compelling target for price once the Buy Side Liquidity Sweep occurs. It represents a logical zone for price to rebalance before deciding on continuation or reversal. Should price break below the Gap cleanly, it would confirm the bearish intent and potentially accelerate toward the lower bounds of the channel.
Channel Continuation Structure
The overall geometry of the channel remains intact, and the price respecting both upper and lower boundaries strengthens the likelihood of a continuation toward the downside. If the Buy Side Liquidity Sweep and subsequent rejection occur, the market could be poised for another leg lower—possibly seeking the next structural support closer to 90,000 or even toward the lower extremities of the channel around 80,000–82,000.
Final Thoughts
This chart reflects classic price delivery behavior: corrective structure, engineered liquidity sweeps, and the magnetic pull of inefficiencies like Fair Value Gaps. Whether you’re actively trading or simply observing, this is a clean, educational setup to learn from.
If this breakdown helped you see the market a bit clearer, I’d really appreciate a like. And feel free to share your thoughts or counterviews in the comments—your insights make the analysis even more valuable.

Ethereum: Eyeing New Highs?Ethereum has surged recently and continues rising in turquoise wave B. The next target is a break above the June high, with potential upside to resistance at $4,107. A direct breakout above this level (27% probability) would suggest green wave alt. ended in April. However, our main scenario expects a reversal below $4,107, with turquoise wave C likely dragging ETH into the Long Target Zone between $935.82 and $494.15 to complete wave .
📈 Over 190 precise analyses, clear entry points, and defined Target Zones - that's what we do.

Bearish reversal off major resistance?The Ethereum (ETH/USD) is rising towards the pivot which acts as a pullback resistance and could reverse to the 1st support which is a pullback support.
Pivot: 2,655.32
1st Support: 2,506.53
1st Resistance: 2,820.60
Risk Warning:
Trading Forex and CFDs carries a high level of risk to your capital and you should only trade with money you can afford to lose. Trading Forex and CFDs may not be suitable for all investors, so please ensure that you fully understand the risks involved and seek independent advice if necessary.
Disclaimer:
The above opinions given constitute general market commentary, and do not constitute the opinion or advice of IC Markets or any form of personal or investment advice.
Any opinions, news, research, analyses, prices, other information, or links to third-party sites contained on this website are provided on an "as-is" basis, are intended only to be informative, is not an advice nor a recommendation, nor research, or a record of our trading prices, or an offer of, or solicitation for a transaction in any financial instrument and thus should not be treated as such. The information provided does not involve any specific investment objectives, financial situation and needs of any specific person who may receive it. Please be aware, that past performance is not a reliable indicator of future performance and/or results. Past Performance or Forward-looking scenarios based upon the reasonable beliefs of the third-party provider are not a guarantee of future performance. Actual results may differ materially from those anticipated in forward-looking or past performance statements. IC Markets makes no representation or warranty and assumes no liability as to the accuracy or completeness of the information provided, nor any loss arising from any investment based on a recommendation, forecast or any information supplied by any third-party.

WOW $4 to $74 Big 1,655% in just 2 daysGet ready for new power runners to emerge from this AMEX:BMNR move

HolderStat┆ETHUSD seeks to the $2750 levelBINANCE:ETHUSDT is holding above 2,350 and breaking out of consolidation within an expanding wedge. With structure pointing to bullish continuation, a move toward 2,800 is likely if this support level continues to hold.

Crypto Tide Rising: Will TOTAL Market Cap surf past $5T?In November 2024 the crypto ocean was calm, hovering near $2.25T . Then, in a short time, fresh capital poured in, daily volume spiked, and the tide lifted us to $3.65T by mid-December .
Two bullish buoys popped up:
▶️ The daily down-trend snapped on Nov 4th, triggering a 51 % climb;
▶️ The 50-day MA (orange) crossed above the 200-day MA (white) on Nov 7th, after a 64 % rally.
Fast-forward to June 4th 2025 . Another Golden Cross has just flashed, and price is again nudging that descending trend-line. If History rhymes: the line breaks and momentum matches 2024’s move, the TOTAL MC could vault toward $5T .
Keeping today’s dominance ratios, that target implies roughly $162 k BTC and $3.8 k ETH . Add rising Global M2 and stablecoin liquidity, a supportive macro backdrop, and we may be staring at the next great crypto swell.
Will the market catch this wave or will macro headwinds keep the tide in check?
Not financial advice. DYOR, Arrr!

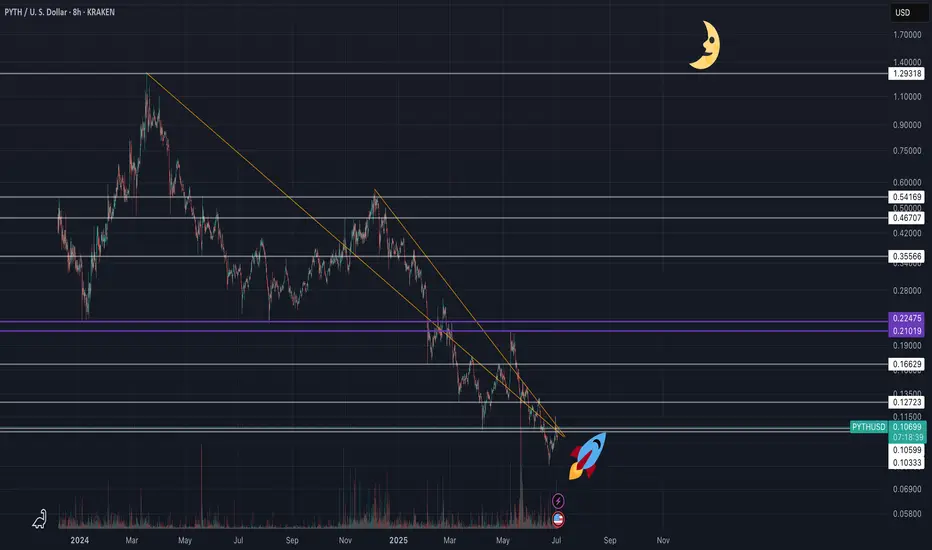
PYTH NETWORK (PYTHUSD) - (10X - 50X Potential)Pyth Network is an oracle protocol originally built for Solana, optimized for ultra-low latency and first-party data directly from exchanges and market makers. Unlike Chainlink’s node-aggregator model, Pyth enables real-time price feeds (as fast as 400ms) sourced directly from over 100 institutional providers, including Binance and Cboe.
🧩 Why Pyth?
DeFi apps need fast, accurate pricing to avoid exploits and ensure fair trading. Pyth delivers high-frequency, high-integrity data, especially valuable for derivatives, perpetuals, and high-speed DeFi protocols.
🌐 Massive Expansion
What started on Solana now powers 100+ blockchains, including Ethereum L2s, Cosmos, Sui, Aptos, TON, and more. As of 2025, over 420 protocols integrate Pyth, with over $48B+ monthly trading volume secured. It has become the #2 oracle in DeFi by usage, dominating ecosystems like Solana, Sui, and Injective.
📊 Tokenomics & Unlocks
Max supply: 10B PYTH
Circulating: ~5.75B (mid-2025)
Next major unlock: May 2026 (~2.1B tokens)
Utility: Governance, staking, publisher rewards, and oracle integrity
Pyth’s decentralized governance is growing, with a DAO now guiding key protocol parameters. It’s also expanding beyond price feeds, launching products like randomness (Entropy) and MEV mitigation tools (Express Relay).
Disclaimer: This is not financial advice. Always do your own research before making investment decisions.