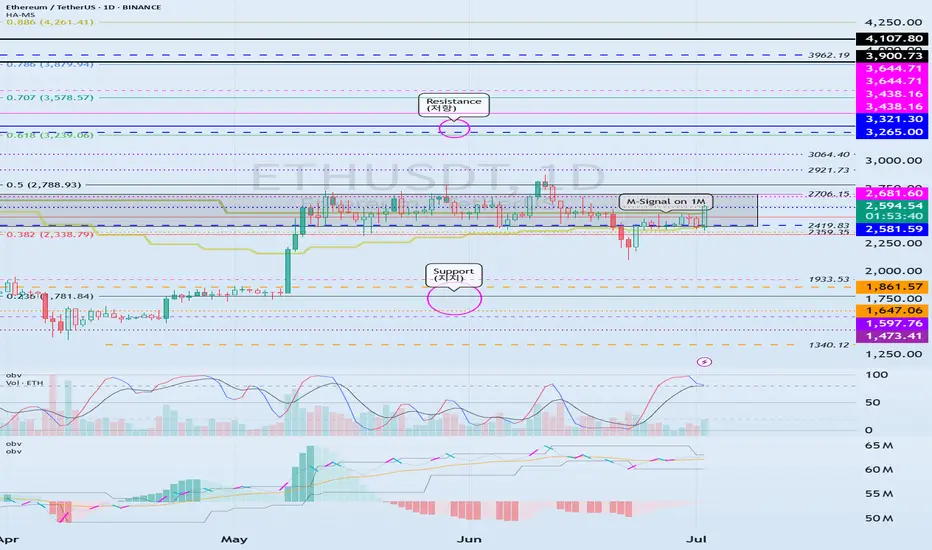
Important Support and Resistance Areas: 2419.83-2706.15
Hello, traders.
Please "Follow" to get the latest information quickly.
Have a nice day today.
-------------------------------------
(ETHUSDT 1D chart)
The key is whether ETH can find support in the 2419.83-2706.15 area and rise.
This is because this section is the section that needs to be supported in order for a full-fledged uptrend to begin.
Therefore, if you are trading ETH, you can proceed with a purchase when support is confirmed in the 2419.83-2706.15 section.
-
Thank you for reading to the end.
I hope you have a successful transaction.
--------------------------------------------------
- Here is an explanation of the big picture.
(3-year bull market, 1-year bear market pattern)
I will explain the details again when the bear market starts.
------------------------------------------------------
Ethereum (Cryptocurrency)
ETH 50MA Reclaims 0.5 FibInteresting take on ETH daily using just the 50MA and Fib levels.
Notice how the 50MA has interacted with the Fib levels since June 2021.
In May 2025, the 50MA crossed below the 0.618 Fib level, marking the bottom of the December 2024 drop.
The 0.5 Fib acted as support in October 2024 during the double top formation at the 0.236 Fib.
Now, the 50MA has crossed back above the 0.5 Fib.
As long as price holds above this 0.5 Fib level, the odds of further upside remain stronger.
Always take profits and manage risk.
Interaction is welcome.

ETHBTCTick tock
This is the most unlooked at chart in crypto because there is nothing bullish about it but eths fundamentals are insanely bullish
I'm a huge eth bull and hate looking at this chart
It will run it back at some point but its clearly not in a rush and lesser understood on the institutional finance side of the market.

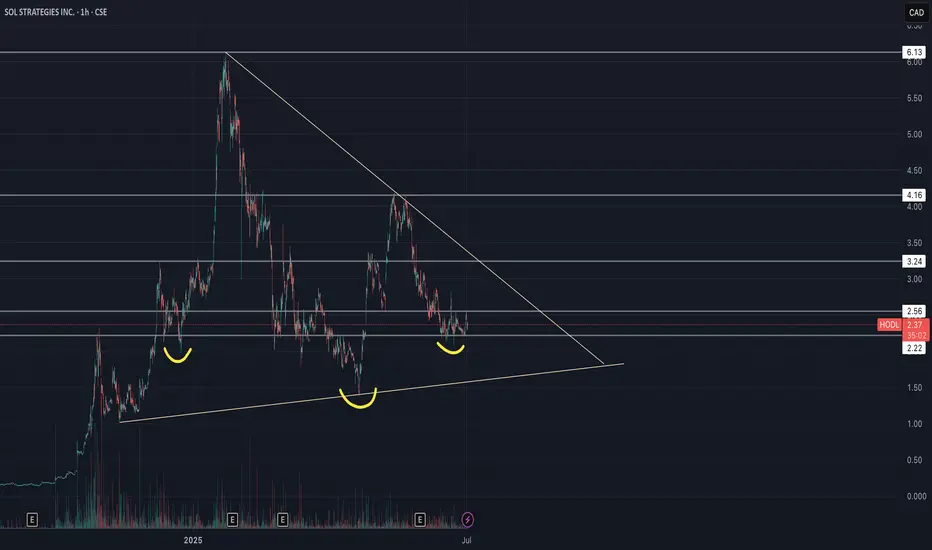
Sol Strategies Inc (HODL) - Inverse H&S🚀 SOL Strategies (HODL) – Public Market Gateway to Solana Yield
SOL Strategies (CSE: HODL) is a publicly traded company laser-focused on the Solana ecosystem. With nearly 395,000 SOL held (most of it staked) and over 3.7 million SOL delegated to their validators, they generate consistent income through staking rewards and validator commissions.
Their business model is simple:
📌 Accumulate SOL → Stake it → Run institutional-grade validators → Earn yield
📌 Expand through partnerships (3iQ, Neptune, BitGo, Pudgy Penguins)
📌 Hold strategic Solana ecosystem tokens like JTO and jitoSOL
📌 Operate with SOC 2-certified infrastructure and pursue a Nasdaq listing
SOL Strategies is not just holding crypto – they are building core infrastructure for Solana, giving equity investors direct exposure to staking economics in one of the fastest-growing blockchain networks.
📊 For traders: HODL stock offers a pure-play vehicle for Solana exposure, with an income-generating twist.
⚠️ Always do your own investment research and make your own decisions before investing.
Ethereum - ETH - Heading towards the CME Gap - 3200 Target+ After a significant crash, Ethereum has shown a strong recovery.
+ A large CME gap exists between $2,880 and $3,270.
+ Historically, 90% of CME gaps tend to get filled sooner or later.
+ Current price action suggests Ethereum is heading directly toward this gap.
+ High probability that the CME gap will be filled during this move.
+ Next target for ETH: $3,200.
Stay tuned for more updates.
Cheers,
GreenCrypto

TON/USDT : Are you Bullish or Bearish? Let's Talk!By analyzing the #Toncoin chart on the 3-day timeframe, we observe that the price is still within the demand zone between $2.40 and $3.00.
If the price manages to break above the $3.10 level and hold within the next 7 days, we can expect further growth from this cryptocurrency.
The expected returns are approximately 20% in the short term, 40% to 55% in the mid-term, and up to 110% in the long term.
Please support me with your likes and comments to motivate me to share more analysis with you and share your opinion about the possible trend of this chart with me !
Best Regards , Arman Shaban

ETH/USDT : Gearing Up for a Major Breakout? (READ)By analyzing the Ethereum chart on the weekly timeframe, we can see that the price has started rising just as expected and is now approaching the first target. For now, ETH faces major resistance in the $2,600–$2,900 zone.
If price breaks above this key area, I expect a strong bullish move from Ethereum!
Based on the main analysis, the short-term targets are $2,700 and $2,890, while the mid-term targets are $3,100 and $4,100.
Please support me with your likes and comments to motivate me to share more analysis with you and share your opinion about the possible trend of this chart with me !
Best Regards , Arman Shaban

BTC Weekly Analysis : Rise or Fall ? Let's SeeBy analyzing the #Bitcoin chart on the weekly timeframe, we can see that last week’s candle closed at $108,350, and BTC is currently trading around $107,500. If the price manages to hold above $105,700, we could expect further upside momentum. The next potential bullish targets are $111,700, $124,000, and $131,800.
So far, this analysis has yielded over 9% return, and we’ll be sharing more updates soon from lower timeframes!
🎥 If you enjoyed this video analysis and found it helpful, please show your support with a LIKE and COMMENT below!
These video-style breakdowns take time and effort, and I’ll only continue them with your support 🙌
Your engagement is my biggest motivation to keep going 💛
Thanks for being part of the journey!

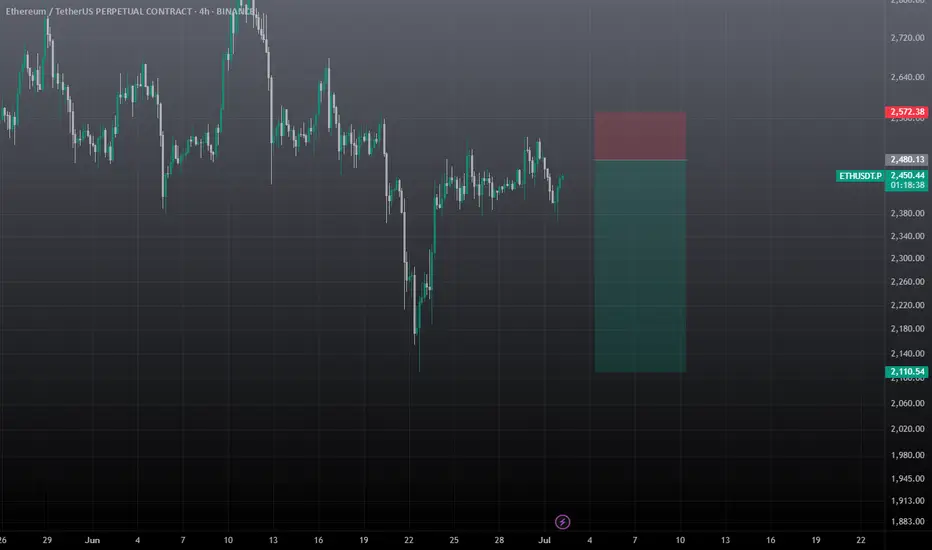
ETHUSDT SWING TRADE SetupWait for the entry and must use sl, if sl hits then wait for candle closure, candle managed to close above the SL, still there is lot of supply zone for eth till 2.7k, So fakeout also possible. I will comment the update, SO closely follow me.
ETH 30min: Bearish Triangle Forming After RSI Divergencehelo guys
Ethereum is currently trading within a clear range, and recently formed a bearish triangle pattern near the top of the consolidation. A visible RSI divergence confirmed the loss of bullish momentum as price made a higher high, but RSI printed a lower high — a common sign of exhaustion.
Now, ETH is moving downward within the triangle, and pressure is building near the lower edge of the range. If the pattern breaks down as expected, the next likely move is a drop toward the support zone around $2,370–2,380, which marks the bottom of the range.
This setup shows a typical structure:
Divergence → Triangle → Breakdown toward range low
Unless price reclaims the triangle top quickly, bears have the upper hand in the short term.

SharpLink Gaming Inc (SBET) - Falling Wedge & Inverse H&S🚀 SharpLink Gaming ( NASDAQ:SBET ) – Ethereum, Joe Lubin & a Bullish Setup
SharpLink Gaming has undergone a bold transformation: the company is now the largest public holder of Ethereum (ETH), with ~198,000 ETH acquired since June 2025. Over 95% of it is staked, already earning 200+ ETH in rewards – turning ETH into a yield-bearing treasury asset.
Driving this shift is Joe Lubin, co-founder of Ethereum and CEO of ConsenSys, who recently became Chairman of SharpLink. Under his leadership, SBET is betting big on Ethereum as “digital capital”, aiming to merge iGaming and Web3.
📊 Technical Setup:
SBET is forming a falling wedge and an inverse head and shoulders – both classic bullish reversal patterns. After a post-announcement retracement, the chart suggests growing potential for a breakout as fundamentals strengthen.
🧠 My thesis: This is MicroStrategy playbook 2.0 – but with ETH instead of BTC. SharpLink gives equity exposure to Ethereum + staking yield + visionary leadership.
🔔 Worth watching closely.
⚠️ Always do your own investment research and make your own decisions before investing.

ETH/USDT ETH/SDT 1W The market has priced in most scenarios. At this point, the chart tells the story — and it’s playing out as expected

Ethereum - This structure decides everything!Ethereum - CRYPTO:ETHUSD - trades at a key structure:
(click chart above to see the in depth analysis👆🏻)
After Ethereum retested the previous all time high in the end of 2024, we saw quite a harsh move lower. This move was followed by an expected recovery, however Ethereum is still trading below a key structure. Either move is still possible and will shape the future of Ethereum.
Levels to watch: $2.500, $4.000
Keep your long term vision!
Philip (BasicTrading)

ETH needs support now. ETH is holding up by a thread. There are signs of weakness in the market, and if the Ethereum price breaks below support, it is likely we will see follow-through.
Full TA: Link in the BIO
ETHEREUM Perhaps the easiest long out there.Ethereum (ETHUSD) is consolidating just above the Buy Zone of the Mayer Multiple Bands (MMBs) where it rebounded on its April bottom.
Throughout its historic price action, every time it hit this Zone and rebounded, it reached at least the bottom of its Mean MM zone (red Zone).
As a result, $4000 towards the end of the year may be the easiest Target in the market right now.
-------------------------------------------------------------------------------
** Please LIKE 👍, FOLLOW ✅, SHARE 🙌 and COMMENT ✍ if you enjoy this idea! Also share your ideas and charts in the comments section below! This is best way to keep it relevant, support us, keep the content here free and allow the idea to reach as many people as possible. **
-------------------------------------------------------------------------------
💸💸💸💸💸💸
👇 👇 👇 👇 👇 👇

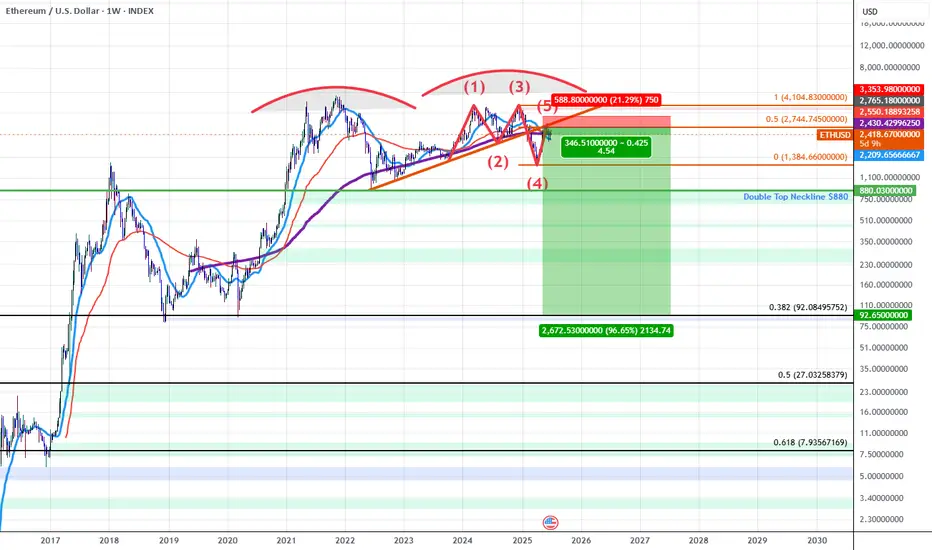
ETHUSD: Double Top into A Bearish 5-0 BreakdownETH for the last 5 years has been developing a Double Topping pattern which has put in a series of lower highs during the most recent 2nd run up. As we've confirmed these lower highs we've broken down below trendline and found resistance at the trendline which happens to have confluence with the PCZ of a Bearish 5-0 wave formation.
As we begin to find weakness and Bearish price action begins I suspect price will make it's way towards the neckline of the double top aligning with the $880 price level if ETH breaks below that level there will be no significant support until it reaches the all-time 0.382 retrace down at around $92.10.
In short it seems ETH is in the early stages of a macro breakdown which could result in value declines greater than 80%.
ETHUSD coiling pattern breakout support at 2170.Trend Overview:
ETHUSD remains in a bullish trend, characterised by higher highs and higher lows. The recent intraday price action is forming a continuation consolidation pattern, suggesting a potential pause before a renewed move higher.
Key Technical Levels:
Support: 2,170 (primary pivot), followed by 2,080 and 1,980
Resistance: 2,610 (initial), then 2,800 and 2.920
Technical Outlook:
A pullback to the 2,170 level, which aligns with the previous consolidation zone, could act as a platform for renewed buying interest. A confirmed bounce from this support may trigger a continuation toward the next resistance levels at 2,610, 2,800, and ultimately 2,920.
Conversely, a daily close below 2,170 would suggest weakening bullish momentum. This scenario would shift the bias to bearish in the short term, potentially targeting 2.080 and 1,980 as downside levels.
Conclusion:
ETHUSD maintains a bullish structure while trading above the 2,170 support. A bounce from this level would validate the consolidation as a continuation pattern, with upside potential toward the 2,610 area. A breakdown below 2,170, however, would invalidate this view and suggest deeper corrective risk.
This communication is for informational purposes only and should not be viewed as any form of recommendation as to a particular course of action or as investment advice. It is not intended as an offer or solicitation for the purchase or sale of any financial instrument or as an official confirmation of any transaction. Opinions, estimates and assumptions expressed herein are made as of the date of this communication and are subject to change without notice. This communication has been prepared based upon information, including market prices, data and other information, believed to be reliable; however, Trade Nation does not warrant its completeness or accuracy. All market prices and market data contained in or attached to this communication are indicative and subject to change without notice.

HolderStat┆ETHUSD fixed above the supportBINANCE:ETHUSDT broke out from a triangle and is holding above the 2,447 zone. The current ascending structure targets 2,700 in the near term. Reclaiming short-term resistances confirms a bullish reversal from recent lows, similar to past triangle breakouts.

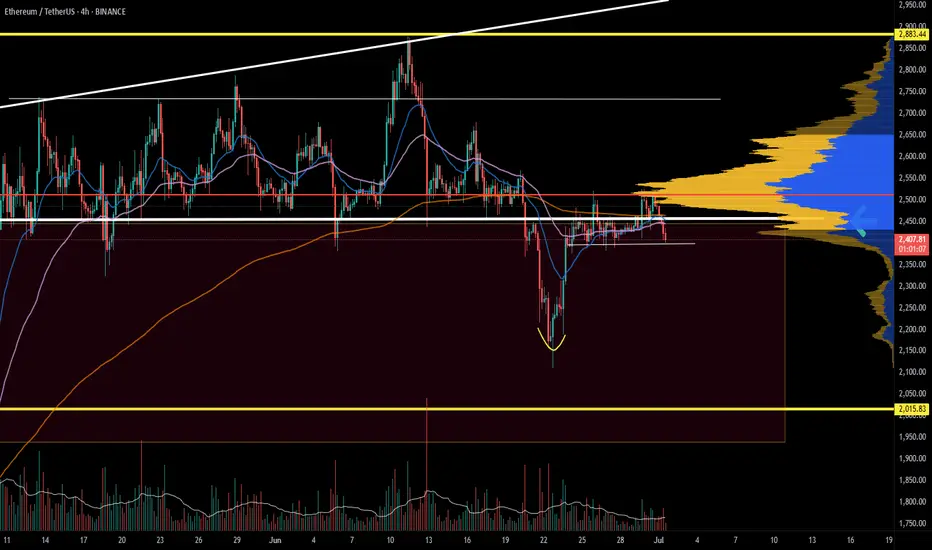
ETH Pushed Back, Support in Sight
ETH on the 4H just closed below the last daily close and the 0.5 Fib again, after getting pushed back from the 4H 200MA and daily 200MA resistance zone.
The next key supports are the weekly 200MA and the local support zone.
Also worth noting: Trump and Musk are stirring things up again. The last time this dynamic appeared, it triggered a selloff a few weeks ago, even before the conflict began.
Always take profits and manage risk.
Interaction is welcome.

BTC - Consolidation, Manipulation & DistributionMarket Context
The current price action unfolds within the broader structure of a bullish leg that began after a sharp reversal near 97,000. This impulsive rally created a clear Fair Value Gap on the 4-hour chart—left behind as price surged upward with minimal resistance. Following this move, the market entered a consolidation phase, forming a range that has now broken to the upside. This kind of breakout often attracts breakout traders, but in this case, the context signals something more calculated.
Buy Side Liquidity Sweep Following Consolidation
The breakout above the consolidation range led directly into a Buy Side Liquidity Sweep, as price ran the highs just above the marked range. These highs acted as a magnet for liquidity—stop losses from short sellers and buy stops from breakout traders were likely pooled in that area. The quick rejection following this sweep suggests the move was not backed by genuine demand, but rather served the purpose of liquidity collection by larger players.
Manipulation and Distribution
This is a textbook example of manipulation into liquidity. Price was engineered to move upward into a zone of interest, taking out the Buy Side Liquidity before sharply reversing. The strong rejection signals distribution—institutions likely offloaded positions into the influx of late buyers. This kind of pattern often precedes a larger markdown, particularly when followed by lower timeframe bearish structure breaks.
Unfilled Fair Value Gap as a Draw
Beneath the price lies an unfilled Fair Value Gap, a zone of imbalance left behind by the earlier impulsive move. These areas often act as magnets for price, especially once liquidity objectives to the upside have been completed. Now that the sweep has occurred and distribution is underway, there is a strong probability that price will begin to seek rebalancing within this Gap. The area between 104,000 and 103,500 stands out as a high-probability target for the next leg down.
Execution Insight
If you're looking to enter short, it may be wise to wait for confirmation on a lower timeframe—such as a bearish break of structure or an internal Gap forming during the retracement. A 5-minute timeframe can often give early signs of rejection or supply stepping in. Being patient and allowing the market to reveal intent is crucial, especially after liquidity-driven moves like this.
Final Thoughts
Price doesn’t move randomly—it seeks liquidity and fills inefficiencies. This chart beautifully illustrates that logic, from engineered consolidation to a manipulative sweep, and now potentially toward rebalancing.
If you found this breakdown helpful, I’d really appreciate a like—it helps support the work and keeps this kind of content going. Let me know in the comments what you think, or if you’re seeing it differently. I'm always up for a good discussion.

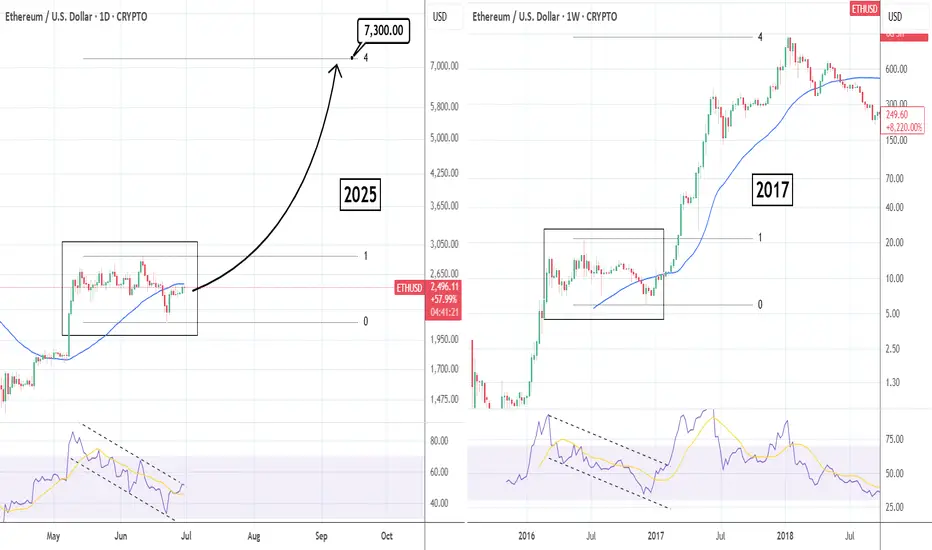
ETHUSD: Parabolic rally similar to 2017 targets $7,300Ethereum is neutral on its 1D technical outlook (RSI = 50.960, MACD = -24.810, ADX = 18.527), attempting to break over the 1D MA50, while still being inside a 6 week consolidation. This is no different than the 2016 consolidation on the 1W chart, that turned out to be just an accumulation pattern before a massive 2017 bullish breakout to the 4.0 Fibonacci extension. Time to go heavily long on ETH with TP = 7,300.
## If you like our free content follow our profile to get more daily ideas. ##
## Comments and likes are greatly appreciated. ##
Navigating the ETH Volume Wall as Capital Rotates to High-Beta
In the intricate and often volatile theater of the cryptocurrency markets, Ethereum (ETH) currently finds itself in a moment of profound tension. As the undisputed king of smart contracts and the foundational layer for decentralized finance (DeFi), its price action sends ripples across the entire digital asset ecosystem. The current outlook presents a fascinating dichotomy: on one hand, Ethereum is staring down a formidable "volume wall," a dense zone of historical trading activity that acts as a powerful barrier to upward momentum. On the other hand, the tantalizing prospect of a decisive breakout above the key $2,900 level beckons, promising a new leg up for the bull market.
This standoff has created a fertile ground for a classic market phenomenon: capital rotation. As Ethereum grinds sideways, battling for every percentage point against heavy resistance, impatient capital is beginning to flow into more nimble, higher-risk assets within its orbit. Traders and investors are increasingly eyeing "cheap crypto"—smaller, more volatile altcoins built on or related to the Ethereum network. These "ETH beta" plays are rallying in anticipation of an eventual Ethereum breakout, offering the potential for outsized returns.
This comprehensive analysis will dissect the complex dynamics shaping Ethereum's current price outlook. We will explore the nature of the heavy volume wall that is capping its ascent and the strategic implications of the resulting price range. We will then delve into the mechanics of capital rotation, examining why traders are turning to lower-cap altcoins as a proxy for Ethereum's future success. Finally, we will weigh the bullish and bearish cases, charting the potential path to a $2,900 breakout while acknowledging the significant risks that could invalidate the optimistic thesis. For investors and market observers, understanding this intricate dance between consolidation, rotation, and breakout potential is paramount to navigating the next chapter in Ethereum's journey.
Part 1: The Great Wall of Ethereum - Deconstructing the Heavy Volume Range
To understand Ethereum's current struggle, one must first grasp the concept of a "volume wall." This is not a literal barrier, but a powerful technical and psychological construct visible on a price chart. It represents a price range where an unusually high volume of tokens has changed hands in the past. This area of high trading concentration becomes a major point of contention for future price movements, acting as a powerful magnet for both support and, in this case, resistance.
What is a Volume Wall and Why Does It Form?
A volume wall is best visualized using an indicator like the Volume Profile Visible Range (VPVR). Unlike traditional volume bars at the bottom of a chart that show volume per unit of time, the VPVR displays it horizontally, showing volume per price level. A large, protruding bar on the VPVR signifies a "High-Volume Node" (HVN), which is the technical term for a volume wall.
These walls form for several key psychological reasons:
1. Breakeven Sellers ("Bagholders"): A significant number of market participants may have bought ETH within this price range during a previous rally. When the price fell, they were left holding at a loss. Now, as the price returns to their entry point, their primary emotion is relief. Their goal is not to make a profit, but simply to exit their position at breakeven. This creates a steady stream of sell orders as the price enters the high-volume zone.
2. Strategic Profit-Takers: Investors who bought Ethereum at much lower prices see this high-volume area as a logical and predictable place to take profits. They recognize it as a zone of contention and potential reversal, making it an opportune moment to sell a portion of their holdings and de-risk.
3. Opportunistic Short-Sellers: Traders who are bearish on Ethereum view the volume wall as a high-probability area for the price to be rejected. They will strategically place short-sell orders within this range, adding to the selling pressure and betting on a move back down.
When these three forces converge, they create a formidable supply zone that can absorb a tremendous amount of buying pressure. For Ethereum to break through, it requires a catalyst strong enough to overwhelm this confluence of sellers.
Identifying Ethereum's Current Range
For the purpose of this analysis, let's assume this heavy volume wall for Ethereum is situated roughly between $2,750 and $2,850. This range becomes a battleground. When the price enters this zone, it often loses momentum and begins to move sideways in a "chop," characterized by volatile price swings without a clear direction.
The implications of being trapped below such a wall are significant. The market enters a state of consolidation or ranging. This means that for the time being, the explosive, directional trend is on pause. Bulls and bears are locked in a battle for control, and until one side emerges victorious, the price will likely remain contained. This period of consolidation, while frustrating for trend-followers, is a critical phase where the market digests previous gains, flushes out weak hands, and builds energy for its next major move. The key question for every trader is which direction that move will be.
Part 2: The Rotation Game - Chasing Beta in a Sideways Market
When a market leader like Ethereum enters a prolonged consolidation phase, a fascinating secondary effect begins to take hold: capital rotation. Traders and investors, particularly those with shorter time horizons, grow impatient with the lack of volatility in the primary asset. Their capital seeks higher returns and more immediate action, leading them to rotate out of the ranging asset and into more speculative plays. In the context of the crypto market, this often means moving into "high-beta" altcoins.
Understanding "ETH Beta"
In traditional finance, "beta" measures an asset's volatility in relation to a benchmark, like the S&P 500. An asset with a beta of 1.5 is expected to move 1.5% for every 1% move in the benchmark. In cryptocurrency, Ethereum itself often acts as a benchmark for the broader altcoin market.
"ETH beta" refers to altcoins that are highly correlated with Ethereum's price but exhibit much higher volatility. These are typically smaller, newer, or more speculative projects within Ethereum's ecosystem. The logic behind the "ETH beta play" is straightforward:
• If you believe Ethereum will eventually break through its resistance wall and rally, you can simply buy and hold ETH.
• However, if you want to maximize potential returns, you can instead buy a high-beta altcoin. The thesis is that when ETH finally moves up 10%, this smaller altcoin might surge 30%, 50%, or even more.
This strategy is essentially a leveraged bet on Ethereum's success, but without using financial leverage like futures or options. The leverage comes from the inherent volatility of the smaller asset.
The Allure of "Cheap Crypto"
The rotation often targets what is colloquially known as "cheap crypto." This term doesn't necessarily mean the project is undervalued, but rather that its token has a low unit price (e.g., under $1 or even fractions of a cent). This has a powerful psychological appeal:
• Accessibility: It feels more accessible to buy 1,000,000 tokens of a memecoin for $1,000 than to buy a fraction of one ETH.
• Perceived Upside: The low unit price creates the perception of explosive growth potential. It's psychologically easier to imagine a token going from $0.01 to $0.10 (a 10x return) than it is to imagine ETH going from $2,800 to $28,000.
During Ethereum's consolidation, we would likely see this rotation manifest in several key sectors of its ecosystem:
• Layer 2 Solutions: Projects like Arbitrum (ARB), Optimism (OP), and Polygon (MATIC) are prime candidates. They are fundamentally linked to Ethereum's scalability and success, making them a direct beta play. As traders anticipate an ETH breakout, they will front-run the move by accumulating these L2 tokens.
• DeFi Blue Chips and Dapps: Protocols for lending, borrowing, and trading, such as Uniswap (UNI), Aave (AAVE), or Lido (LDO), also fall into this category. Their usage and value are directly tied to the health of the Ethereum network.
• Memecoins and Newer Narratives: This is the highest-risk, highest-reward end of the spectrum. Memecoins built on Ethereum (like PEPE or SHIB) or on its Layer 2s can experience parabolic rallies based on pure speculation and social media hype, driven by the narrative that a rising ETH tide will lift all boats.
This rotation is a double-edged sword. While it signals underlying bullish conviction in the Ethereum ecosystem, it also diverts buying pressure away from ETH itself, potentially prolonging the consolidation phase. However, it is a clear sign that the market is positioning for an eventual breakout.
Part 3: The Bull Case - Charting a Path to the $2.9K Breakout
Despite the formidable resistance, a powerful bull case for Ethereum is building, suggesting that a breakout above the $2,900 level is not a matter of if, but when. This optimism is rooted in a combination of bullish technical patterns, strengthening on-chain fundamentals, and a powerful external narrative.
The Technical Setup for a Breakout
While the price may be moving sideways, a closer look at the chart often reveals underlying strength building beneath the surface. Several technical patterns and indicators could signal an impending breakout:
• Ascending Triangle Formation: A classic bullish pattern. This would be characterized by the price making a series of higher lows while being capped by the horizontal resistance of the volume wall (around $2,850-$2,900). The higher lows indicate that buyers are becoming more aggressive on each dip, squeezing the price upwards against the resistance. A breakout from the top of this triangle would be a powerful technical signal.
• Bullish Engulfing or Hammer Candlesticks: The appearance of strong bullish candlestick patterns at key support levels below the range would indicate that buyers are stepping in with force, absorbing selling pressure and defending the uptrend.
• Resetting Momentum Oscillators: During a consolidation phase, indicators like the Relative Strength Index (RSI) will cool off from "overbought" levels. If the RSI can reset back to neutral territory (around 50) while the price remains stable, it suggests the market is building up energy for another push higher without being overextended. A "hidden bullish divergence," where the price makes a higher low while the RSI makes a lower low, would be an even stronger signal of trend continuation.
• Support from Key Moving Averages: For the bull case to remain intact, Ethereum's price must hold above critical long-term moving averages, such as the 50-day and 200-day Simple Moving Averages (SMAs). These levels often act as dynamic support, and successful bounces from them reinforce the underlying bullish trend.
Fundamental and On-Chain Catalysts
Beyond the charts, Ethereum's fundamental health provides a strong tailwind for a potential rally:
• The Spot Ether ETF Narrative: The single most powerful potential catalyst on the horizon is the approval of a spot Ether ETF in the United States. Following the monumental success of the Bitcoin ETFs, the market anticipates that an Ether ETF would unlock a similar torrent of institutional capital. This narrative alone is enough to encourage accumulation, as investors look to position themselves ahead of a potential approval. Any positive news or regulatory progress on this front could provide the immense buying pressure needed to shatter the volume wall.
• Deflationary Supply Dynamics (The Burn): Thanks to the EIP-1559 upgrade, a portion of every transaction fee on Ethereum is "burned," or permanently removed from circulation. During periods of high network activity, this can make ETH a deflationary asset, meaning more coins are being destroyed than created. This programmatic scarcity is a powerful long-term value driver that makes holding ETH more attractive.
• The Growth of the Layer 2 Ecosystem: The success of Layer 2 solutions like Arbitrum and Optimism is not a threat to Ethereum but a testament to its success. These networks bundle transactions and settle them on the Ethereum mainnet, increasing its overall throughput and utility. A thriving L2 ecosystem drives demand for ETH as the ultimate settlement and data availability layer, strengthening its fundamental value proposition.
• Staking and Supply Sinks: A significant and growing portion of ETH's total supply is locked up in staking contracts to secure the network. This staked ETH is effectively removed from the liquid, circulating supply available for sale on exchanges. This continuous supply reduction creates a "supply shock" dynamic, where even a moderate increase in demand can have an outsized impact on the price.
When these technical and fundamental forces align, they create a powerful case that the consolidation phase is a temporary pause before the next major uptrend. A decisive break and close above $2,900 would liquidate short positions, trigger FOMO (Fear Of Missing Out) buying, and likely signal the start of a rapid move towards the next major psychological and technical target, potentially $3,500 or higher.
Part 4: The Bear Case and Prevailing Risks
A balanced analysis requires acknowledging the significant risks that could invalidate the bullish thesis. The volume wall is formidable for a reason, and a failure to break through could lead to a sharp reversal. Several factors could contribute to a bearish outcome for Ethereum.
Rejection at the Wall
The most immediate risk is a decisive rejection from the volume wall. If buying pressure wanes and sellers take firm control within the $2,750-$2,850 range, it could signal a local top. This would likely be confirmed by a break below the recent series of higher lows and key moving averages. Such a rejection could trigger a cascade of stop-loss orders from long positions, accelerating a move downwards to retest lower support levels, potentially in the $2,400-$2,500 range.
Macroeconomic Headwinds
As a major global asset, Ethereum is not immune to the broader macroeconomic environment. A "risk-off" sentiment sweeping through traditional markets would almost certainly impact crypto. Factors that could trigger this include:
• Hawkish Central Bank Policy: Unexpectedly high inflation data could force central banks like the Federal Reserve to maintain high interest rates for longer, or even signal further hikes. This "tight liquidity" environment is generally negative for risk assets like cryptocurrencies.
• Geopolitical Instability: An escalation of global conflicts can cause investors to flee to perceived safe havens like the US dollar or gold, pulling capital away from more speculative markets.
• Recessionary Fears: Signs of a weakening global economy could dampen investor appetite for risk, leading to broad-based selling across asset classes.
Regulatory Uncertainty
Regulatory risk remains a persistent cloud over the entire crypto industry, and Ethereum is at the center of a key debate. The U.S. Securities and Exchange Commission (SEC) has not definitively clarified whether it views ETH as a commodity (like Bitcoin) or a security. A negative ruling, or even prolonged legal battles suggesting it will be classified as a security, could have a chilling effect on the market. It would create significant compliance hurdles for exchanges and could derail the spot Ether ETF narrative entirely. Any negative headline on this front could be the catalyst that turns the volume wall from a temporary obstacle into an impenetrable ceiling.
Competitive Pressures
While Ethereum remains the dominant smart contract platform, it faces ever-growing competition from other Layer 1 blockchains (often dubbed "ETH Killers") like Solana, Avalanche, and others. These platforms boast high transaction speeds and low fees and are constantly vying for market share in the DeFi and NFT spaces. While a multi-chain future is the most likely outcome, a significant migration of developers and users away from Ethereum to a competitor could erode its network effect and negatively impact its long-term valuation.
Conclusion: A Pivotal Moment of Decision
Ethereum stands at a critical juncture, a crossroads where powerful bullish and bearish forces are locked in a tense equilibrium. The price is pinned against a heavy volume wall, a technical barrier representing the collective memory of the market. This has forced the asset into a period of consolidation, a sideways grind that is testing the patience of even the most steadfast bulls.
This very consolidation is fueling a secondary narrative of capital rotation, where traders, anticipating an eventual breakout, are channeling funds into higher-volatility "ETH beta" plays. The rallies in Layer 2 tokens and other ecosystem projects are a vote of confidence in Ethereum's future, a sign that the market is positioning for upside. The fundamental picture, bolstered by the potential of a spot ETF, deflationary supply mechanics, and a thriving ecosystem, provides a strong foundation for the bull case. The path to a $2,900 breakout seems not only possible but plausible.
However, the risks are undeniable. A failure to breach the wall could lead to a sharp correction, exacerbated by potential macroeconomic headwinds or negative regulatory surprises. The outcome of this battle will be pivotal. A successful breakout would reaffirm Ethereum's market leadership and likely kickstart a new wave of adoption and price appreciation across the entire altcoin space. A rejection would signal a deeper correction and a longer period of uncertainty. For now, the market holds its breath, watching the wall, waiting for the rotation to culminate, and anticipating the decisive move that will set the tone for the months to come.

ethusdt no trade zoneETH is stuck in a range, wait for the sweep of range high, then closing below the range high and take the short, target weekly low. 2nd scenario is wait for to take out the weekly low and any daily candle closing failed to close below this level take the long entry and target the range high. Otherwise expecting this week choppy mean sideways. no major move. Will update if found any good trade.
