Ethereum (Cryptocurrency)

Pullback resistance ahead?The Ethereum (ETH/USD) is rising towards the pivot which has been identified as a pullback resistance that lines up with the 50% Fibonacci retracement and could drop to the 1st support.
Pivot: 2,483.49
1st Support: 2,289.88
1st Resistance: 2,655.92
Risk Warning:
Trading Forex and CFDs carries a high level of risk to your capital and you should only trade with money you can afford to lose. Trading Forex and CFDs may not be suitable for all investors, so please ensure that you fully understand the risks involved and seek independent advice if necessary.
Disclaimer:
The above opinions given constitute general market commentary, and do not constitute the opinion or advice of IC Markets or any form of personal or investment advice.
Any opinions, news, research, analyses, prices, other information, or links to third-party sites contained on this website are provided on an "as-is" basis, are intended only to be informative, is not an advice nor a recommendation, nor research, or a record of our trading prices, or an offer of, or solicitation for a transaction in any financial instrument and thus should not be treated as such. The information provided does not involve any specific investment objectives, financial situation and needs of any specific person who may receive it. Please be aware, that past performance is not a reliable indicator of future performance and/or results. Past Performance or Forward-looking scenarios based upon the reasonable beliefs of the third-party provider are not a guarantee of future performance. Actual results may differ materially from those anticipated in forward-looking or past performance statements. IC Markets makes no representation or warranty and assumes no liability as to the accuracy or completeness of the information provided, nor any loss arising from any investment based on a recommendation, forecast or any information supplied by any third-party.

ETH - ORDER BOOK - BIG LEVELS Ethereum Order Book Analysis | Key ETH Levels Revealed (Real-Time Liquidity Zones)
In this video, we dive into the Ethereum (ETHUSD) order book to uncover major liquidity levels that could influence price action in the short and medium term. By analyzing real-time data, we identify where whales and institutions are placing large orders, which often act as strong support and resistance zones.
What You’ll Learn:
• How to spot large buy/sell walls on the ETH order book
• Why these levels matter for short-term traders
• Real-time reactions to major liquidity zones
• Potential long/short trade setups around key areas
This is essential viewing if you’re trading ETH intraday or swing, and want to anticipate where the next major move may come from.
⸻
Tools Used:
• ETHUSD price chart
• Real-time order book data
• Volume heatmaps
• Liquidity zone mapping
• Sentiment Tool
⸻
Stay ahead of the crowd by understanding how the market reacts to big players’ order placements. Don’t forget to leave a comment with your ETH target, and follow for more pro-level crypto analysis.
⸻
#Ethereum #ETHUSD #ETHAnalysis #CryptoTrading #OrderBook #ETHOrderFlow #LiquidityLevels #CryptoTA #PriceAction #WhaleWatching

ETH - When $3,000??The one who frontrun ETH at the bottom are the real boss, looks good from 2460 for longs, and slit for buys at the range if something outlasts

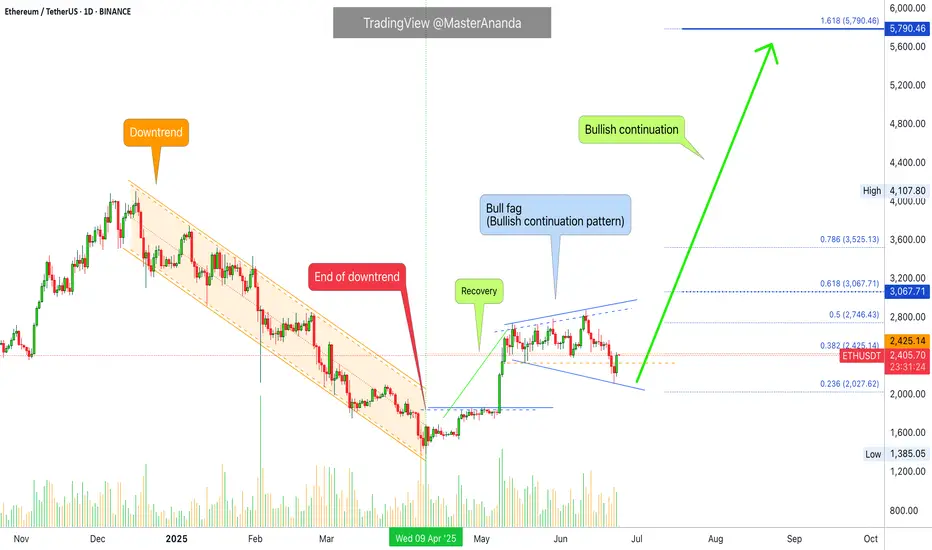
Ethereum vs Small Cap. & The 2025-26 Cryptocurrency Bull MarketThe last three days ended up being a very nice flush, a strong one but the action quickly recovered above the 18-May low.
Ethereum was trading above $2,300 since mid-May and always stayed above this level. It broke suddenly below, out of nowhere, but the action is bullish again. We can say that this was a stop-loss hunt event, a bear-trap and nothing more or else we would see a continuation of the bearish action rather than a strong inverse reaction, a bullish jump.
It is not only Ethereum of course that is experiencing this type of bullish action, some altcoins are going nuts. Really crazy right now producing so much momentum that people are still wondering if the market is going down... Or is it going up?
It is obviously up, just look at the 7-April low.
Ethereum hit a low of $1,385 on 7-April. The higher low yesterday ended at $2,111.
You see what I mean?
The market is ultra-bullish because the last low is so far away. It is impossible that it will be tested even less possible for it to break. Ok, so a market shakeout we agree but now that the shakeout is complete what is supposed to happen next?
Watch the smaller altcoins.
Thank you for reading.
Namaste.
Ethereum/US Dollar 4-Hour Chart (BINANCE)4-hour price movement of Ethereum (ETH) against the US Dollar (USD) on the BINANCE exchange. The current price is $2,211.36, reflecting a decrease of $85.21 (-3.71%). The chart highlights a recent downward trend with a potential support zone between approximately $2,100 and $2,200, followed by a possible upward movement as indicated by the shaded area. The data is captured as of June 23, 2025.

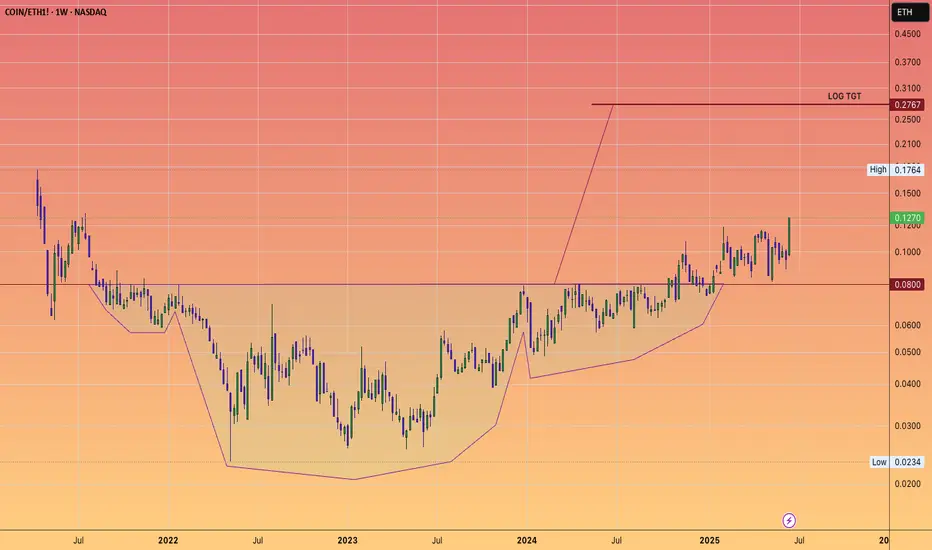
$ETHBTC failed multiyear breakout. To understand the investor positioning in the Crypto markets we must understand the CRYPTOCAP:BTC values of the Altcoins. In terms of USD the valuations might go up but if we look at the pair trade of the Altcoins relative to CRYPTOCAP:BTC we can relay understand the flow among the various Cryptocurrencies.
Let’s understand the relationship between CRYPTOCAP:BTC and CRYPTOCAP:ETH , the second largest Crypto and the largest one in the CRYPTOCAP:TOTAL2 index. Below we have plotted a multiple year BINANCE:ETHBTC chart for reference. IN the previous cycle the BINANCE:ETHBTC char bottomed @ 0.02 and then BINANCE:ETHBTC had a bull run where the chart topped out on 0.09. This was during the rush of Crypto Punks and the likes which were traded using $ETH. At the same time the RSI of BINANCE:ETHBTC also peaked at 90. Since then, it has been bleeding slowly.
The BINANCE:ETHBTC has suffered a series of lower lows and lower highs forming a bearish pattern. The RSI also never regained in strength and has also been forming lower highs and lower lows. This April the BINANCE:ETHBTC touched the last cycle low of 0.02. Since then, it has tried a bounce back but failed again at 0.025. My prediction is that the BINANCE:ETHBTC will struggle to break out of the 0.236 Fib retracement levels plotted on the previous cycles Highs to the Lows.
Verdict : BINANCE:ETHBTC looks bearish on medium to long term. Short term bounce back possible to 0.0375.

Watching for a Double Signal on ETH ETH 4H – Watching for Dual Signal Confirmation
ETH is now trading above the BB center, with both the MLR and SMA also above.
PSAR hasn’t flipped yet, but if upside continues, we could see a bullish flip soon.
If PSAR flips while price holds above range low, that’s a potential dual signal (trend + structure).
Still, this is speculative—price could easily reject here and head lower.
Reminder: ETH remains under the 200MA on both the 4H and daily timeframes.
However, it’s currently holding the 5D 200MA. Idea on that coming soon.
Always take profits and manage risk.
Interaction is welcome.

ETHEREUM $1800 IMMINENT – Accumulation nearing completionTraders,
Ethereum is currently forming a textbook example of multi-timeframe accumulation. We’re observing two overlapping accumulation ranges — one on the macro and one on the intraday structure.
In both cases, price has formed two significant lows. A third sweep toward the $1800 zone would complete the pattern and align with the principle of engineered liquidity traps before expansion.
This $1800 level isn't random — it’s where:
- Prior stop runs occurred
- Buyer interest is likely to step in again
- The lower boundary of the range aligns with previous demand
If this level holds, the next logical target sits at $2258, where external liquidity rests above recent highs. The path of least resistance is up once that low is set.
This setup offers high R/R for positional longs, especially if confirmed with absorption or bullish delta response at the $1800 level.
Don’t rush in — but be prepared.
The reaction around $1800 will tell the story.

Bitcoin at Risk: Will Geopolitical Tensions Push BTC Below $90K?By analyzing the #Bitcoin chart on the weekly timeframe, we can see that the price continued its correction amid rising tensions and conflict between Iran and Israel, dropping to as low as $98,000. Currently, Bitcoin is trading around $101,000, and if these tensions escalate further — especially if Iran decides to close the Strait of Hormuz — it could significantly impact global markets, and Bitcoin would not be an exception.
If BTC fails to hold above $100,000 by the end of the week, a continuation of the drop toward $90,000 is possible.
Please support me with your likes and comments to motivate me to share more analysis with you and share your opinion about the possible trend of this chart with me !
Best Regards , Arman Shaban

USDT.D LONG - MID TERM PLANUSDT.D is one of the best tools to understand what's happening in the crypto market.
It shows the dominance of USDT across the entire space — and has a strong inverse correlation with BTC and crypto assets.
Technicals:
USDT.D is approaching its long-term support trendline.
I expect a deviation below that line — possibly toward the 0.75 Fibonacci level — before a strong move up.
That move could last 1–3 months, which means more downside for alts during this time.
Plan:
Shorting altcoins — especially ETH-related tokens and memecoins.
Looking to buy back around early August.

Bullish bounce off 50% Fibonacci support?The Ethereum (ETH/USD) is reacting off the pivot which has been identified as an overlap support and could bounce to the 1st resistance.
Pivot: 2,089.45
1st Support: 1,669.20
1st Resistance: 2,687.43
Risk Warning:
Trading Forex and CFDs carries a high level of risk to your capital and you should only trade with money you can afford to lose. Trading Forex and CFDs may not be suitable for all investors, so please ensure that you fully understand the risks involved and seek independent advice if necessary.
Disclaimer:
The above opinions given constitute general market commentary, and do not constitute the opinion or advice of IC Markets or any form of personal or investment advice.
Any opinions, news, research, analyses, prices, other information, or links to third-party sites contained on this website are provided on an "as-is" basis, are intended only to be informative, is not an advice nor a recommendation, nor research, or a record of our trading prices, or an offer of, or solicitation for a transaction in any financial instrument and thus should not be treated as such. The information provided does not involve any specific investment objectives, financial situation and needs of any specific person who may receive it. Please be aware, that past performance is not a reliable indicator of future performance and/or results. Past Performance or Forward-looking scenarios based upon the reasonable beliefs of the third-party provider are not a guarantee of future performance. Actual results may differ materially from those anticipated in forward-looking or past performance statements. IC Markets makes no representation or warranty and assumes no liability as to the accuracy or completeness of the information provided, nor any loss arising from any investment based on a recommendation, forecast or any information supplied by any third-party.

Ethereum Price Reversal ? $2100 Support & Altcoin Season OutlookAfter an extended period of consolidation, Ethereum (ETH) has finally retested the critical support level of $2,100, which aligns closely with the 0.5 Fibonacci retracement level of the bullish trend that began in April. This confluence of technical factors strengthens the validity of this level as a strong demand zone.
The price action suggests that ETH may be gearing up for a bullish reversal, as it respects both horizontal support and key Fibonacci structure. Historically, the 0.5–0.618 retracement zone acts as a high-probability reversal area in trending markets, particularly when accompanied by volume stabilization and long-tailed candles on the daily chart.
Trade Plan: Spot and Futures Positions
Given the current structure, this presents a favorable opportunity to accumulate ETH on spot for the anticipated altcoin season. In addition, leveraged long positions in futures can be considered with clearly defined risk parameters.
Entry Zone: Around \$2,100
Stop Loss: \$2,000 (below key support)
Target Levels:
Primary Target: $2,500 (previous resistance / psychological level)
Secondary Target: $2,600 (major structure high)
The risk-to-reward ratio remains attractive, particularly if the broader crypto market continues its uptrend and Bitcoin maintains stability.
Market Context
Broader macro sentiment and the dominance cycle suggest capital rotation into altcoins could be near. With Ethereum leading major Layer 1s, a recovery from this level could catalyze a wider altcoin rally**, making this an important zone to watch for both intraday traders and swing investors.
⚠️ Note: Due to ongoing geopolitical tensions between Israel, Iran, and the United States, global financial markets—including crypto—may experience heightened volatility. Traders are advised to manage risk carefully and avoid overleveraging during uncertain macro conditions.

ETH Weekly – Eyes on $1900When panic creeps in, zoom out.
ETH on the weekly has lost both the 200MA and the 0.5 Fib.
In my opinion, if the BB center doesn’t hold here, price could retest the 0.618 Fib level a zone it tends to flirt with often.
The $1900 area might become a solid buy zone.
Always take profits and manage risk.
Interaction is welcome.

Anti-bart in July for ETHWherever it bottoms, this is THE dip to buy. Analogue forecasting with fractals similar to the ones I make for Bitcoin. Let's try this.

ETH / USDC Pool StakeSharp sell-off following the U.S. strike on Iran—ETH whale has entered. Set your liquidity pool range wide to capture a potential rebound. If the price continues to drop, no problem—full ETH position is anchored at the bottom of the range. Avoid swapping ETH to realize losses. Hold your original ETH and continue adjusting the range downward if needed. Your only real costs are minting and gas fees, so operate on a low-cost network like Arbitrum or Base to keep expenses minimal.

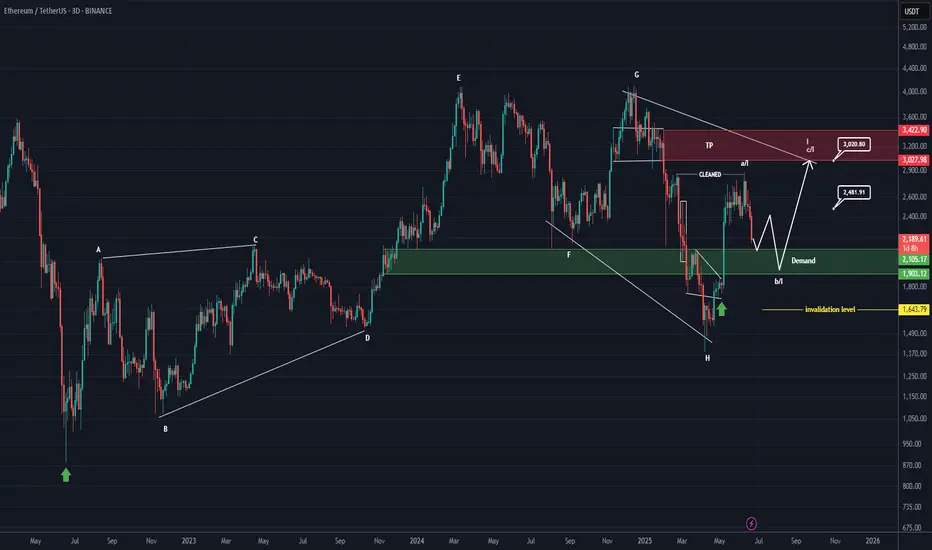
ETHEREUM Analysis (3D)First of all, pay close attention to the timeframe | it's a higher timeframe.
From the point where we placed the green arrow on the chart, Ethereum appears to have entered a bullish phase | specifically, a symmetrical pattern.
It currently seems to be in wave I of this symmetrical structure, which is the final wave. Wave I itself appears to be composed of three parts (ABC). At the moment, Ethereum seems to be in wave b of wave I.
We expect wave b of I to complete within the green zone, after which the price would move into wave c of I.
The price seems inclined to complete wave b of I near the bottom of the green zone.
Targets are marked on the chart.
In the green zone, it’s no longer reasonable to look for Sell/Short positions, especially when the price is approaching the bottom of the green area.
A weekly candle close below the green zone would invalidate this analysis.
For risk management, please don't forget stop loss and capital management
When we reach the first target, save some profit and then change the stop to entry
Comment if you have any questions
Thank You
ETH NEW UPDATE (8H)This analysis is an update of the analysis you see in the "Related publications" section
After the pump and hitting the red zone, it got rejected.
It's better not to open a short position on Ethereum, as its dominance appears bullish | which means it might be resilient against a potential drop.
The closing of a daily candle above the invalidation level will invalidate this analysis.
For risk management, please don't forget stop loss and capital management
Comment if you have any questions
Thank You

ETHUSD: Will Go Up! Long!
My dear friends,
Today we will analyse ETHUSD together☺️
The price is near a wide key level
and the pair is approaching a significant decision level of 2,270.9 Therefore, a strong bullish reaction here could determine the next move up.We will watch for a confirmation candle, and then target the next key level of 2,290.8.Recommend Stop-loss is beyond the current level.
❤️Sending you lots of Love and Hugs❤️


ETHUSD Break- Test- GO!!! Nothing Changed!I have to repost this bc TV only gives me limited updates before it forces "target reached." Here is my previous post.
Nothing has changed. Just as I expected. If anything, it looks even more bearish now. As always, wait for the hook!
Click Boost, and follow Let's get top 5,000!

The Chart you don't want to see: Coinbase Vampire attacked ETHBrian Armstrong is a significant influencer in both Silicon Valley and now Washington, D.C., where he is instrumental in shaping legislation and attracting investments that benefit Coinbase and its shareholders.
Vitalik writes blogs and appoints EF directors who appear to have ambiguous gender identities and are quite out there on the spectrum.
Jesse Pollak is yet another astute player who has leveraged ETH's technology to transform BASE into a powerhouse integrating neatly into Coinbase platform for payments and now DEX trading within app.
ETH will thrive.
However, as we've observed, Joe Lubin's return as a public figure to advocate for and steer the future of Ethereum has never been more crucial.
But will it be sufficient to compete with Brian and Jesse? They seem to be operating on a significantly higher plane.
ETH 4H – Testing Support, Rejected by Weekly 200MAOn the 4H, ETH is closing below the weekly 200MA but is trying to hold the last daily close as support—similar to what it did on June 5 at 20:00.
The difference: back then, the 4H 200MA acted as support; now it’s been clearly rejected and price sits well below it.
With the weekly close approaching, if ETH stays under the weekly 200MA, there's a strong chance it revisits the range low support.
However, if it manages to reclaim the 200MA before the close, a move toward the last two weekly closes may still be on the table.
Always take profits and manage risk.
Interaction is welcome.
