ETHUSD - Stretched price. Pullback to CL likelyPrice tagged the U-MLH, the stretch level.
Think of it like the 2nd STDV.
Now think Mean Reversion.
With such a stretch, price has a high chance to revert to the mean - down to the Centerline (CL).
What is this information good for?
a) take profit (...or 50% partial)
b) short on intrady signs
But if it is open and close above the U-MLH, then there's a good chance that price is advancing to the Warning Line, the extension of the Center to U-MLH.
Let's observe what happens.
Ethereum (Cryptocurrency)

Ethereum reached to our target
Ethereum reached to $3400 that we talked about since weeks ago, but now the daily RSI is at overbought area and we might see a correction.

ETHUSDT BUY / Long SetupThis 4hrs candle closes above the mentioned level, then took long from 50% fib level of the fvg, and put sl below the recent swing low, I will update the trade whether it's active or not? tp towards 3.3-3.4k , while btc.d getting recked so becareful shorting any altcoin.

The Loudmouth Pattern: It Yells, We Trade!
On the 30-minute chart, ETH is forming a classic Broadening Formation – or as some traders like to call it, “The Big Mouth Pattern” 😄. It’s noisy, unpredictable at first glance, but when it speaks, you’d better listen.
Right now, price is moving through the bullish leg of this setup, and if momentum holds, we’re eyeing the $4,000 psychological level, followed by the $4,120 – $4,170 supply zone.
🔹 Bullish Scenario (our expected outlook):
🎯 Target 1: $4,000
🟩 Main Resistance: $4,120 – $4,170
❌ Invalidation: Confirmed close below $2,946
If price breaks and holds below that red support zone, this setup gets thrown out the window.
📊 Risk Management:
Scale in on pullbacks – if structure remains valid
No chasing without confirmation
Keep risk under 1% of total capital
📈 The market’s big mouth is open – and until it closes below $2,946, we’re listening for bullish signals. 🤑

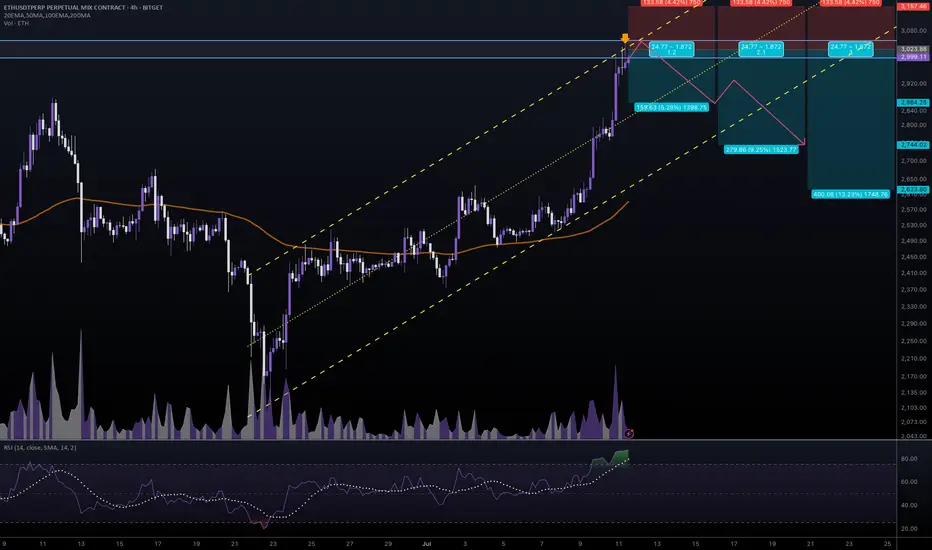
#ETHUSDT #4h (Bitget Futures) Ascending channel on resistanceEthereum printed a gravestone doji followed by a shooting star, RSI is overbought, local top seems in.
⚡️⚡️ #ETH/USDT ⚡️⚡️
Exchanges: Bitget Futures
Signal Type: Regular (Short)
Leverage: Isolated (9.0X)
Amount: 5.0%
Entry Zone:
2996.99 - 3050.49
Take-Profit Targets:
1) 2864.25
2) 2744.02
3) 2623.80
Stop Targets:
1) 3157.46
Published By: @Zblaba
CRYPTOCAP:ETH BITGET:ETHUSDT.P #4h #Ethereum #PoS ethereum.org
Risk/Reward= 1:1.2 | 1:2.1 | 1:3.0
Expected Profit= +47.5% | +83.3% | +119.0%
Possible Loss= -39.8%
Estimated Gaintime= 1-2 weeks
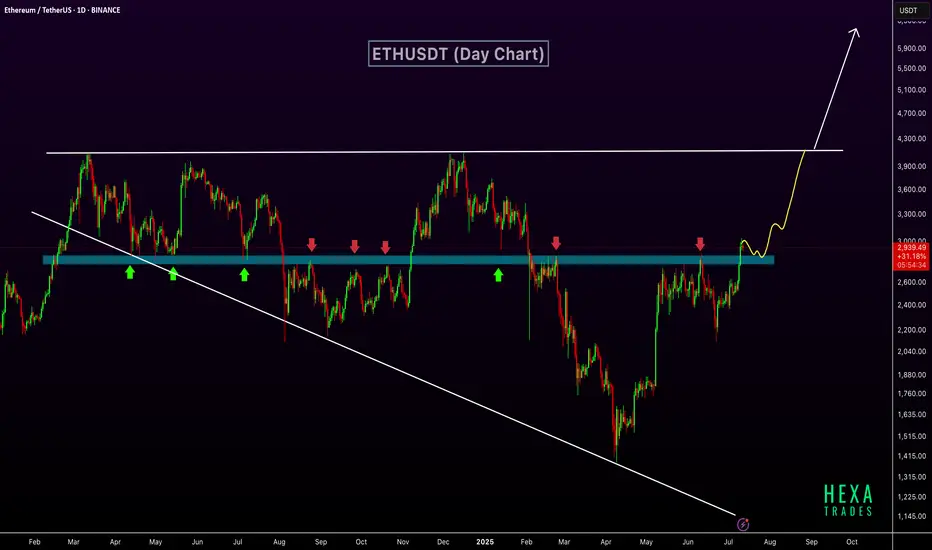
ETH Breaks Key Resistance – $6K Possible if Wedge BreaksETHUSDT has broken out above a key horizontal resistance zone that has historically acted as a strong support and resistance level. This zone, marked in blue, has seen multiple rejections and bounces over the past year, confirming its significance.
The recent breakout above this zone indicates a shift in market structure and suggests growing bullish momentum. The price action shows a clean move above resistance, with potential for a retest before continuing higher. The market is also forming a long-term broadening wedge pattern. The next target lies near the upper resistance of the wedge, around $4,000. If the price breaks above this broadening wedge, it could open the path toward the $6,000 level.
Regards
Hexa
DeGRAM | ETHUSD above the resistance area📊 Technical Analysis
● Price burst through the 12-week compression roof, converting the 2 990 supply into support and printing the strongest close since March.
● The pull-back just retested both the purple trend-fan and the 2 960 flip zone; the active rising channel and flag depth map the next magnet at 3 410.
💡 Fundamental Analysis
● SEC’s 12 Jul request for updated spot-ETH ETF S-1s hints at imminent approval, fuelling fresh inflows.
● Glassnode reports the largest daily net-staking deposit since April, reducing exchange float and adding bid pressure.
✨ Summary
Long 2 960-3 000; holding above 2 990 targets 3 110 → 3 410. Bias void on an H4 close below 2 860.
-------------------
Share your opinion in the comments and support the idea with like. Thanks for your support!

ETHUSD Is Going Up! Buy!
Please, check our technical outlook for ETHUSD.
Time Frame: 12h
Current Trend: Bullish
Sentiment: Oversold (based on 7-period RSI)
Forecast: Bullish
The market is approaching a key horizontal level 3,011.53.
Considering the today's price action, probabilities will be high to see a movement to 3,240.64.
P.S
The term oversold refers to a condition where an asset has traded lower in price and has the potential for a price bounce.
Overbought refers to market scenarios where the instrument is traded considerably higher than its fair value. Overvaluation is caused by market sentiments when there is positive news.
Disclosure: I am part of Trade Nation's Influencer program and receive a monthly fee for using their TradingView charts in my analysis.
Like and subscribe and comment my ideas if you enjoy them!

ETH/BTC TURBO LONGTurbomax gigaslam the fucking BUY button
Elliot Wave 12345
WITHIN 12345 MACRO WAVE
INCREDBILE RedCloud Break
INCREDIBLE GreenCloud Support
FIBS as level targets
DECEMBER 8-16TH WARNING ZONE VIA TIME
BUY BUY BUY BUY BUY BUY BUY

ETH/BTC Poised for a Breakout: A Technical and Fundamental ViewA confluence of technical signals on the weekly ETH/BTC chart, coupled with significant fundamental developments for both Ethereum and Bitcoin, suggests a potential upward move for the pairing in the coming weeks.
Technical Analysis (TA)
The weekly chart for ETH/BTC on Binance reveals a potential bottoming formation after a prolonged downtrend. The price has been consolidating in recent months, and the latest weekly candle shows a strong bullish engulfing pattern, indicating a possible shift in momentum.
Key levels to watch, as identified on the chart, are:
Immediate Resistance: 0.02546 BTC. A decisive close above this level on the weekly timeframe would be the first confirmation of a potential trend reversal.
Further Resistance: 0.02929 BTC and 0.03451 BTC. These represent subsequent hurdles for the bulls to overcome.
Take Profit Target: 0.038 BTC. This level is marked as the ultimate target for this potential upward move.
Timeframe: The analysis on the chart suggests a maximum timeframe of 5 weeks for this trade idea to play out.
Moving Averages: The price is currently trading below the MA Ribbon (SMA, 20, 50, 100, 200), which could act as dynamic resistance. A break above this ribbon would further strengthen the bullish case.
Fundamental Analysis (FA)
The current market environment in July 2025 provides several fundamental catalysts that could impact the ETH/BTC ratio.
For Ethereum (ETH):
Growing Institutional Interest: Ethereum ETFs have seen significant inflows, with over $890 million in July 2025 alone, driven by increasing confidence from institutional investors. Asset managers like BlackRock are accumulating substantial amounts of ETH, reducing the available supply on the market.
Network Upgrades: The upcoming "Pectra" upgrade, which includes Proto-Danksharding (EIP-4844), is anticipated in Q3 or early Q4 2025. This is expected to significantly reduce Layer-2 transaction costs and improve scalability, further enhancing the utility of the Ethereum network. The earlier Pectra upgrade in 2025 already introduced user-friendly features like smart accounts.
Ecosystem Growth: The Linea project, a prominent player in Ethereum's DeFi ecosystem, has a Token Generation Event (TGE) scheduled for July 2025, which is expected to drive market shifts. The overall DeFi ecosystem on Ethereum is showing signs of revitalization.
For Bitcoin (BTC):
Strong Institutional Demand: Similar to Ethereum, Bitcoin is experiencing a wave of institutional adoption, with significant inflows into spot Bitcoin ETFs. Public companies are now holding BTC in their treasuries, and major financial institutions view it as a strategic asset.
New All-Time Highs: Bitcoin has recently surged to new all-time highs, breaking key trendlines and signaling a new bullish era. This strong performance often has a spillover effect on the broader crypto market, including altcoins like Ethereum.
Favorable Macro Environment: Some analysts point to a looser monetary policy from global central banks and inflation concerns as factors boosting demand for hard assets like Bitcoin.
ETH vs. BTC Dynamics:
While Bitcoin's price has seen impressive gains, some analysts believe Ethereum has room to catch up. The ETH/BTC ratio is a key metric for gauging the relative strength of the two leading cryptocurrencies. An upward trend in the ETH/BTC chart, as suggested by the technical analysis, would indicate that Ethereum is outperforming Bitcoin. The performance of ETH relative to Bitcoin is often seen as a barometer for the broader altcoin market.
My point of view
The technical setup on the ETH/BTC weekly chart presents a compelling case for a potential bullish reversal in the short to medium term. This is supported by strong fundamental developments within the Ethereum ecosystem, including significant institutional inflows and major network upgrades. While Bitcoin's own bullish momentum is a factor to consider, the potential for Ethereum to outperform in the coming weeks, as indicated by the provided chart analysis, offers an interesting trading opportunity. Traders should closely monitor the identified resistance levels for confirmation of a breakout.

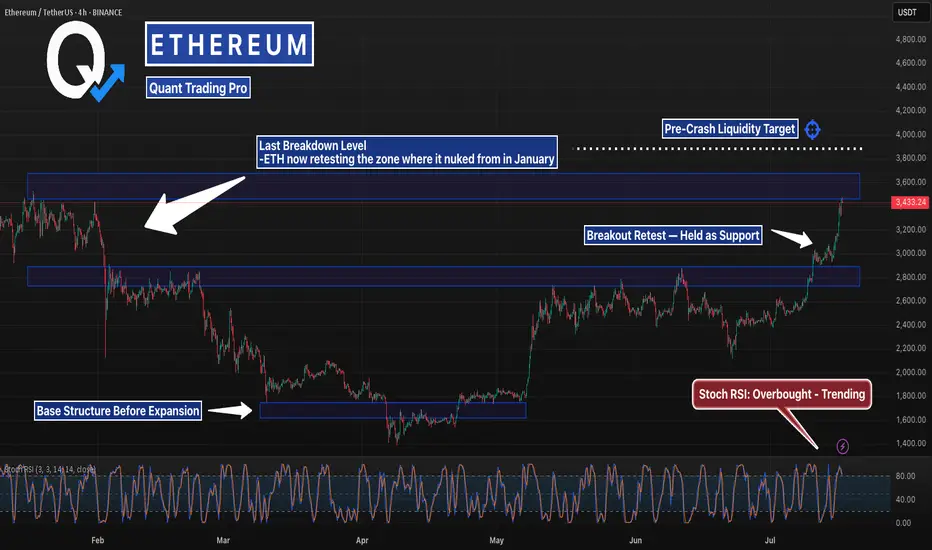
This Level Crashed ETH Last Time… It’s BackETH just blasted back into the same zone it collapsed from in January — but this time the structure underneath is stronger, tighter, and holding.
Stoch RSI is stretched, but bullish momentum remains intact. If it clears $3,870, lights out.
#Ethereum #ETHUSD #CryptoCharts #BreakoutLevels #ChartAnalysis #TradingView #QuantTradingPro #CryptoTraders #BacktestEverything
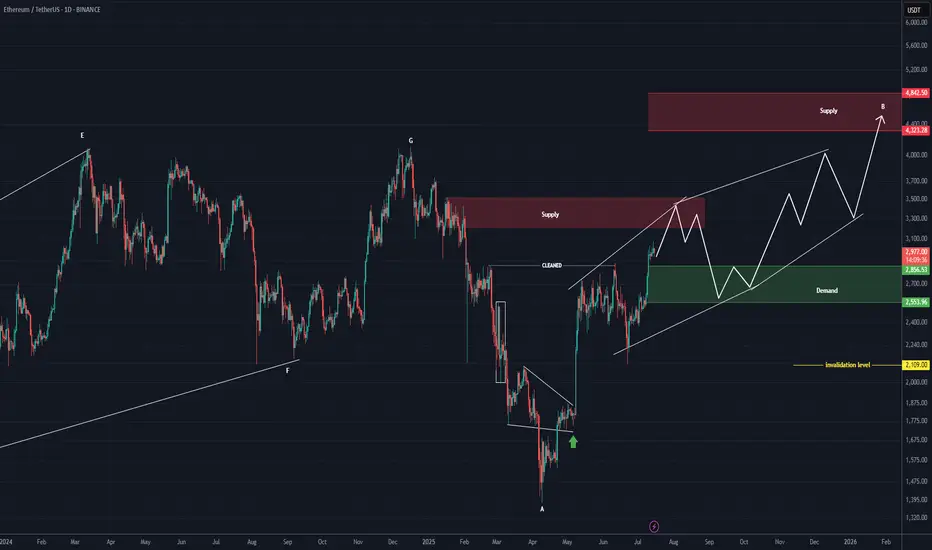
ETHEREUM Roara Map (1D)The previous phase of Ethereum appears to have been a completed diametric, and now it seems we are in a flat pattern.
It can be said that we are currently in wave B of the flat, which itself appears to be a diametric.
This diametric could even extend to the 4300–4800 range.
The green zone is the rebuy area.
A daily candle close below the invalidation level would invalidate this analysis.
For risk management, please don't forget stop loss and capital management
Comment if you have any questions
Thank You
ETHUSD – Possible Correction from Channel Resistance!Pair: ETH/USD
Timeframe: 4H
Structure: Ascending Channel
Indicators: RSI Overbought, Bearish Divergence Forming
Volume: Spike into resistance
📉 What’s happening?
Ethereum just tagged the top of its ascending channel, showing early signs of rejection. RSI is hovering near overbought, with weakening momentum on the last push.
⚠️ Caution Zone:
$3,425 acting as upper resistance
Price may retrace to midline or lower channel support ($3,250 → $3,050 range)
📌 Confirmation:
Look for:
A strong bearish candle or
RSI breaking below 60
Volume divergence
Bias: Short-term bearish correction, bullish structure intact as long as price holds the channel.

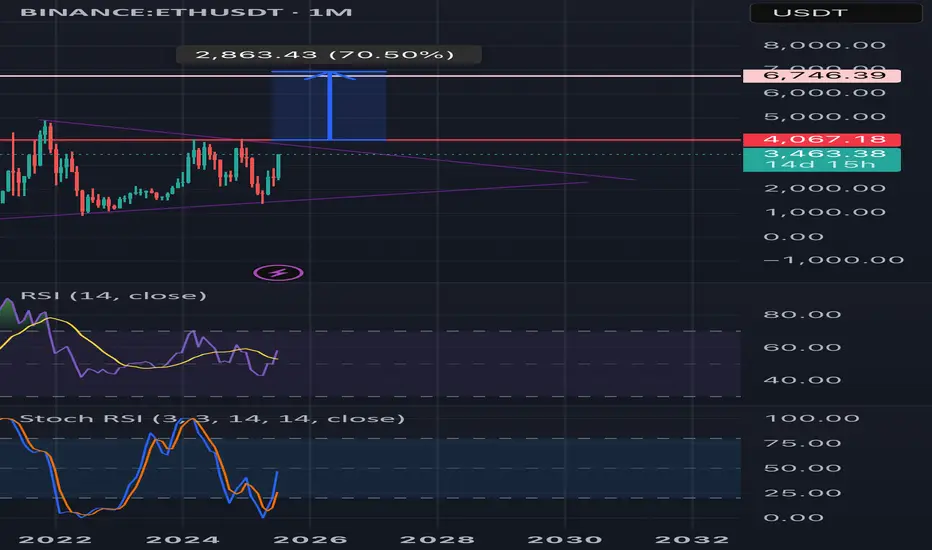
Upward breakout for ETH monthly?🟣 Ethereum Monthly Timeframe Analysis – Large Symmetrical Triangle
📌 Current Situation:
• On the monthly chart (1M), Ethereum (ETH) has formed a large symmetrical triangle pattern.
• This pattern typically signals a major price consolidation before a significant move.
• The descending resistance line connects the 2021 all-time high to recent lower highs.
• The ascending support line is drawn from the 2018 low through the 2022 bottom.
• Price is nearing the apex of the triangle, indicating a breakout is likely soon.
⸻
🔼 Bullish Scenario (Breakout to the Upside):
If ETH breaks above the triangle resistance and confirms the move:
✅ Signs of a Bullish Continuation:
• Strong breakout above the $4,000–$4,500 zone
• Increased volume confirming breakout
• Price holds above resistance-turned-support
🎯 Potential Price Targets by 2027 (based on triangle height & Fibonacci projections):
1. Target 1: $6,800 – $7,500
2. Target 2: $9,000 – $10,000
3. Long-term Target: $12,000 – $15,000 (if macro bull market continues)
⸻
🔽 Bearish Scenario (Fakeout or Breakdown):
If the breakout fails or price breaks down:
• ETH could revisit lower supports around $2,000 or even $1,400
• Bullish momentum delayed until another strong base forms
⸻
🔍 Conclusion:
• This triangle could mark the beginning of a major rally into 2027, especially if supported by fundamentals (e.g., ETF approval, DeFi growth).
• Wait for a confirmed breakout with volume and retest before entering a long-term position.
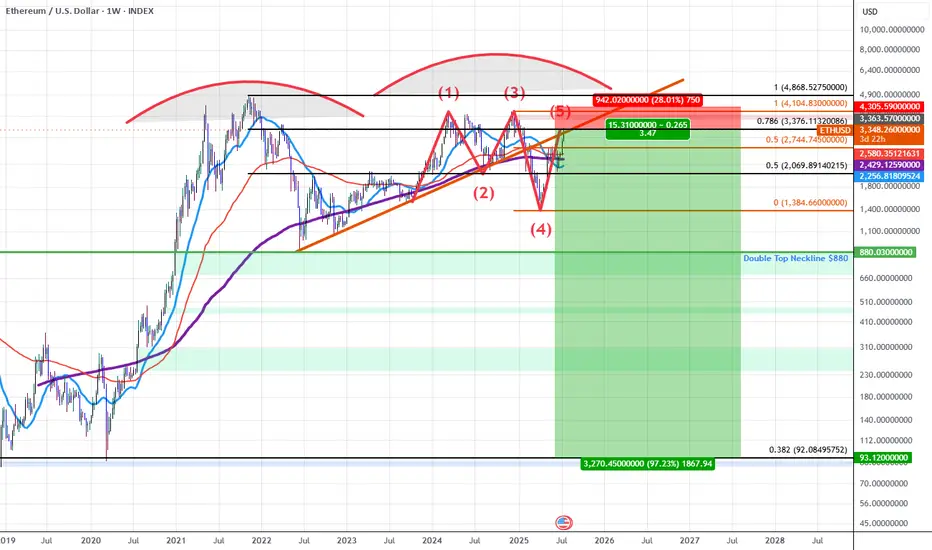
ETHUSD: Double Top into A Bearish 5-0 Breakdown (Extended)Updated Commentary: ETH has extended a bit further than projected as the Pattern Completed at the 0.618 but ETH gapped into the 0.786 instead. The gap up aligned with an upside gap fill on the CME futures as well as a gap fill on the grayscale ETH futures ETF $ETHE. The easier move from here to simply add to the ETH shorts and adjust the stop to be above the previous highs while sizing up at the 0.786 and playing off this gap higher as an anomaly. Beyond this, my view on ETH at the current 0.786 retrace remains the same as the original Idea posted as ETH rose into the initial 0.618 PCZ the details of which I will also include once again below as it still remains relevant.
ETH for the last 5 years has been developing a Double Topping pattern which has put in a series of lower highs during the most recent 2nd run up. As we've confirmed these lower highs we've broken down below trendline and are finding resistance at the trendline which happens to have confluence with the PCZ of a Bearish 5-0 wave formation near a 0.786 retrace.
As we begin to find weakness and Bearish price action begins I suspect price will make it's way towards the neckline of the double top aligning with the $880 price level if ETH breaks below that level there will be no significant support until it reaches the all-time 0.382 retrace down at around $92.10.
In short it seems ETH is in the early stages of a macro breakdown which could result in value declines greater than 80%.
I also suspect that we will see many of the assets that ran up significantly going into this week to sharply reverse those run-ups as this week comes to a close and the new week begins mainly due to the effects of OpEx, this includes: Bitcoin, MSTR, SOL, XLC, META, and BTBT. Long-dated Put accumulation on these assets at these levels is far easier to manage than naked short positions and that's how I will go about positioning here.
ETHUSDT minor trendsEthereum BINANCE:ETHUSDT is downtrend with lower highs from the bottom is nearly finished 📉 . For a stronger rise, it needs to stabilize above $2500 ⚡. Mid-term targets are $3300 (end of second leg) and $3700 (major resistance) 🎯. Key supports are $2500, $2070, $1800, and $1550, the base where the uptrend began 🛡️.
Supports & Resistances:
Supports: \$2500, \$2070, \$1800, \$1550
Resistances: \$2500 (critical level), \$3300, \$3700

ETHEREUM WILL KEEP GROWING|LONG|
✅ETHEREUM is trading in a
Strong uptrend and the coin
Broke the important horizontal level
Of 3000$ which is now a support
And we are very bullish biased
And we think that ETH will
Reach at least the previous ATH
Of just short of 5000$ but the
First target is to reach and break
A resistance level of 4100$
LONG🚀
✅Like and subscribe to never miss a new idea!✅
Disclosure: I am part of Trade Nation's Influencer program and receive a monthly fee for using their TradingView charts in my analysis.

ETH — Trade Closed! Massive Profit SecuredI’m officially closing my Ethereum position — this trade is now a success story!
I posted right here that ETH was a buy at $2400, then doubled down at $1800. I even echoed the call on Reddit for good measure.
Today, I’m liquidating the entire position with a huge gain. No regrets, just clean execution. 🧠💸
To all the mad lads still holding — good luck and may your conviction be rewarded.
See you next year for the next big swing.
Take your profits, you lunatics! 😄🔥

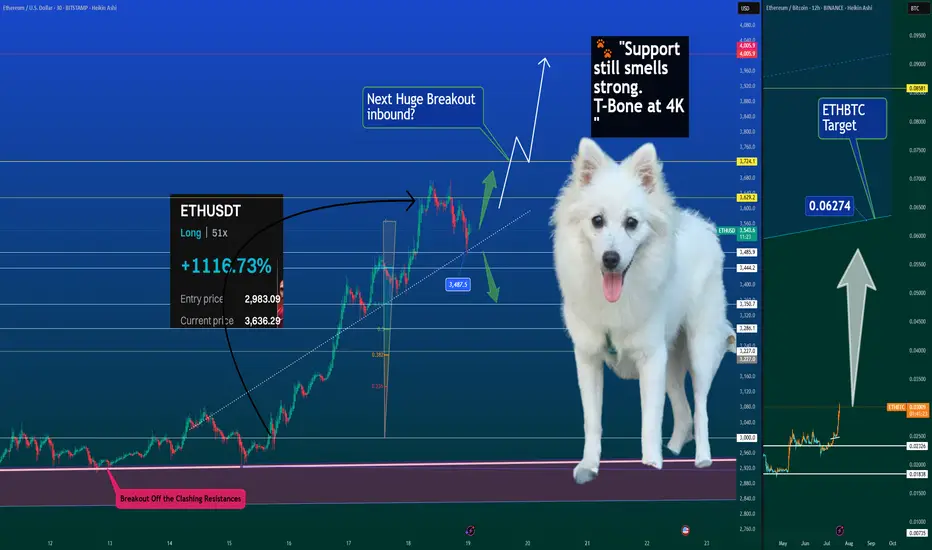
Is ETH Season Officially Here? 🚀🐾 Ethereum Breaking Out – Is ETH Season Officially Here? 📈💥
Ethereum is showing strength across the board — outperforming Bitcoin, reclaiming trendline support, and eyeing a possible breakout continuation. While macro narratives swirl (crypto legislation, rate cut vibes, political tailwinds), ETH is finally doing what ETH does best — lead.
📊 Chart Breakdown:
ETHUSDT is respecting the dotted trendline off the breakout.
Price is hovering around $3487 support, an area that aligns with Fib retracement and the last impulse base.
If bulls can maintain structure, $4000–$4050 is a natural magnet above.
📈 On the ETHBTC side, we’re aiming for the 0.06274 level — this ratio breakout is classic ETH season behavior, where Ethereum not only rises but pulls the rest of the market with it.
👀 And yes… even Elon my Dog is sniffing this one out:
🐾 "Support still smells strong. T-Bone at 4K." Then we go higher for the Cow.
📊 Order Flow Data Confirms:
Premium: Still slightly negative — market hasn’t fully rotated in.
Funding: Light and positive — sustainable, not euphoric.
Open Interest: Saw a soft reset — leverage was cleared out, opening room to rally.
Spot volume: Steady and supportive, not chasing.
🔥 +1116% ROI from the last long from $2,983.09. If you’re holding ETH — you’re holding the mic right now. Let's not drop it.
This could just be the beginning — and when ETH leads, the rest tends to follow.
Elon and the whole 🐶 Dog Team are on high alert. Breakout energy is thick.
One Love,
The FXPROFESSOR 💙
Disclosure: I am happy to be part of the Trade Nation's Influencer program and receive a monthly fee for using their TradingView charts in my analysis. Awesome broker, where the trader really comes first! 🌟🤝📈
ETHUSD Smart Money Breakdown – Price Rejection from Premium ZoneEthereum has shown a strong impulsive rally after multiple Breaks of Structure (BOS) from early June, signaling a clear shift in market sentiment from bearish to bullish. Each BOS indicates that demand zones have been respected and liquidity has been efficiently used to fuel higher prices — a classic signature of institutional involvement.
🧠 Smart Money Insight
As price aggressively rallied into the resistance zone ($3,600–$3,800), the market entered a premium pricing area, where smart money typically offloads positions and hunts liquidity from late buyers. This area has historically been a high reaction zone — and as seen on the chart, ETH shows signs of buyer exhaustion, suggesting a possible short-term reversal.
🔁 Anticipated Market Behavior
A corrective move is likely from this resistance, and the first target for retracement lies in the support zone around $3,000–$3,200. This level aligns with:
Previous BOS retest area
Fair value imbalance fill
Mid-range equilibrium
If momentum continues downward, the next zone of interest will be the strong support region at $2,200–$2,400, which served as a major accumulation zone. That’s where large orders previously entered the market — and a strong reaction is expected again.
📊 Market Structure Summary:
BOS Confirmations: Validated bullish structure
Liquidity Grab: At resistance – potential sweep and reversal
Premium Zone Rejection: Smart money short opportunity
Discount Zone Targets: Support & strong support zones
✅ Conclusion
ETH is at a critical decision point. If price holds below resistance with continued bearish pressure, a retracement is not only healthy — it's expected. Traders should wait for confirmation of lower timeframe structure breaks before entering shorts, and target the $3,000 zone first, with eyes on $2,200 if momentum persists.

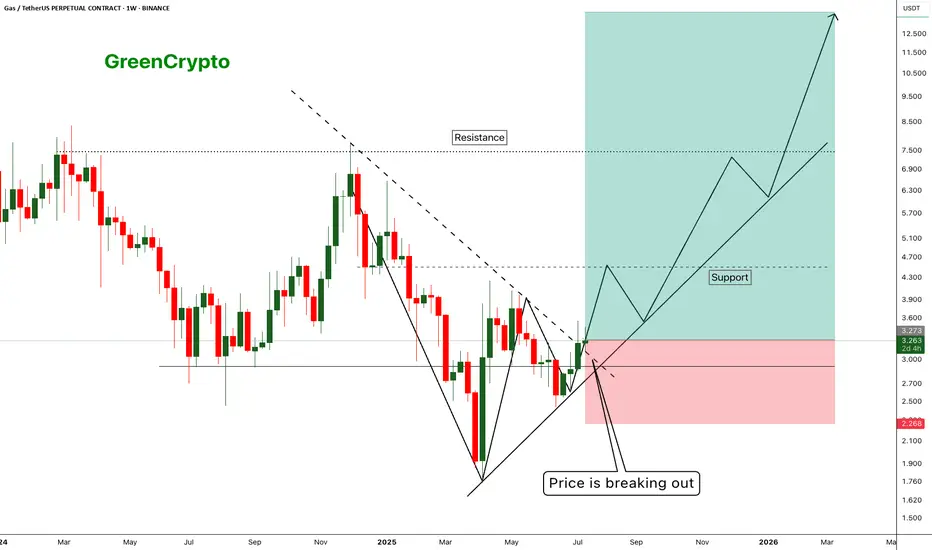
GAS - Huge Risk:Reward Trade 1:10 - Is there any Gas Left ?- Gas has finally managed to breakout from the resistance trendline and now trading just above the resistance
- I'm expecting this trend to continue along the support line shown in the chart.
Entry Price: 3.281
Stop Loss: 2.271
TP1: 3.944
TP2: 4.589
TP3: 6.775
TP4: 8.412
TP5: 13.512
Max Leverage 5x.
Don't forget to keep stoploss.
Support us by Liking and following.
Thanks and Cheers!
GreenCrypto
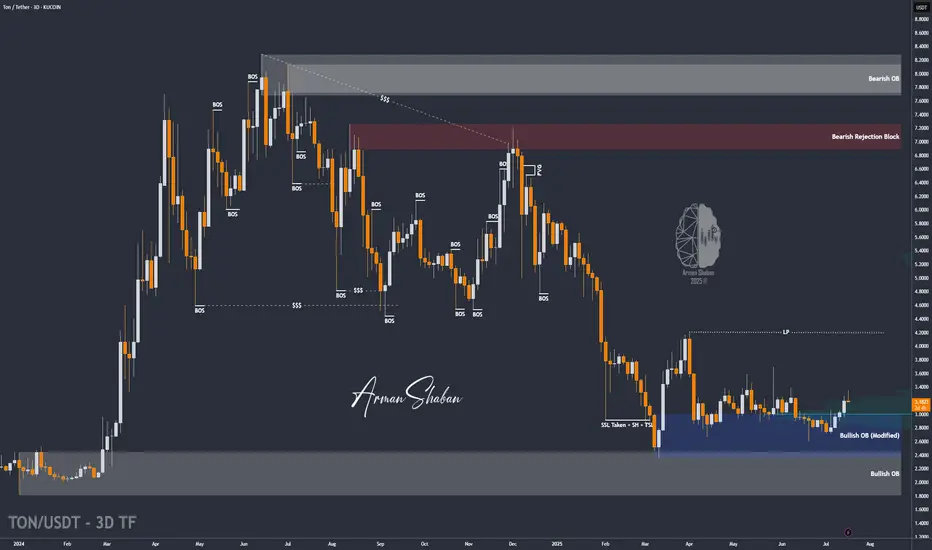
TON/USDT | Another Bullish Move Ahead? (READ THE CAPTION)By analyzing the Toncoin chart on the 3-day timeframe, we can see that, as per yesterday’s analysis, the price climbed to $3.36 before facing a slight correction — which is perfectly normal since every strong bullish trend needs a healthy pullback. The $3.05–$3.20 zone could serve as a good accumulation area for buyers, and we may soon witness another impressive rally from Toncoin! Based on the previous analysis, the next targets are $3.63, $4.20, and $4.68.
Please support me with your likes and comments to motivate me to share more analysis with you and share your opinion about the possible trend of this chart with me !
Best Regards , Arman Shaban
ADA/USDT | BIG Bullish Move Ahead! (READ THE CAPTION)By analyzing the Cardano chart on the 3-day timeframe, we can see that, as expected, the price continued its rally, reaching $0.89 before collecting liquidity above the $0.86 level and then facing a correction. Currently trading around $0.81, we expect the bullish trend to continue after this minor pullback. Key demand zones are at $0.78, $0.69, and $0.61. Based on the previous analysis, the next short- to mid-term bullish targets are $0.93, $1.05, and $1.33.
Please support me with your likes and comments to motivate me to share more analysis with you and share your opinion about the possible trend of this chart with me !
Best Regards , Arman Shaban
