ETHBTC - Showing ActivityETHBTC has jumped up and has formed a short term bullflag
Has ETHBTC bottomed?
ETH ^^
Daily chart
Ethereum (Cryptocurrency)

ETHEREUM BULLFLAGA nice bullflag structure has presented itself on this daily timeframe
I think this bullflag will allow ETH to catch up to BTC in term of alts vs BTC
I expect a very strong bullish move to be coming in the next month or next month breaking out of this bullflag
Green horizontal has been seen previously as a point of support.

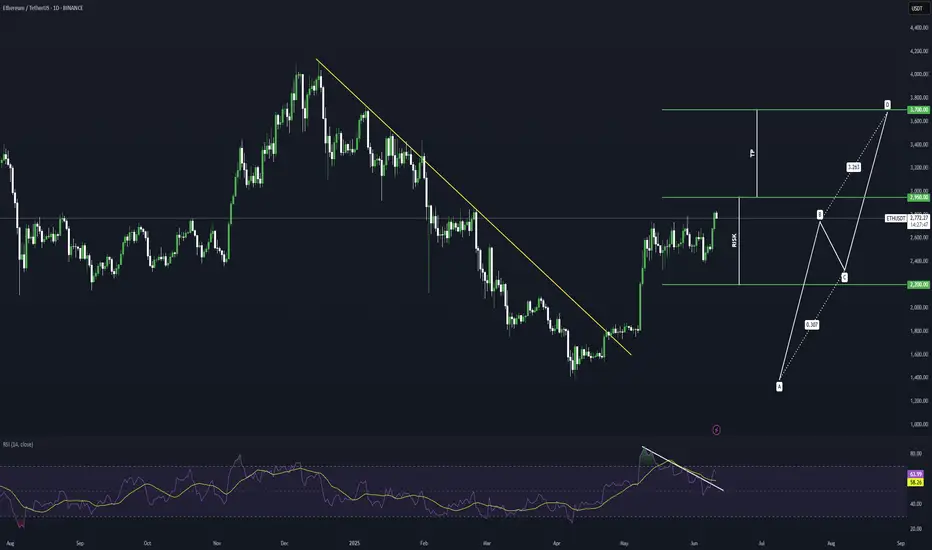
ETHEREUM Potential Bullish BreakoutEthereum price seems to exhibit signs of overall potential Bullish momentum if the price action forms a prominent Higher High with multiple confluences through key Fibonacci and Support levels which presents us with a potential long opportunity.
Trade Plan:
Entry : 2950
Stop Loss : 2200
TP 1 : 3700
ETHEREUM This Megaphone emerged on all previous Cycles.Ethereum (ETHUSD) is showing incredible strength at the moment as it broke above its 1W MA50 (blue trend-line) and its goal now will be to close the week above it.
This resembles May 2020 and January 2017 when again the price was struggling to break above its 1W MA50, all within a similar Megaphone pattern, and eventually succeeding. The similarities among those 3 patterns so far are striking despite being formed on different Cycles.
As you can see, we are currently on the 0.618 Fibonacci level of the Megaphone, which is exactly where ETH was during the other 2 Cycles when it tested the 1W MA50 and broke out. Once the 1W MA50 turned into Support, the market never looked back and initiated the parabolic rallies of 2020/ 2021 and 2017.
Based on that, we expect ETH to test the 1.5 Fibonacci extension, around $7000.
-------------------------------------------------------------------------------
** Please LIKE 👍, FOLLOW ✅, SHARE 🙌 and COMMENT ✍ if you enjoy this idea! Also share your ideas and charts in the comments section below! This is best way to keep it relevant, support us, keep the content here free and allow the idea to reach as many people as possible. **
-------------------------------------------------------------------------------
💸💸💸💸💸💸
👇 👇 👇 👇 👇 👇

ETH Just Broke Out — Here’s Why $3,445 and $3,995 Are TPsEthereum is showing a strong bullish structure on the daily chart, having recently broken out of a month-long consolidation channel. After spending over 35 days trading in a narrow sideways range between approximately $2,345 and $2,780, ETH has now pushed through the upper boundary of that zone, signaling a shift in momentum.
This breakout from the accumulation zone is significant. The highlighted box on the chart indicates a period of low volatility and tight price compression—often a precursor to a sharp directional move. The breakout candle was decisive and supported by rising volume, as confirmed by the PVT (Price Volume Trend) indicator, which shows a clear uptick in accumulation. This suggests that institutional and smart money may be positioning for further upside.
The reclaimed level around $2,503, previously acting as major support, is now serving as a strong base. If ETH continues to close daily candles above this threshold, the bullish momentum is likely to continue. The immediate resistance lies around $3,445, marking the first target zone (TP1), followed by a more ambitious extension toward $3,995, which aligns with Resistance Level 2 (TP2). These targets represent gains of approximately 21% and 41% from current levels, respectively.
A measured trade setup from the current zone offers a solid risk-reward ratio of 2.4. The stop loss is reasonably placed just below the breakout structure at $2,344. If ETH falls back below this level and closes inside the previous channel, the breakout would be invalidated, and bulls would need to reassess.
This setup aligns with a classic trend continuation pattern—breakout from consolidation, volume confirmation, and a potential retest of the breakout level. As long as price remains above $2,503, bulls remain in control, and the medium-term outlook remains favorable.
In conclusion, Ethereum appears poised for a bullish continuation on the daily timeframe. The channel breakout, rising accumulation pressure, and clean technical structure support the idea that ETH may soon challenge higher resistance zones. However, price must hold above key support to maintain this bias. Traders and investors may view current levels as a favorable risk-entry opportunity with eyes on $3,445 and $3,995 as major profit zones.

Ethereum Set for a Massive Pump!ETHUSDT Technical analysis update
ETH price has been trading within a channel pattern for the past 30 days, with the 100 and 200 EMA acting as strong support on the 4H chart. Therefore, the likelihood of the price dropping below the 100 and 200 EMA on the 4H chart is very low. Once the price breaks above the channel resistance, we can expect a strong bullish move in CRYPTOCAP:ETH
BITSTAMP:ETHUSD

Bullish continuation?Ethereum (ETH/USD) is falling towards the pivot and could bounce to the 1st resistance.
Pivot: 2,732.37
1st Support: 2,548.35
1st Resistance: 2,898.51
Risk Warning:
Trading Forex and CFDs carries a high level of risk to your capital and you should only trade with money you can afford to lose. Trading Forex and CFDs may not be suitable for all investors, so please ensure that you fully understand the risks involved and seek independent advice if necessary.
Disclaimer:
The above opinions given constitute general market commentary, and do not constitute the opinion or advice of IC Markets or any form of personal or investment advice.
Any opinions, news, research, analyses, prices, other information, or links to third-party sites contained on this website are provided on an "as-is" basis, are intended only to be informative, is not an advice nor a recommendation, nor research, or a record of our trading prices, or an offer of, or solicitation for a transaction in any financial instrument and thus should not be treated as such. The information provided does not involve any specific investment objectives, financial situation and needs of any specific person who may receive it. Please be aware, that past performance is not a reliable indicator of future performance and/or results. Past Performance or Forward-looking scenarios based upon the reasonable beliefs of the third-party provider are not a guarantee of future performance. Actual results may differ materially from those anticipated in forward-looking or past performance statements. IC Markets makes no representation or warranty and assumes no liability as to the accuracy or completeness of the information provided, nor any loss arising from any investment based on a recommendation, forecast or any information supplied by any third-party.

ETH BULLISH SETUPEthereum has recently broken out bullishly on higher timeframes, signaling a potential move toward the key resistance zone around $3,460. This level holds significant technical importance. The breakout above the hourly flag pattern confirms bullish momentum. As long as price holds above $2,300, the setup remains valid. A drop below this level would invalidate the current bullish outlook.

ETH Daily Close Signals Entry
On the daily, ETH is closing above both the 200MA and the previous tops. PSAR on the original system has flipped, though the free-to-use version hasn’t yet.
This is a trading idea. If you choose to allocate real capital, be prepared for the possibility of loss. But if you trust the system enough to allocate capital, trust that the PSAR has flipped and today’s close marks the entry.
It’s exactly how the system defines a valid setup:
Daily close above the 200MA, with MLR > SMA > BB center.
The 12H timeframe acts as confirmation from the lower TF, and the 4H is already green and ripping.
So buckle up—this could be a ride worth taking.
Always take profits and manage risk.
Interaction is welcome.

ETH – System Trigger Hit
ETH on the 12H has just reclaimed the green line: resistance from the previous tops.
This level sits roughly midway between the 0.5 and 0.382 Fib levels, with \$3000 now looking closer than \$2500.
PSAR has just flipped above the last tops, and price is now above MLR > SMA > BB center > 200MA.
All system conditions are met for a long entry on this timeframe.
This also comes as confirmation of the daily signal entry at today closing
Always take profits and manage risk.
Interaction is welcome.

Ethereum Is About to Start Making Its Move to $4100Trading Fam,
Lot's of good patterns occurring on the crypto charts recently, Ethereum is no exception. Here you can see a valid inverse head and shoulders pattern has formed. 85% of the time, these patterns play out.
If we do break that neckline to the upside, I would suggest that $4100 will come fairly quickly. We do have a few resistance areas ahead of us where I expect some pause. But this will only give the market enough time to recognize they may be missing the rocket ride and hop in.
If we don't break that neckline this week, we could pull back for another week. But I think by the end of June our neckline will break and we'll be on our way.
Best,
Stew

ETH - mega dump and mega ultra pumpI found a fractal for Bitcoin, and Ethereum is currently similar to it. If we want to see a truly strong upward movement, then there is a high probability of such a helicopter, as similar situations have already occurred before the strongest growth.

Ethereum sooner or later + $10kEthereum overdue major run will be there sooner or later and my expectation of + $10k for the local peak has not changed

ETH/BTC : Ready to Lead the Altcoin Season?Hey Traders!
If you’re finding value in this analysis, smash that 👍 and hit Follow for high-accuracy trade setups that actually deliver!
Ethereum just broke out of a multi-week symmetrical triangle against Bitcoin — a classic continuation pattern! After consolidating for over a month, this breakout could signal a major shift in market dynamics.
Pattern: Symmetrical Triangle
Measured Move Target: +38.7% from the breakout
Timeframe: 12H
Current Ratio: 0.02517 BTC
🔍 Why ETH/BTC Matters for Altcoins:
When ETH/BTC rises, it often marks the beginning of an altcoin rally. Here's why:
✅ ETH leads altcoins — It’s the largest alt by market cap, and capital often rotates from BTC → ETH → mid/small caps.
✅ Rising ETH/BTC = Bitcoin dominance weakening, giving altcoins room to breathe.
✅ Confidence returns to the broader alt market when ETH outperforms BTC.
If this breakout sustains, we may be entering a strong altcoin season. Keep an eye on ETH strength and look for high-potential setups across the altcoin board!
What are your top altcoin picks for this potential rally? Drop them below 👇

Ethereum's Price Action Reveals A Bullish Bitcoin, $8,513 Next!The strongest possible bullish signal has been confirmed. Ethereum just moved daily above MA200. This is the first time this happens coming from a low point since November 2024, this is massive.
This signal reveals two things: (1) Bitcoin is bullish and set to continue growing. You've never seen Bitcoin and Ethereum going in different directions. If Ethereum is set to continue up, Bitcoin will also do the same. The market is one. (2) Ethereum is now ready to grow for 6 months straight, minimum, and this opens the doors for $5,790 followed by $8,513 in this bullish wave. There can be more of course.
This is one of the strongest signals (MA200) but also one of the easiest to spot. It works with high accuracy, never fails. The market is bullish when the action happens above this indicator long-term.
So now you know, for sure—for certain, what will happen next. Knowing that Ethereum will be trading above $5,000 soon, how are you going to maximize profits from this knowledge? Do what it takes to increase your profits and trading success. This is the opportunity of a lifetime, it can be life changing.
Thank you for reading.
I am wishing you tons of profits, great luck and amazing success.
Namaste.

Ethereum breaking out!Two days ago, I've posted that we're most likely trading in a 2K-4K range on Ethereum. There was a slight deviation below 2K but the bulls swiftly regained control.
As for now, it's seems obvious we are heading towards, at least, 3K. I'm confident 4K is on the horizon, though I prefer to take it level by level.
ETH is breaking out off this bull flag and this chart looks more and more like one of those charts you study in textbooks.

ETHUSD INTRADAY Bullish continuation consolidation Trend Overview:
ETH/USD) remains in a bullish trend, characterized by higher highs and higher lows. The recent intraday price action is forming a continuation consolidation pattern, suggesting a potential pause before a renewed move higher.
Key Technical Levels:
Support: 2514 (primary pivot), followed by 2356 and 2220
Resistance: 2940 (initial), then 3000 and 3120
Technical Outlook:
A pullback to the 2514 level, which aligns with the previous consolidation zone, could act as a platform for renewed buying interest. A confirmed bounce from this support may trigger a continuation toward the next resistance levels at 2940, 3000, and ultimately 3120.
Conversely, a daily close below 2514 would suggest weakening bullish momentum. This scenario would shift the bias to bearish in the short term, potentially targeting 2356 and 2220 as downside levels.
Conclusion:
ETH/USD maintains a bullish structure while trading above the 2514 support. A bounce from this level would validate the consolidation as a continuation pattern, with upside potential toward the 2940 area. A breakdown below 2514, however, would invalidate this view and suggest deeper corrective risk.
This communication is for informational purposes only and should not be viewed as any form of recommendation as to a particular course of action or as investment advice. It is not intended as an offer or solicitation for the purchase or sale of any financial instrument or as an official confirmation of any transaction. Opinions, estimates and assumptions expressed herein are made as of the date of this communication and are subject to change without notice. This communication has been prepared based upon information, including market prices, data and other information, believed to be reliable; however, Trade Nation does not warrant its completeness or accuracy. All market prices and market data contained in or attached to this communication are indicative and subject to change without notice.

ETH will 5X from HERE! Hit the Like to manifest this.I'm serious hit the like to turn this #HVF into a reality.
I have been monitoring this pattern build out for years now.
BUT we are on the verge on triggering this pattern any day now, and triggering a massive Altcoin run which sucks in capital from all parts of the globe.
@TheCryptoSniper

Ethereum Near Monthly HighFenzoFx—Ethereum trades near $2,790, aligning with its monthly high and the 50.0% retracement level. A wide Fair Value Gap could act as a price magnet, while bearish candlestick wicks signal selling pressure.
Stochastic at 79 nears overbought territory, suggesting a potential bearish wave if $2,790 resistance holds. A drop below $2,100 could align with the Fair Value Gap.
The bearish outlook is invalidated if ETH closes above $2,790.
>>> Trade ETH swap free at FenzoFx.

Bullish continuation?Ethereum (ETH/USD) is falling towards the pivot and could bounce to the 1st resistance.
Pivot: 2,364.01
1st Support: 2,548.35
1st Resistance: 2,788.17
Risk Warning:
Trading Forex and CFDs carries a high level of risk to your capital and you should only trade with money you can afford to lose. Trading Forex and CFDs may not be suitable for all investors, so please ensure that you fully understand the risks involved and seek independent advice if necessary.
Disclaimer:
The above opinions given constitute general market commentary, and do not constitute the opinion or advice of IC Markets or any form of personal or investment advice.
Any opinions, news, research, analyses, prices, other information, or links to third-party sites contained on this website are provided on an "as-is" basis, are intended only to be informative, is not an advice nor a recommendation, nor research, or a record of our trading prices, or an offer of, or solicitation for a transaction in any financial instrument and thus should not be treated as such. The information provided does not involve any specific investment objectives, financial situation and needs of any specific person who may receive it. Please be aware, that past performance is not a reliable indicator of future performance and/or results. Past Performance or Forward-looking scenarios based upon the reasonable beliefs of the third-party provider are not a guarantee of future performance. Actual results may differ materially from those anticipated in forward-looking or past performance statements. IC Markets makes no representation or warranty and assumes no liability as to the accuracy or completeness of the information provided, nor any loss arising from any investment based on a recommendation, forecast or any information supplied by any third-party.

New cycle growth - GTFO moment soonNo analysis, simply an observation of what the market has been preparing for for many years. Since 2017, the ICO era, since then the market has matured to a completely new level.
Be careful with following Ben Cowen and other social influencers.
Given the market maturity since 2017, I believe what we call alts season will turn into a slow steady growth, last time it took a year, this time I think it will be the entire Trump's term if not longer.

ETH Price Prediction June: Don't Ignore Ethereum's Path to $3KEthereum, the second-largest cryptocurrency by market capitalization, is once again commanding significant attention across the digital asset landscape. As the broader market navigates periods of uncertainty and consolidation, Ethereum appears to be carving out a distinct path, demonstrating remarkable resilience and attracting substantial capital inflows. A confluence of factors, including a new all-time high in a critical on-chain metric, robust institutional interest, and a building technical momentum, suggests that ignoring Ethereum at this juncture would be a misstep for any serious investor. The current market dynamics are painting a compelling picture for Ether's trajectory, particularly as June unfolds, with analysts eyeing significant price levels.
The Unignorable Signal: A New All-Time High in a Major Metric
The digital asset space is often characterized by its volatility and rapid shifts in sentiment. Yet, beneath the surface of daily price fluctuations, fundamental indicators often provide the most profound insights into the health and growth of a blockchain network. For Ethereum, a recent development has sent a clear signal that cannot be overlooked: a major network metric has reached an unprecedented all-time high. While the specific metric can vary, such milestones typically point to an underlying surge in network utility, user adoption, or developer activity.
Consider, for instance, metrics like the total value locked (TVL) in decentralized finance (DeFi) protocols built on Ethereum, the number of active addresses engaging with the network, or the aggregate gas consumption, which reflects overall network demand. A new peak in any of these areas signifies a robust and expanding ecosystem. If the all-time high is in TVL, it suggests that more capital is flowing into and being utilized within Ethereum’s DeFi applications, indicating growing trust and utility in its financial primitives. An increase in active addresses points to a wider user base interacting with the network for various purposes, from transacting to engaging with decentralized applications (dApps). Similarly, sustained high gas consumption, even if it leads to higher transaction fees, underscores the immense demand for block space on the Ethereum blockchain, a testament to its indispensable role in the decentralized internet.
This surge in a key metric is not merely a statistical anomaly; it represents a fundamental validation of Ethereum's long-term vision and its ongoing evolution. It suggests that despite market corrections or periods of sideways trading, the underlying utility and adoption of the Ethereum network continue to grow unabated. This organic growth, driven by real-world use cases and an ever-expanding developer community, forms a strong bedrock for future price appreciation. Pundits are right to highlight this signal, as it separates Ethereum from purely speculative assets and firmly places it in the category of a foundational technology with increasing real-world relevance. It implies that the network's value proposition is strengthening, attracting more users, developers, and capital, thereby reinforcing its position as the leading smart contract platform.
Institutional Endorsement: $296 Million Inflows and a Historical Week
Perhaps one of the most compelling narratives surrounding Ethereum's current strength is the undeniable surge in institutional interest. In a market environment often described as a "slowdown," Ether investment products witnessed an astonishing $296 million in inflows last week. This figure is not just significant in absolute terms; it marks the best week for Ether crypto funds since the election of former US President Donald Trump, a period that dates back several years and encompasses numerous market cycles
.
This monumental inflow of capital from institutional players is a powerful vote of confidence in Ethereum. It signifies that large-scale investors, including hedge funds, asset managers, and family offices, are increasingly allocating significant portions of their portfolios to Ether. Such inflows are particularly noteworthy during a "market slowdown," as they suggest a strategic long-term positioning rather than speculative short-term trading. While retail investors might be more susceptible to market sentiment swings, institutional investors typically conduct extensive due diligence and operate with a longer investment horizon. Their willingness to deploy hundreds of millions of dollars into Ether products indicates a conviction that Ethereum represents a valuable asset with substantial growth potential, capable of delivering strong returns over time.
The context of these inflows is also crucial. Investors are currently awaiting clarity from the US Federal Reserve's June rate decision, a macroeconomic event that often casts a shadow of uncertainty over risk assets. Despite this prevailing caution, institutional money continued to flow into Ethereum, underscoring a belief in its intrinsic value and its ability to perform independently of, or even as a hedge against, traditional market volatility. This behavior suggests that institutions view Ethereum not just as a speculative digital currency, but as a critical piece of the emerging digital economy, akin to a technology stock with immense disruptive potential. The steady accumulation by these sophisticated players provides a strong floor for Ether's price and signals a maturation of the asset class, moving beyond the fringes into mainstream financial portfolios. This institutional embrace is a critical catalyst, providing liquidity, stability, and legitimacy to the Ethereum ecosystem.
Consolidation and Momentum: Setting the Stage for June's Price Action
From a technical analysis perspective, Ethereum's price action has recently been characterized by a period of consolidation. Consolidation, in market terms, refers to a phase where an asset's price trades within a relatively narrow range, often after a significant price movement. This period is typically seen as a time for the market to digest previous gains or losses, allowing for accumulation or distribution before the next major move. For Ethereum, this consolidation is occurring while momentum is visibly building.
The concept of "momentum building" implies that underlying buying pressure is gradually increasing, even if the price isn't making dramatic upward moves on a daily basis. This can manifest through higher lows, decreasing selling pressure at key support levels, and a gradual increase in trading volume during upward movements. This type of price action is often considered healthy, as it allows the market to establish a strong base from which to launch its next leg up. Rather than a parabolic and unsustainable surge, a period of consolidation followed by building momentum suggests a more organic and sustainable growth trajectory. It allows early investors to take profits, new investors to enter, and the market to find a new equilibrium before breaking out.
Ethereum June Price Prediction: Key Levels to Watch
Given the current market dynamics, including the new all-time high in a major metric, the significant institutional inflows, and the building technical momentum, analysts are increasingly bullish on Ethereum's prospects for June. A prominent analyst has explicitly stated that a target of $3,000 is "in sight" for the month. This specific price target is not arbitrary; it likely stems from a combination of technical indicators, such as Fibonacci extensions, previous resistance levels, and psychological price points, combined with the strong fundamental and institutional tailwinds.
To reach and sustain the $3,000 level, Ethereum will need to navigate several key price points. Currently, the immediate resistance levels might be found around recent local highs, perhaps in the range of $2,500 to $2,700. Breaking through these levels with conviction, ideally on increased volume, would confirm the building momentum and pave the way for further upward movement. The psychological barrier of $3,000 itself is significant; once breached, it can often act as a new support level, attracting further buying interest and reinforcing bullish sentiment.
On the downside, key support levels would be crucial to watch. These might lie around the lower bounds of the recent consolidation range, potentially in the $2,200 to $2,300 area. A strong bounce from these levels, should the price retest them, would confirm the underlying strength and the presence of buyers willing to defend these price points. A more significant support could be found around the $2,000 mark, a major psychological and technical level that has historically proven to be a strong area of interest. Maintaining above these critical support zones would be essential to keep the bullish narrative intact and to validate the analyst's $3,000 target.
Factors that could influence this trajectory include the aforementioned US Fed rate decision, which could either provide clarity and boost risk appetite or introduce further caution. Additionally, ongoing developments within the Ethereum ecosystem, such as progress on scalability solutions (Layer 2 networks) and the continued growth of its dApp ecosystem, will play a role. Any major news regarding regulatory clarity or institutional product launches could also act as significant catalysts. However, the current confluence of strong on-chain fundamentals and institutional demand provides a robust foundation for the projected price appreciation.
Ethereum's Enduring Significance and Future Outlook
Beyond the immediate price predictions and market movements, it is crucial to remember Ethereum's enduring significance in the broader cryptocurrency and blockchain landscape. Ethereum is not merely a digital currency; it is the foundational layer for the vast majority of decentralized applications, non-fungible tokens (NFTs), and the burgeoning decentralized finance (DeFi) sector. Its smart contract capabilities have enabled an explosion of innovation, creating an entirely new digital economy that continues to expand at an exponential rate.
The ongoing advancements within the Ethereum ecosystem, particularly the continuous development of its scalability solutions and the transition towards a more energy-efficient consensus mechanism, are critical for its long-term viability and growth. These technical improvements aim to address network congestion and high transaction fees, making Ethereum more accessible and efficient for a global user base. As these solutions mature and become more widely adopted, Ethereum's capacity to host and process an ever-increasing volume of transactions will only strengthen, further solidifying its position as the backbone of the decentralized web.
The "do not ignore" message resonates deeply with Ethereum's fundamental value proposition. It is a network that is constantly evolving, attracting the brightest minds in technology, and demonstrating real-world utility that extends far beyond speculative trading. The combination of a thriving developer community, a vibrant ecosystem of dApps, growing institutional acceptance, and a clear roadmap for future improvements positions Ethereum as a cornerstone of the digital future. The current market signals, from the new all-time high in a key metric to the unprecedented institutional inflows, are not just fleeting trends but indicators of a profound shift in how the financial world and broader society view and utilize this revolutionary technology.
In conclusion, Ethereum stands at a pivotal moment. The convergence of strong on-chain fundamentals, evidenced by a new all-time high in a major network metric, and a significant influx of institutional capital underscores its growing maturity and undeniable importance. Despite broader market uncertainties, Ether investment products have seen historical inflows, signaling deep-seated confidence from sophisticated investors. Technically, the asset is consolidating, building momentum that analysts believe could propel it towards the $3,000 mark in June. For those observing the digital asset space, the message is clear: Ethereum is not just surviving a market slowdown; it is thriving, evolving, and cementing its role as an indispensable pillar of the decentralized economy. Ignoring its current trajectory would be to miss a significant chapter in the ongoing digital revolution.

