Ethereum (ETHUSD) • Daily • Trading ideaEthereum (ETHUSD) • Daily Chart 🚀
---
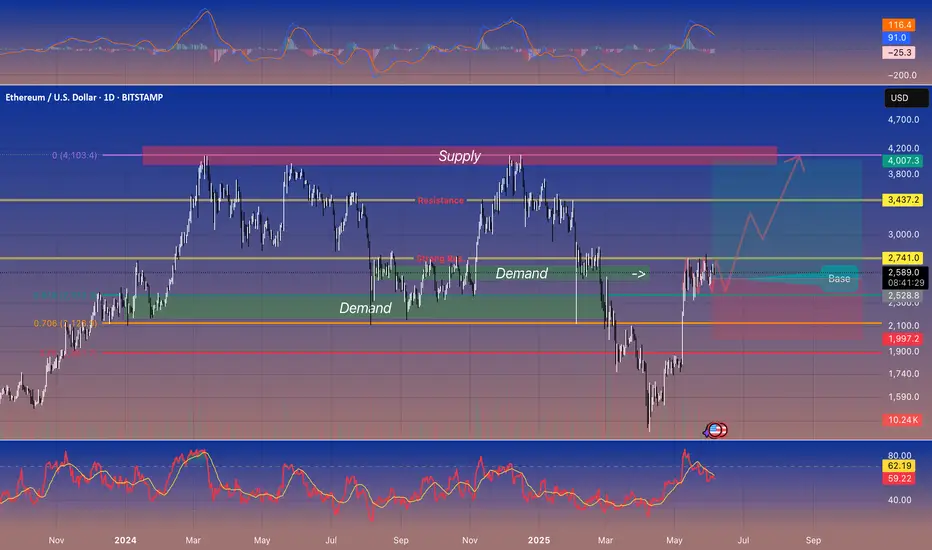
🔑 Key Levels
* Demand Zone (Support): \$2,350–2,550
* Price has bounced here twice in the last year.
* Immediate Resistance: \$2,741
* Multiple rejections around this level recently.
* Next Major Resistance: \$3,437
* Former highs in late 2024/early 2025.
* Big Supply Zone (Strong Sell Area): \$4,000–4,200
---
💡 What’s Happening?
* ETH is sitting in a “base” between \$2,528–2,741 (green box).
* If it breaks above \$2,741 on strong volume, it can run toward \$3,437 and eventually \$4,000+.
* If it falls below \$2,528 (demand), the next support is around \$1,997.
---
🎯 Trade Idea
* Bullish Entry: Buy on a daily close above \$2,741 + higher-than-usual volume.
* First Target: \$3,437 (take partial profit).
* Final Target: \$4,000–4,200 (major sell area).
* Stop-Loss: Below \$2,500 (just under support).
* Bearish Scenario:
* If price drops below \$2,528 with big volume, look for a possible move down toward \$1,997.
---
📈 Indicators (Confirmation Only)
* Volume: Watch for a spike on any breakout above \$2,741.
* MACD & RSI: If both are rising (not overbought), it adds confidence—though price and volume matter most.
---
👍 Summary
ETH is coiling in a strong support zone. A clean break above \$2,741 on good volume can send it to \$3,437, then \$4K+. If support fails, \$1,997 is next. Trade with proper stops and watch volume for confirmation.
— Feel free to leave a 🚀 if this helps!
#Ethereum #ETHUSD #Crypto #Support #Resistance #Volume
Ethereum (Cryptocurrency)
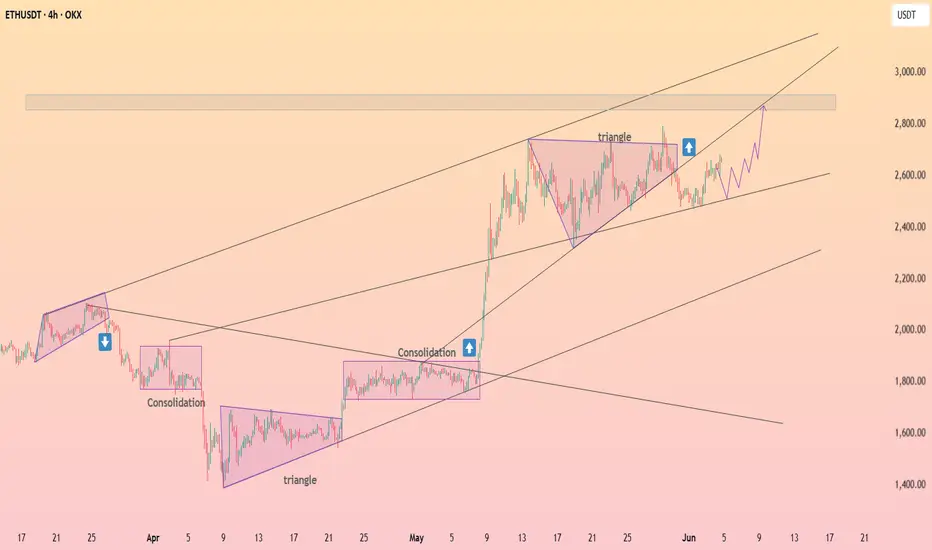
HolderStat┆ETHUSD channel climbCRYPTOCAP:ETH cruises within a steep four-hour rising channel; the latest triangle breakout paused near 2.6 k. Converging trendlines, former consolidation support and higher-low structure all aim for the 2.9 k liquidity zone. Bulls steer while the channel median holds.
ETHCHAN. Vitalik like it.ETHCHAN with a strong narrative experiences fluctuations and now the price can make a Fibo bounce.

ETHUSD: Buying opportunityWarning, this is highly speculative!
Ethereum faced a gruesome decline since the peak of around 4000 back in december, reaching a bottom of ~$1400
Then, in may, we had a huge rally, boasting a nearly 100% bounce from bottom to top.
Now, this fact alone has many people holding off on buying short term, as they feel a drop could be just around the corner, however, i think for this exact reason, aswell as an inbound risk-on environment, it will continue the rally, and much faster and for much longer than anticipated, creating that FOMO wave people seem so desperate to try and catch.
The whole reason you end up with the feeling of FOMO, is because your past decisions seem stupid in hindsight, and recent price action makes it seem obvious.
Well let me tell you, its NOT obvious, and that is precisely why it runs and creates that FOMO wave.
Price targets are irrelevant, focus on recognizing when greed runs amok, and take profits accordingly.
EOY Would be an obvious point at which selling heavy might be smart, but then again, its never obvious... Goodluck!

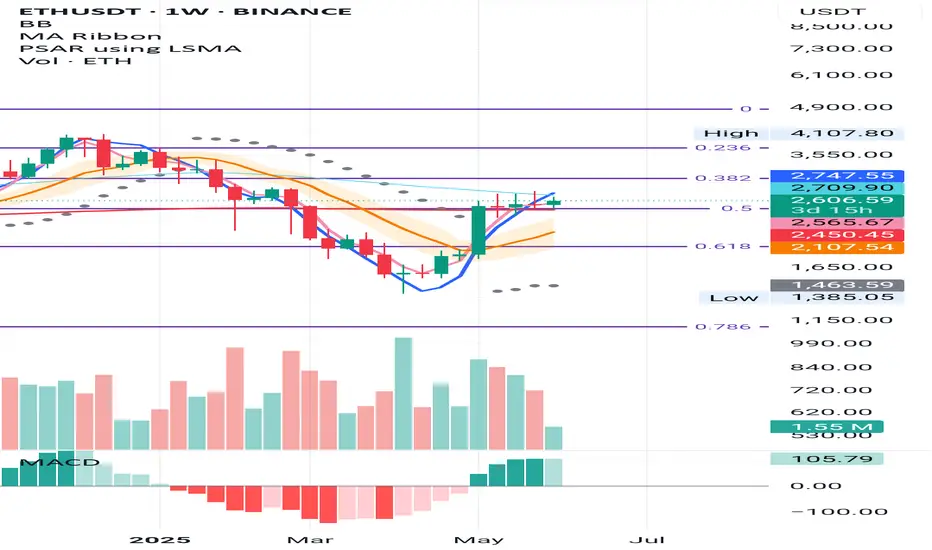
ETH Weekly – Signs Aligning for a Long Setup
ETH is forming subtle higher lows above the 0.5 Fibonacci level and the 200MA—both sitting near the same key support zone.
The 50MA is currently acting as resistance, but structurally we’re seeing MLR > SMA > BB center, and the PSAR flipped bullish since the week of May 12.
We now have all the signals needed for a valid long entry on this timeframe.
Feel free to drop your thoughts in the comments—good or bad, all engagement is appreciated.
Take profits. Manage risk. Stay sharp.
Ethereum has reached its bottomKey support trendline should offer spring towards the next bullish wave.

ETH Monthly – Fibonacci Structure in Play
ETH has been respecting the monthly Fibonacci levels with surprising precision.
There was a clear double top at the 0.236 Fib in May and November 2024, with a base forming at the 0.5 Fib. That same 0.5 Fib now acts as support, aligned with the 50MA.
The BB centre is currently stopping price, but for how long remains to be seen.
SMA is above MLR and rising, which supports a bullish bias.
If this structure holds, the next resistance zones may align with the higher Fib levels.
Feel free to drop your thoughts in the comments—good or bad, all engagement is appreciated.
Take profits. Manage risk. Stay sharp.

Ethereum Short-Term Prediction Hidden Bullish divergence on Ethereum spotted while reclaiming important Fibonacci level!

Ethereum Prediction update 7% PUMP and Targets HIT! Whats Next?Ethereum hit both of our targets, and pumped by 8% without any leverage!! What is going to happen next?

Ethereum is still bullish! (1D)First of all, read the text carefully to avoid any misunderstandings.you should know that the market is currently at a sensitive point, and Ethereum’s bullish move does not necessarily mean other coins will follow the same path.
As marked on the chart, the START of Ethereum’s bullish move began after a lengthy and deep correction. Observing ETH's current behavior, this wave is sharp and appears to be more of a time-based correction rather than price-based. Wave B moved sideways and took significantly more time than wave A, suggesting that wave C could very well begin without a deep pullback, pushing price toward higher levels.
There’s a liquidity pool in the upper area that we’ve highlighted. In order for this momentum to slow down, price likely needs to hunt a major liquidity level.
There was a fresh order block inside the liquidity pool, and although price touched it, there wasn’t a deep reaction | lows weren’t taken out, and all the lows during the correction have remained intact, which is a bullish signal.
It seems that price intends to at least reach the red zone we've marked.
For this scenario to play out, the two green lines near the current price candles must hold. A daily candle closing below the invalidation level would invalidate this outlook.
For risk management, please don't forget stop loss and capital management
Comment if you have any questions
Thank You

ETH/USD gearing up for potential breakoutThe ETH/USD has been coiling inside a bullish continuation pattern for several weeks now and a breakout could be on the cards soon. The consolidation suggests ETH is gearing up for a potential breakout soon, as it chips away at resistance coming from the 200-day moving average near $2700.
Further resistance is seen between $2745 to $2855, as shaded in grey on the chart. If it gets through this area of resistance in the coming days, then a big breakout could be on the cards, with the first stop likely around $3,000, but we could go much further than that over time, given the length of the current consolidation.
However, it is essential that the ETH/USD doesn't break the support trend of the consolidation pattern and key support at $2470 now. If it does, then that would invalidate the bullish price structure.
By Fawad Razaqzada, market analyst with FOREX.com

MicroStrategy: The Dumbest Bet on WallStreetMicroStrategy: The Bitcoin Bet Masquerading as a Tech Company
Introduction: A Software Company Turned Crypto Casino
Once upon a time, MicroStrategy was a business intelligence firm. Today, it’s a Bitcoin holding company disguised as a software business.
Its market cap has ballooned to over $100 billion, not because of its software, but because of its aggressive Bitcoin purchases. Investors aren’t buying a company—they’re buying a leveraged bet on Bitcoin.
And that bet? It’s built on debt, dilution, and dangerous financial engineering.
The Math Problem: MicroStrategy’s Obscene Valuation
MicroStrategy is worth three times the value of its Bitcoin holdings. Let that sink in.
If you buy MicroStrategy stock, you’re effectively paying three times the price of Bitcoin. It’s like buying Bitcoin at $245,000 per coin when the actual market price is far lower.
This isn’t investing, it’s financial insanity.
The Debt Trap: How MicroStrategy Keeps the Illusion Alive
MicroStrategy’s entire strategy revolves around issuing debt to buy more Bitcoin. It has borrowed $7.27 billion through convertible bonds.
Here’s how the cycle works:
MicroStrategy issues debt at low interest rates.
It uses the money to buy Bitcoin.
The stock price rises because investors think it’s a genius move.
The company issues more shares to raise more money.
It buys more Bitcoin—and the cycle repeats.
This is not a sustainable business model. It’s a Ponzi-like structure that depends entirely on Bitcoin’s price continuing to rise.
The Accounting Trick: Hiding the Losses
MicroStrategy has been misleading investors with custom financial metrics. It created terms like BTC Yield and BTC $ Gain to make its Bitcoin strategy look profitable.
But in reality? It recently disclosed a $5.91 billion unrealized loss on its Bitcoin holdings. And when that news broke, its stock dropped 8.67% in a single day.
This isn’t a company, it’s a high-stakes gamble.
The Risk: What Happens When the Bubble Bursts?
MicroStrategy’s survival depends on Bitcoin’s price never crashing. If Bitcoin falls, MicroStrategy’s stock collapses.
And here’s the worst part:
If Bitcoin crashes, MicroStrategy might have to sell its holdings, triggering a death spiral.
If investors lose confidence, the company can’t issue more debt, and the illusion falls apart.
If regulators step in, MicroStrategy’s entire strategy could be dismantled.
This isn’t a safe investment. It’s a ticking time bomb.
Conclusion: The Dumbest Bet on Wall Street
MicroStrategy isn’t a tech company. It’s a leveraged Bitcoin casino.
Investors aren’t buying innovation, they’re buying hype, debt, and financial engineering. And when the illusion fades, reality will come crashing down.
So ask yourself: Are you investing in a business? Or are you just buying the dream—before it bursts?

"ETH - Time to buy again!" (Update)The ETH will increase $2K and reach to the top of the wedge in the coming weeks .
Best regards CobraVanguard.💚

Important Support and Resistance Area: 2572.5-2783.5
Hello, traders.
Please "Follow" to get the latest information quickly.
Have a nice day today.
-------------------------------------
(MET1! 1D chart)
The current price range of 2572.5-2783.5 is an important support and resistance area.
If it falls in this section, it is likely to fall to the support section of 1693.5-1933.0.
If it rises,
1st: 3293.0-3448.0
2nd: 3902.0-4141.5
You need to respond depending on whether there is support near the 1st and 2nd above.
-
I think that in order to rise above 2783.5, OBV needs to rise above the High Line and remain there.
Therefore, you need to have a relaxed mind and check whether there is support.
-
Thank you for reading to the end.
I hope you have a successful trade.
--------------------------------------------------
- This is an explanation of the big picture.
(3-year bull market, 1-year bear market pattern)
I will explain more details when the bear market starts.
------------------------------------------------------

Ethereum - The most important analysis for 2025!Ethereum - CRYPTO:ETHUSD - is clearly shifting bullish:
(click chart above to see the in depth analysis👆🏻)
After four years of trading, Ethereum is now sitting at the exact same level compared to mid 2021. However, Ethereum has been creating a significant triangle pattern and with the recent bullish price action, a breakout becomes more and more likely. Then, the sky is the limit.
Levels to watch: $4.000
Keep your long term vision!
Philip (BasicTrading)

Ethereum Rally (?) : Strong Infusion with Volume RequiredEthereum can make a very strong rally of at least 35-40 percent.
And so the same goes for the Ishares Ethereum Trust ETF. (ETHA ETF)
But it needs to break the pennant.
And we need to observe strong volume.
Also, if we stay above the 50 and 200 period moving averages while this is happening, good things can happen.
Still, I am neutral until we break the pennant.

HolderStat┆ETHUSD road to the sell zoneCRYPTOCAP:ETH price ascends inside a neat channel after a trio of consolidations. The chart’s marked sell zone near 3 100 USDT aligns with upper resistance, yet current higher-low structure, breakout arrows and supportive trendline suggest bulls intend to test that ceiling soon.

Is Ethereum ready for a higher high?CRYPTO:ETHUSD seems to be the only one, from the top cryptos, wit the best technical set-up, at the moment. Let's dig in.
CME:ETH1!
Let us know what you think in the comments below.
Thank you.
77.3% of retail investor accounts lose money when trading CFDs with this provider. You should consider whether you understand how CFDs work and whether you can afford to take the high risk of losing your money. Past performance is not necessarily indicative of future results. The value of investments may fall as well as rise and the investor may not get back the amount initially invested. This content is not intended for nor applicable to residents of the UK. Cryptocurrency CFDs and spread bets are restricted in the UK for all retail clients.

$ETH prepares for a bullish wave!Ethereum's breakout and retest of the $2.5k level of major resistance on a monthly basis has been completed and ethereum, which also reclaimed its ma50 moving average, is ready for a bullish wave !

ETH Price Action Explained – What the Charts Are Really Saying?🔍 Taking a look at Ethereum ETH right now across multiple timeframes…
On the lower timeframes ⏱️, we’re seeing a bullish break 💥 that might spark some enthusiasm 🚀, but when you zoom out and get that macro perspective 🌐, my outlook shifts from to one of caution ⚠️.
📊 ETH is currently trading into a key resistance level 🧱, and if we step back and view the bigger picture, we can clearly see that it’s been range-bound 🔁 for quite some time.
On the lower timeframes, there might be an opportunity to squeeze a bit out of the range 🎯 by trading between the highs and lows—but keep in mind, this approach is not for the feint hearted ⚡.
📹 This video is purely analysis 🧠, not a trade idea. I’m sharing my thoughts and market view 📈, and I hope you find it helpful and insightful 💡.
🚫 Not financial advice.

ETH is still bearish (4H)This analysis is an update of the analysis you see in the "Related publications" section
Ethereum has now reached a support zone after sweeping the liquidity pool and the supply area at the top of the chart, as marked in the previous analysis. It has lost the trendline, and a slight upward recovery is expected before potentially being rejected again toward lower levels.
A daily candle closing above the invalidation level would invalidate this analysis.
For risk management, please don't forget stop loss and capital management
Comment if you have any questions
Thank You

Phemex Analysis #86: Pro Tips for Trading Ethereum (ETH)Ethereum ( PHEMEX:ETHUSDT.P ) has captured traders’ attention after experiencing a notable 50% rise since early May. Currently, ETH has been consolidating between $2,800 and $2,300 for approximately three weeks. This sideways movement indicates that the market could be in a phase of accumulation, potentially preparing for a bullish breakout. However, traders should remain cautious, as consolidation can sometimes precede bearish trends as well. Let's carefully evaluate several possible scenarios to better understand Ethereum’s next potential move.
Possible Scenarios
1. Breakout Rise (Bullish Scenario)
If Ethereum successfully breaks the critical resistance at around $2,855, particularly with increased trading volume, this would strongly signal the onset of a bullish trend. Such a breakout could attract additional buyers, further fueling upward momentum.
Pro Tips:
Entry Strategy: Consider entering a long position only after ETH clearly surpasses $2,855 with substantial volume.
Risk Management: Place stop-loss orders below the recent resistance-turned-support area around $2,800 to safeguard against potential fake-outs or reversals.
2. Retesting Support Levels (Bearish Scenario)
Should Ethereum fail to surpass the $2,855 resistance zone convincingly, a pullback towards lower support levels becomes likely. Significant areas to monitor in such a scenario include support at $2,320, $1,750, and potentially as low as $1,536.
Pro Tips:
Buy the Dip Carefully: Watch closely for price stabilization at these support levels before initiating accumulation.
Risk Consideration: Avoid aggressively entering positions if price shows accelerated declines with increasing volume. Always wait for confirmed support and reversal signals.
3. Continued Consolidation (Range-bound Scenario)
Ethereum might extend its current consolidation, continually bouncing within the range of $2,300 to $2,800. This scenario presents unique opportunities for traders to capitalize on repeated price movements.
Pro Tips:
Grid Trading Bots: Implement a Grid Trading strategy to effectively capitalize on small but frequent price fluctuations. Start long grid positions near the $2,300 support area and short grid positions around the $2,800 resistance.
Caution and Risk Management: Always set clear stop-loss levels outside the trading range, specifically below support or above resistance, to protect against sudden trend reversals or breakouts.
Conclusion
Ethereum’s current price action presents traders with multiple strategic opportunities, whether through breakout trades, support-level retests, or consolidation strategies. By remaining vigilant, monitoring key levels, and employing disciplined risk management, traders can effectively navigate Ethereum’s evolving market conditions and enhance their trading outcomes.
Tips:
Elevate Your Trading Game with Phemex. Experience unparalleled flexibility with features like multiple watchlists, basket orders, and real-time adjustments to strategy orders. Our USDT-based scaled orders give you precise control over your risk, while iceberg orders provide stealthy execution.
Disclaimer: This is NOT financial or investment advice. Please conduct your own research (DYOR). Phemex is not responsible, directly or indirectly, for any damage or loss incurred or claimed to be caused by or in association with the use of or reliance on any content, goods, or services mentioned in this article.

ETH/USD Bullish PlanGoing long if 2550 breaks and sustain, holding till 2630 range. Exit and re-enter after pull back .Holding till 2666 only it BTC acts well.
