ARBUSDT - This was just the beginning.The upcoming wave will be directed toward all Ethereum-based tokens, with ARB being one of the most significant.
On the 3-day timeframe, you’ll notice it has broken the downward trendline with a giant bullish candle, signaling a trend reversal from bearish to bullish.
It has also formed an inverse Head & Shoulders pattern, a strong bullish signal.
While the long-term targets for this token are insane, I’ll settle for a $2 target—for now.
Best regards Ceciliones 🎯
Ethereum (Cryptocurrency)

Ethereum (ETH) XABCD Pattern – $3,000 Target Ahead?ETHUSDT is at $1,759 and we’ve got an XABCD harmonic pattern in play!
▸ From $1,516 (X) to $4,147 (A), then slow retracement to $2,120 (B), then a big spike to $4,120 (C), and crash to $1,385 (D).
▸ Now, the chart is eyeing $3,000 as the next big target!
▸ Watch $2,100 and $2,500 as resistance on the way up. $1,500 is key support – let’s see if it holds!
✉️ What’s your take?
Will ETH hit $3,000, or are we dipping first? Drop your thoughts! ⬇️

Ethereum (ETH/USDT) – Bullish Momentum Building Toward targetHello guys...
Ethereum has broken out of its long-term descending channel and is currently trading inside a smaller ascending channel, showing strong bullish momentum. After a "fake breakout" below major support around $1,400, ETH quickly reclaimed higher levels, suggesting a bear trap.
Currently, ETH is approaching the critical resistance zone around $2,000. As long as the price stays inside this rising structure and continues making higher lows, the bias remains bullish toward a test of the major resistance.
✅ A clear breakout above $2,000 could trigger a stronger move up.
⚠️ However, if the structure breaks down, we should watch for potential pullbacks.
___________________________
Key Levels to Watch:
Support: $1,720–$1,750 zone
Resistance: $2,000–$2,050 zone

Support and Resistance Zone: 2273.58-2359.35
Hello, traders.
If you "Follow", you can always get new information quickly.
Please click "Boost" as well.
Have a nice day today.
-------------------------------------
(ETHUSDT 1M chart)
In order to turn upward on the 1M chart, the price must rise to the Fibonacci ratio range of 0.382 (2674.80) ~ 0.382 (2723.46) and maintain it.
Before that, the key is whether it can rise above the M-Signal indicator on the 1M chart.
-
(1W chart)
The key is whether the price can be maintained and rise above the M-Signal indicator of the 1W chart.
To do so, we need to check whether the price is maintained by rising near the right Fibonacci ratio 0.5 (2295.84).
In order to continue the uptrend in the medium to long term, the price must be maintained above the M-Signal indicator of the 1M chart.
Accordingly, the key is whether the price can rise above the M-Signal indicator of the 1M chart when the price is maintained by rising near the right Fibonacci ratio 0.5 (2295.84).
Therefore, it is expected that a breakout trade will be possible when the right Fibonacci ratio 0.5 (2295.84) is broken upward.
However, since the StochRSI indicator is showing signs of entering the overbought zone, the increase may be limited.
-
(1D chart)
It showed a big rise as it broke through the A section, that is, the 1861.57 point.
In any case, since it is currently below the M-Signal indicator of the 1M chart, we can see that there is still time to buy.
Therefore, as I mentioned earlier, we should focus on finding a buying point when the price rises above the M-Signal indicator of the 1M chart and maintains the price, or when it rises to the Fibonacci ratio range of 0.382 (2674.80) ~ 0.382 (2723.46) and maintains the price.
ETH is in a typical reverse arrangement (M-Signal of the 1M chart > M-Signal of the 1W chart > M-Signal of the 1D chart).
Therefore, we should focus on finding a buying point while watching the situation with a relaxed mind.
If it continues to rise like this,
1st: 2273.58-2359.35
2nd: 2627.18
3rd: 2921.73
We need to check if it can rise with support near the 1st-3rd above.
If not, if it falls, we need to check if it can support near 1861.57.
-
Thank you for reading to the end.
I hope you have a successful trade.
--------------------------------------------------
- This is an explanation of the big picture.
I used TradingView's INDEX chart to check the entire range of BTC.
I rewrote it to update the previous chart while touching the Fibonacci ratio range of 1.902(101875.70) ~ 2(106275.10).
(Previous BTCUSD 12M chart)
Looking at the big picture, it seems to have been following a pattern since 2015.
In other words, it is a pattern that maintains a 3-year bull market and faces a 1-year bear market.
Accordingly, the bull market is expected to continue until 2025.
-
(Current BTCUSD 12M chart)
Based on the currently written Fibonacci ratio, it is displayed up to 3.618 (178910.15).
It is expected that it will not fall again below the Fibonacci ratio of 0.618 (44234.54).
(BTCUSDT 12M chart)
I think it is around 42283.58 when looking at the BTCUSDT chart.
-
I will explain it again with the BTCUSD chart.
The Fibonacci ratio ranges marked in the light green boxes, 1.902 (101875.70) ~ 2 (106275.10) and 3 (151166.97) ~ 3.14 (157451.83), are expected to be important support and resistance ranges.
In other words, it seems likely to act as a volume profile range.
Therefore, in order to break through this section upward, I think the point to watch is whether it can rise with support near the Fibonacci ratios of 1.618 (89126.41) and 2.618 (134018.28).
Therefore, the maximum rising section in 2025 is expected to be the 3 (151166.97) ~ 3.14 (157451.83) section.
To do that, we need to look at whether it can rise with support near 2.618 (134018.28).
If it falls after the bull market in 2025, we don't know how far it will fall, but considering the previous decline, we expect it to fall by about -60% to -70%.
So, if the decline starts near the Fibonacci ratio 3.14 (157451.83), it seems likely that it will fall to around Fibonacci 0.618 (44234.54).
I will explain more details when the downtrend starts.
------------------------------------------------------

ETHUSDT Breakout & Retrace: Watching the $2,200 Buy Zone!Hey Traders,
In today's session, we're keeping a close eye on ETHUSDT for a potential buying opportunity around the $2,200 zone. After trending downward, Ethereum has successfully broken out of its downtrend and is now undergoing a correction. It’s currently approaching a key support/resistance area at $2,200, which could act as a strong retracement level.
As always, trade safe.
Joe

ETH 2000$📈 CRYPTOCAP:ETH Analysis – May 2, 2025
Ethereum is forming a bullish ascending triangle and reacting to the key resistance at 1812, possibly preparing for a breakout.
🔹 Resistances:
1812 USDT 🔼
1910 USDT 🎯
2000 USDT 🎯
🔹 Supports:
1728 USDT 🛡️
1680 USDT ⚠️
1484 USDT ⚠️

ETH to $2100 Looks like the bulls are starting to dominate again, traders! Ethereum has started to rise, Lips crossed the Jaw on Alligator, and AO confirms the bullish sentiment. On top is the Order Block, which acts as a magnet for the price.
BINANCE:ETHUSDT

$ETH Surprised $2.4K Price Mega Big pumping & touch to $3K ✨ CRYPTOCAP:ETH Surprised $2.4K Price Mega Big pumping & Trying to $3K Milestone again.
💫 From Breaking News:
• Ethereum Foundation Invests $32.65M in Ecosystem Growth
• Ethereum To Expand Network Capacity with Gas Limit Increase
Ethereum blockchain is preparing for a major upgrade that could make its network faster, cheaper, and more efficient. Developers have proposed raising the gas limit by 66% in a new development, from 36 million to 60 million units.
This change aims to improve the number of transactions the network can handle per block. This is to help users and developers enjoy smoother and more affordable activity on the blockchain.
Developer Says Testing Success Leads to Mainnet Rollout
Ethereum core developer Parithosh Jayanthi recently confirmed that the upgrade had passed early tests and is now ready for broader use. The new gas limit was successfully tested on the Sepolia and Holesky testnets. According to Jayanthi, the final rollout to Ethereum’s mainnet will begin shortly.
This is the second time Ethereum has raised its gas limit in 2025. The first increase happened in February, when the limit increased from 30 million to 36 million. These changes came after there hadn’t been any gas increase on the network since 2021.
#Write2Earn #ETH #BinanceSquareFamily #MarketRebound #SUBROOFFICIAL
Disclaimer: This article is for informational purposes only and does not constitute financial advice. Always conduct your own research before making any investment decisions. Digital asset prices are subject to high market risk and price volatility. The value of your investment may go down or up, and you may not get back the amount invested.

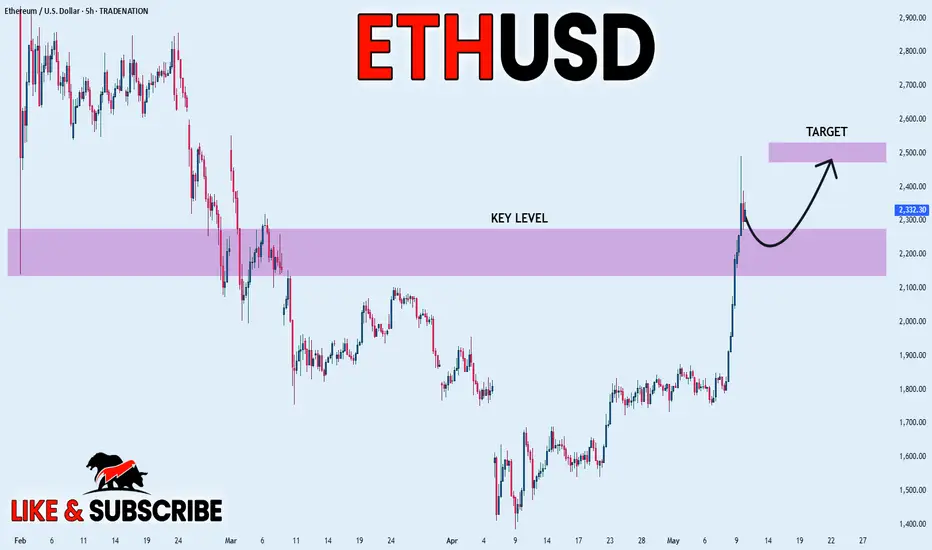
ETHEREUM BULLISH BREAKOUT|LONG|
✅ETHEREUM is growing finally
And the coin broke a key horizontal
Level of 2,200$ and the breakout
Is confirmed so we are bullish biased
And we will be expecting a
Further bullish move up
LONG🚀
✅Like and subscribe to never miss a new idea!✅
Disclosure: I am part of Trade Nation's Influencer program and receive a monthly fee for using their TradingView charts in my analysis.
ETH / BTC Breakout ConfirmedExpect ETH to lead Bitcoin in the near term as the trend has finally reversed on a HTF.
Hopefully this is a sign of a proper Alt season inbound...

Ethereum waking up?One of the most disappointing projects in the crypto space in recent years has to be ETH, losing ground on BTC since September '22. Finally ETH looks to have woken up outpacing BTC this week and broken out from the daily downtrend channel and currently at the underside of the DAILY 200 EMA.
BTC.D has printed a SFP and dropped 2% from 65.4% to 63%, could we be seeing a rollover and rotation into altcoins?
How I see it the moving average should cap off this move for now and a retrace towards the breakout area & previous lower high. That would then be the first higher high and higher low of this calendar year, a very bullish change in structure.
A more aggressive bullish scenario in the short term would be a reclaim of the 1D 200 EMA, leaving the inefficiency zone at the breakout level unfilled.
Either way the next HTF target is $2,800 for ETH which would bring price to the range midpoint and a key supply zone with many resting Stop losses.

ethusd 1400 EOY then bull run to ATH 4500Huge Triangle pattern of ethereum.
If 1400 till end of year will hold could be as simple as in 2023 the start of bull run in 2026 to new ATH at 4500

ETH vs USDT Crypto Heist - Bullish Breakout Plan!🔥 Thief Trading Style: ETH/USD Bullish Heist Plan 🔥
Dear Money Makers & Market Robbers 🤑,
Ready to pull off a master heist in the Ethereum vs. U.S. Dollar (ETH/USD) crypto market? 📈 Using Thief Trading Style’s technical and fundamental analysis, here’s our strategic plan to ride the bullish wave and escape near the dangerous MA zone. Follow the chart, stick to the plan, and let’s secure those profits! 💪🎯
---
📊 Trade Setup: The Heist Blueprint
- Market: ETH/USD (Crypto) 🌐
- Bias: Bullish Breakout 🌟
- Timeframe: 1D (Swing Trade) ⏰
Entry 📈:
- Breakout Entry: Wait for a confirmed breakout above the Moving Average (MA) at 2500. Set Buy Stop orders just above 2500 to catch the momentum. 🚀
- Pullback Entry: For safer entries, place Buy Limit orders at the most recent 15M/30M swing low (e.g., 2450-2475) for pullback opportunities. 📍
- Pro Tip: Set an alert on TradingView for the 2500 breakout to never miss the move! 🔔
Stop Loss 🛑:
- Breakout Traders: Place your Stop Loss below the recent 1D swing low at 2000 after the breakout confirms. This protects against false moves. ⚠️
- Pullback Traders: Adjust Stop Loss based on your risk tolerance (e.g., 1-2% of account per trade). Use lot size and multiple orders wisely. 📏
- Risk Warning: This is a high-risk heist! Manage your position size and stick to your risk plan. 🔥
Target 🎯:
- Aim for 2900 (near the dangerous MA zone, a risky overbought level with potential consolidation or reversal). 🏴☠️
- Escape Plan: Consider taking profits early if bearish signals (e.g., reversal patterns, high volume) appear near 2900. 💸
Scalpers 👀:
- Focus on Long-side scalps using tight trailing stops. Join swing traders for the full heist or scalp quick moves with high leverage (if your capital allows). 💰
---
📡 Why This Heist Could Work
The ETH/USD market is currently neutral with bullish potential, driven by:
- Technical Signals: Breakout above the 2500 MA signals strong bullish momentum, supported by higher lows on the 1D chart. 📊
- Fundamentals: Positive sentiment in crypto markets, fueled by macroeconomic trends and institutional interest (check COT reports for positioning). 📰
- Seasonal Factors: Crypto often sees Q2 bullish runs, aligning with our setup. 📅
- Intermarket Analysis: Bitcoin’s strength and USD weakness could propel ETH higher. 🌎
For deeper insights, review COT Reports, Geopolitical News, and Sentiment Analysis on platforms like Bloomberg or Cointelegraph. 🔗
---
⚠️ Risk Management: Protect Your Loot
- News Alerts: Avoid new trades during high-impact news (e.g., FOMC, CPI releases) to dodge volatility spikes. 🗞️
- Trailing Stops: Use trailing Stop Loss to lock in profits as price approaches 2900. 🔒
- Position Sizing: Never risk more than 1-2% of your account per trade. Stay disciplined! 🚨
---
💥 Boost the Heist! 💥
Support our Thief Trading Style by liking, commenting, and following for more high-octane trade plans! 🚀 Every boost strengthens our robbery crew, helping us conquer the markets together. 🤝 Let’s make money with ease and style! 🏆🎉

Careful with your Crypto BuysWinter is comming
A retracement 2ullback is comming
levels in the chart, nothing goes up forever

ETH Breakout and potential bullishness expected for a monthETH has broken out from downtrend and market sentiment has turned bullish overall. So it is expected to go up until it reaches 4000$ (70%) where a long term resistance is found.
Any further bullishness post 4000$ depends on future market conditions and price action at that point of time, as it is a long term resistance which would be more difficult to break.
Fibonacci retracement is used to find potential temporary selloffs in this up move. This move could potentially end the medium term bearish sentiments in ALT Coins.
Note: For educational purposes only. DYOR before investing or trading.


ETH : What the Options Are Saying (Hint: Big Move Ahead)Right now, Ethereum’s key players are positioning themselves to make some money on the rise.
And guess what? The market's already whispering where it’s headed next — but only if you know how to listen. And the loudest voice right now? Options flow on Deribit.
Let me break it down for you…
---
We caught some serious heat in the options pit lately. On Deribit, someone — or maybe a few someones — started stacking **Call options on ETH at 1,800 and 2,200 strike prices**, all under one portfolio. That’s not random. That’s a classic **Call Spread** setup, expiring June 27, 2025.
Translation? Someone’s betting hard on ETH heading north — straight toward **$2,200**.
But here's where it gets spicy. The **Max pain** for this contract sits right at **$2,000** — currently above spot price. Yeah, we’ve seen mixed stats on whether "price gravitates" to max pain like magic. But from experience? Right before expiry, price tends to *flirt* with that level.
So here's our read:
- There's **bullish sentiment** building.
- Eyes are locked on the **$2,200 zone** — likely within the next **30–50 days**.
- BTC’s playing the same game — big interest around **$100K–$110K strikes**, same expiry.
This isn’t noise. This is signal.
---
If you're tired of FOMO and want to catch the real setups before they blow up — follow. We turn complex flows into simple edge. Just actionable insights.
---
📈 *Trade smart. Stay sharp.
Join the crew that reads the market — not the hype.

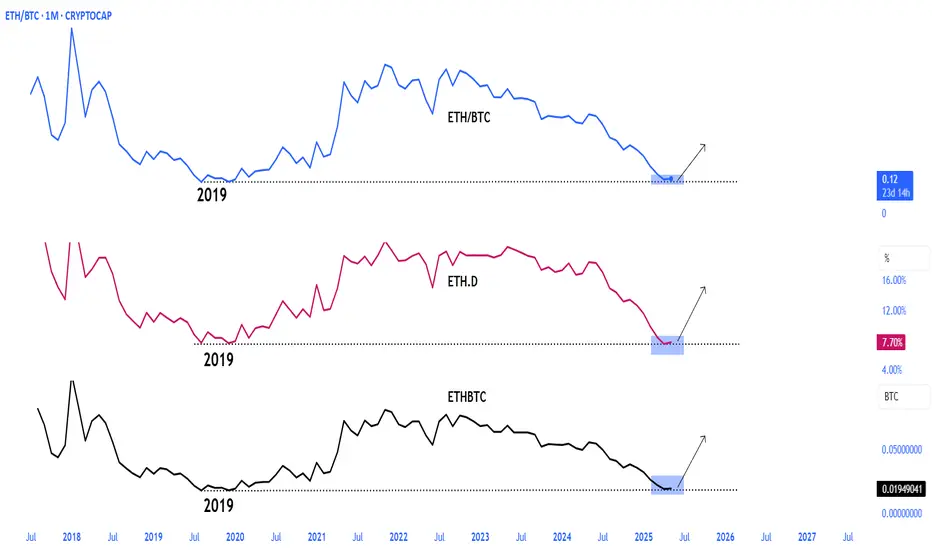
Watching ETHBTC for a Double Bottom (Hidden Bullish Divergence)Introduction
We are in the initial stages of seeing if ETH can set a "higher low" double bottom on the monthly chart. The first low was set September 2019 so this has been a multi year pattern. It might be playing out over several crpyot cycles to completion.
Simple Price Analysis
For a valid double bottom we want the lows within 10% of each other. The first low is about 8% below this second low so we are definitely within tolerance. We can also see that price is currently bouncing off top of the previous monthly bottoming structure until price moved to between the 0.618 level and created a double top (which I covered extensively in the linked idea.
In the chart below we can see a similar pattern with bitcoin after the C19 crash. The low wasn't textbook, the first low being 18% lower than the second low. Thats fine. The most important think is that price set a higher low.
Targeting off the fib draw is still the same. Looking for the 1.618 level. So I am watching to see eth hit a 27x against bitcoin from here
Indicators
Normal Divergence (Trend Reversal)
Bearish: Higher highs on price action but lower highs on the indicator
Bullish: Lower lows on price action but higher lows on the indicator
Hidden (Trend Continuation)
Bearish: Lower high on the price action and higher highs on the indicator
Bullish: Higher low on the price action and a lower low on the indicator
If you look at the primer we are looking for the main trend to continue. And that is up.
Battle Plan
In my linked idea I made it clear I was staying out of eth until I saw bullish divergence. Not just eth, but everything in the eth ecosystem. Now EHTBC provisionally bullish its time to look at the ETH ecosystem again. While ETHBTC looked bearish I didn't even bother to analyze tokens against eth, only BTC.
Now I am going to be analyzing coins bullishness against eth. If I don't think it will outperform eth I don't buy it. And generally, I hope to be buying bull backs. Here is a great opportunity for a SUI buy when compared against eth on the 4h chart.
Wish me luck.
Linked Idea

ETH Surges 20% Post-Pectra: Crypto's Ultimate Comeback?Ether Clocks 'Insane' 20% Candle Post-Pectra — A Turning Point?
The cryptocurrency market witnessed a remarkable event as Ethereum (ETH) surged by an impressive 20% following the successful implementation of the Pectra hard fork. This dramatic price movement has caught the attention of traders, investors, and analysts alike, sparking intense debate about whether this represents a genuine turning point for the second-largest cryptocurrency by market capitalization or merely a temporary respite in a challenging market environment.
The Pectra Catalyst
The Pectra hard fork, representing one of Ethereum's most significant technical upgrades since its transition to proof-of-stake, was successfully implemented in early 2025. This upgrade introduced crucial improvements to the Ethereum network, including enhanced transaction processing efficiency, reduced gas fees, and expanded smart contract functionality.
Unlike previous upgrades that sometimes resulted in "buy the rumor, sell the news" reactions, Pectra's implementation appears to have triggered substantial positive price action. The 20% candle marked Ethereum's largest single-day gain in over 18 months, propelling ETH past the crucial $1,900 resistance level that had previously acted as a ceiling for price movements.
The timing of the upgrade coincided with increasing institutional interest in Ethereum, creating perfect conditions for a significant price movement. Data from on-chain analytics platforms indicates that large wallet addresses began accumulating ETH in the weeks leading up to Pectra, suggesting informed capital was positioning ahead of the technical catalyst.
Institutional Buying Signals
On-chain metrics reveal compelling evidence of institutional participation in Ethereum's recent surge. Blockchain analytics firm Glassnode reported a substantial increase in large-value transactions exceeding $1 million in the 72 hours surrounding the Pectra implementation, with transaction volume reaching levels not seen since late 2023.
Several key metrics support this institutional narrative:
1. Exchange outflows have accelerated, with over 200,000 ETH leaving centralized exchanges in a single 48-hour period post-Pectra, indicating buyers intend to hold rather than trade.
2. The number of addresses holding more than 1,000 ETH increased by 2.8% in just one week, representing substantial accumulation by wealthy entities.
3. Futures open interest has expanded by over $2 billion since the Pectra announcement, demonstrating increased leveraged positioning.
4. Options markets show a significant skew toward calls, with the put/call ratio reaching its lowest level in 14 months.
These metrics collectively suggest that smart money sees the Pectra upgrade as a legitimate inflection point for Ethereum rather than a temporary technical bounce.
The Long Position Explosion
Perhaps most intriguing is the dramatic increase in long positions across various trading platforms. Data from cryptocurrency derivatives exchanges shows that long-to-short ratios have reached levels not seen since Ethereum's previous major bull run in 2021.
This positioning dynamic creates an interesting technical setup where further price increases could trigger a positive feedback loop as short sellers are forced to cover their positions, potentially accelerating ETH's upward movement.
Retail Sell-Off vs. Whale Accumulation
A fascinating dynamic has emerged in Ethereum's market structure: while retail investors appear to be reducing exposure, larger entities ("whales") are aggressively accumulating. This divergence in behavior between market participants has created an unusual tension in ETH's price action.
Blockchain analytics firm Santiment reported that addresses holding between 0.1 and 10 ETH have decreased their collective holdings by approximately 3% over the past month, indicating retail profit-taking or repositioning. Simultaneously, addresses holding over 1,000 ETH have increased their positions by nearly 7%.
This pattern often emerges during major market transitions, where retail participants, scarred by previous drawdowns, remain skeptical of recovery signals while institutional investors position for longer-term trends based on fundamental catalysts.
This dynamic creates an interesting market structure where future price movements may depend on which cohort ultimately proves correct in their assessment of Ethereum's prospects.
Technical Breakout Analysis
From a technical analysis perspective, Ethereum's 20% surge represents a significant breakout from multiple resistance levels that had contained price action for months. The move pushed ETH decisively above its 200-day moving average, a key indicator watched by trend-following traders.
The volume profile accompanying the move also supports the legitimacy of the breakout, with transaction volume reaching its highest level in nine months. This high-volume breakout typically indicates strong conviction behind the price movement rather than a technical fake-out.
Additionally, the Relative Strength Index (RSI), while showing overbought conditions in the short term, has broken out of a long-term downtrend on higher timeframes, suggesting potential for sustained momentum despite possible near-term consolidation.
Macro Context and Ethereum's Narrative Shift
Ethereum's dramatic move occurs against a complex macroeconomic backdrop that had previously contributed to crypto market weakness. Recent signals of potential monetary policy shifts, including discussions of rate cuts by central banks, have created a more favorable environment for risk assets broadly.
Beyond pure price action, Ethereum's narrative has evolved considerably in recent months. After facing criticism regarding high transaction fees and scaling limitations, the successful implementation of Pectra addresses several key concerns that had dampened enthusiasm for the network.
The upgrade's focus on reducing gas fees and improving transaction throughput directly counters the competitive threats from alternative Layer 1 and Layer 2 solutions that had been gaining traction by positioning themselves as more efficient alternatives to Ethereum.
This narrative rehabilitation, combined with Ethereum's established network effects and developer ecosystem, creates compelling fundamental support for the recent price action.
Sustainability Questions and Potential Challenges
While enthusiasm surrounding Ethereum's post-Pectra surge runs high, significant questions remain regarding the sustainability of this momentum. Several potential challenges could impact ETH's trajectory in the coming months:
1. Technical Overextension: The speed and magnitude of the 20% move have pushed short-term technical indicators into overbought territory, potentially setting up conditions for a correctional pullback.
2. Regulatory Uncertainty: The evolving regulatory landscape for cryptocurrencies, particularly regarding potential security classifications and staking activities, continues to create background uncertainty for Ethereum.
3. Competitive Pressures: Despite Pectra's improvements, alternative blockchains continue to innovate rapidly, potentially challenging Ethereum's dominance in specific use cases.
4. Macro Reversal Risk: Any shift back toward hawkish monetary policy could negatively impact risk assets broadly, potentially including Ethereum despite its technological progress.
5. Execution Risk: While Pectra's implementation was successful, future technical upgrades still carry execution risk that could impact market confidence.
Conclusion: A Genuine Turning Point?
As market participants attempt to determine whether Ethereum's "insane" 20% candle represents a genuine turning point or a temporary deviation, the weight of evidence increasingly suggests this could indeed mark a significant inflection point in ETH's market cycle.
The confluence of technical breakouts, on-chain accumulation signals, derivative positioning, and fundamental improvements through the Pectra upgrade creates a compelling case for sustained momentum. The divergence between retail selling and institutional accumulation further supports the notion that a meaningful market transition may be underway.
However, sustainable price appreciation will likely require continued technical execution, expanding adoption metrics, and at minimum, a neutral macro environment that doesn't actively handicap risk assets.
For investors and traders, the coming weeks will be crucial in determining whether Ethereum can build upon this momentum or if the surge represents another false dawn in a challenging market. But regardless of short-term price action, the successful implementation of Pectra unquestionably strengthens Ethereum's long-term value proposition as a leading blockchain infrastructure platform.

$ETH just woke up. +30% in 2 days. Straight through resistance.Ethereum just woke up.
+30% in 2 days. Straight through resistance.
Reclaimed EMAs. Volume explosion.
Next stop? $2.6K+ if this momentum holds. Altcoin rotation may have just started.

Ethereum Future: Limited Upside Ahead?Ethereum price dropped roughly 25% since April 2 due to an overall market crash following Trump’s tariffs implementation.
Compared to the almost 40% drop back in February after the first tariff announcement, this time the correction wasn’t as harsh or brutal.
So what can we expect next from Ethereum in the coming weeks?
The main hope for ETH price remains the upcoming Pectra upgrade.
Historically, major Ethereum upgrades have acted as bullish catalysts — for example, ETH roughly doubled in price ahead of both the Merge and the Shanghai upgrade.
If history rhymes, we could see a similar pre-upgrade pump this time too.
However, even if that rally materializes, I expect it to be limited to the $3,000–$3,400 range. The market lacks the kind of momentum or macro tailwinds needed to push ETH beyond 4k in this cycle — unless there’s a major shift in sentiment.
Overall, I remain cautious. The broader crypto market seems to be rolling over, and Ethereum hasn't even reclaimed its ATH.
With the next bear cycle approaching, long-term bullish targets might need to be revised — at least for now.
Short-term bounce possible thanks to Pectra hype, but don’t expect miracles. ETH likely capped below 3.4k unless something big changes.

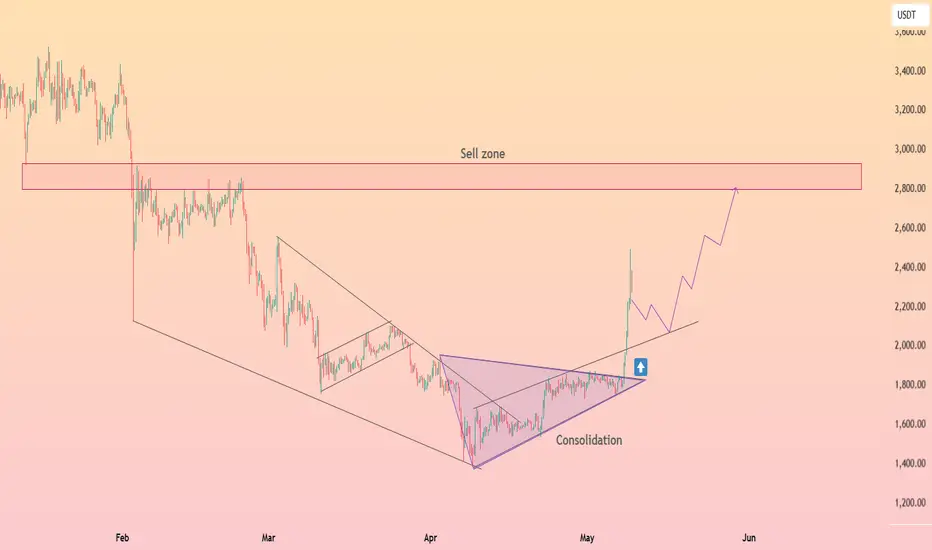
HolderStat┆ETHUSD breakout toward key resistanceAfter weeks of consolidation inside a symmetrical triangle, ETH has confirmed a bullish breakout with strong momentum. Price is now aiming for the $2800–$3000 sell zone, a key level from previous distribution. The breakout suggests increased buying pressure and a potential mid-term rally continuation.
💡 If ETH holds above the $1800 breakout zone, we could see a gradual climb toward $2800 in the coming weeks.