ETH Investors Are Confused, But the Algorithm Says $40K's Coming🚨 Ethereum: Confusion or Opportunity?
Many investors are currently confused — wondering whether Ethereum (ETH) is due for a deeper retracement… or if it’s about to skyrocket. So, what’s really going on?
According to our algorithmic model, ETH confirmed a long-term price target of $40,000 the moment it broke above $3,594 on March 11, 2024.
The pullback that followed?
It’s not a sign of weakness — it’s a golden entry opportunity for the next leg up with a garenteed x15 ROI from actual prices.
📉 The $883 low is considered a protected low, and according to our structure, it will likely remain untouched until ETH reaches $40,000.
💰 Why We’re Heavily Exposed to ETH
Given the current market conditions, we’ve allocated the majority of our capital to Ethereum, as it currently represents one of the most secure and promising assets in the crypto space for mid- to long-term positioning.
This isn’t just a trade — it’s a strategic investment.
🚀 Happy Trading,
Ethereum (Cryptocurrency)

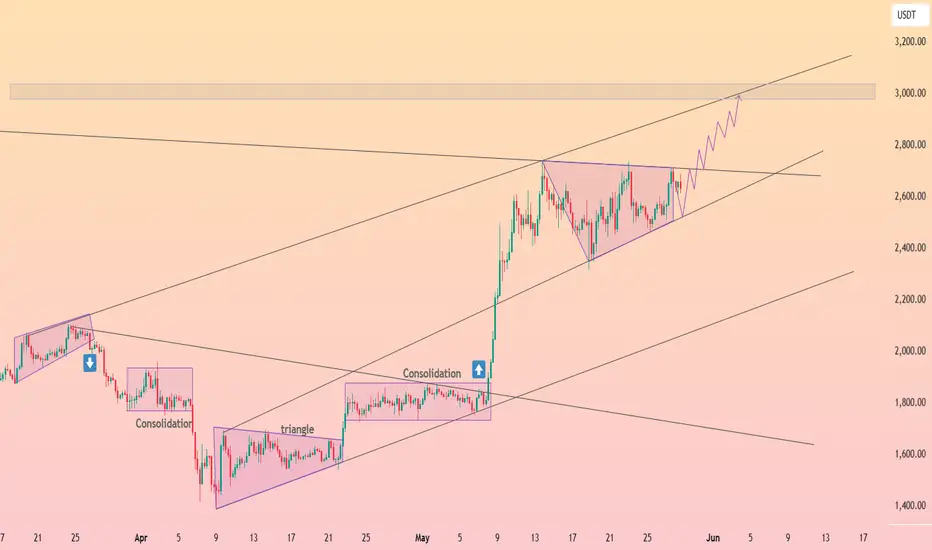
ETHUSD INTRADAY coiling consolidation pattern resistance at 2,75Trend Overview:
Ethereum (ETH/USD) remains in a bullish trend, underpinned by a sequence of higher lows and a well-defined rising structure. Recent intraday price action reflects a consolidation phase, likely forming a bullish continuation pattern within the prevailing uptrend.
Key Technical Levels:
Support: 2,360 (primary), followed by 2,160 and 2,090
Resistance: 2,750 (initial), then 2,930 and 3,130
Technical Outlook:
A corrective pullback toward 2,360, which aligns with a prior consolidation zone, may offer a buy-the-dip opportunity. A successful retest of this level could set the stage for a continuation toward 2,750, 2,930, and 3,130 over the medium to long term.
However, a confirmed break and daily close below 2,360 would invalidate the near-term bullish outlook, increasing the risk of a deeper correction toward 2,160 and 2,090.
Conclusion:
ETH/USD continues to show bullish momentum as long as it holds above the 2,360 support level. A rebound from this zone would likely confirm the ongoing consolidation as a base for further upside. A breakdown below 2,360, however, would shift the short-term bias bearish, exposing Ethereum to deeper downside risk.
This communication is for informational purposes only and should not be viewed as any form of recommendation as to a particular course of action or as investment advice. It is not intended as an offer or solicitation for the purchase or sale of any financial instrument or as an official confirmation of any transaction. Opinions, estimates and assumptions expressed herein are made as of the date of this communication and are subject to change without notice. This communication has been prepared based upon information, including market prices, data and other information, believed to be reliable; however, Trade Nation does not warrant its completeness or accuracy. All market prices and market data contained in or attached to this communication are indicative and subject to change without notice.

Ethereum @ 20M MAEthereum on monthly time frame has reached to the 20MA & the 61% of Fibonacci. Because of April hammer candle & May 50% raise candle, we might see June close above $3200 and a rally after that to about $8000.

Is Ethereum set to fire up ?Ethereum has been consolidating for the past 2 weeks between 2300 and 2700.
Upside resistance at 2700-2750 levels puts pressure on short-term prices.
A convincing close above the 2750 level triggers fresh upside in the short term, leading to a retesting of 3300 as an Initial target. Risk is defined at 2300. A close below this level will negate the bullish view.

ETH | New ATH on the cards | Fibonacci $7K TARGET Ethereum is gearing up towards the upside and we're seeing another resistance zone being crushed.
While BTC is trading sideways, we can expect ETH to play catch-up:
Don't miss yesterday's update on DOT:
_____________________________

HolderStat┆ETHUSDCRYPTOCAP:ETH momentum check: After breaking consolidation, Ethereum rides an ascending wedge, clinging to support while eyeing the 3000 supply band overhead. Earlier triangle pops hint bulls may punch resistance. Chart bias and TA remain constructive.
Ethereum is Approaching a Key Support!Hey Traders, in today's trading session we are monitoring ETH/USDT for a buying opportunity around 2,650 zone, Ethereum is trading in an uptrend and currently is in a correction phase in which it is approaching the trend at 2,650 support and resistance area.
Trade safe, Joe.

Ethereum = MySpace of Crypto?I have been watching COINBASE:ETHUSD flirt with 2750 for the better part of May as all crypto has gone "risk on" with Bitcoin's All-Time-High push. This level is the 50% Retracement of the last major high in December 2024 to the low of April 2025. There is also significant Volume Profile Resistance from February matching this price action level. This level is good for a short and can even be managed with tight risk given the clear price structure at this level.
Normally I am a pure technical trader but I have a bearish fundamental bias on Ethereum...
Fundamentals:
Ethereum is dying. I know that may be unpopular to say but it is losing "network effect."
Ethereum used to be the standard for the smart contract use case of cryptocurrency but it is being replaced by competition namely Solana. I ask, "what does Ethereum do that Solana does not do cheaper/faster/better?" Even the President of the United States used Solana to create his scam meme coin. Value judgements aside the use case of smart contracts to create new tokens has proven to be popular and the market has chosen which chain to create them. It was no longer Ethereum.
The best analogy to Ethereum's fall from dominance would be to look back at social media companies like MySpace. At some inflection point for various reasons users choose to leave a platform for another. That is network effect and unfortunately for Ethereum it has already begun to lose it.

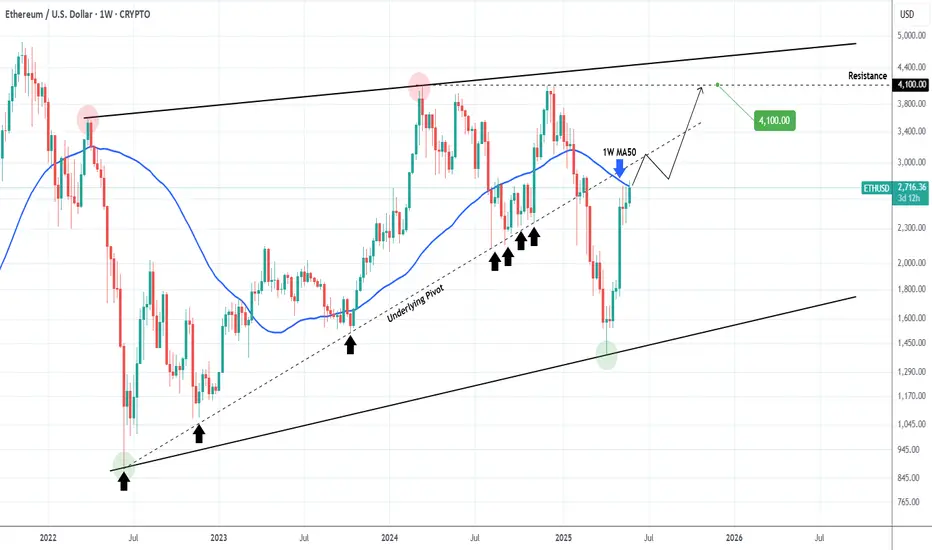
ETHEREUM Break above this level and things get real interesting!Ethereum (ETHUSD) broke above its 1W MA50 (blue trend-line) this week and will attempt to close the week above it to confirm the official restoration of the long-term bullish trend.
Regardless of that, there is another hidden trend-line that may dictate the pace of that potential bullish break-out and is no other than the underlying Pivot trend-line that started on the June 13 2022 market bottom and acted as Higher Lows up until February's Tariff fueled correction.
As a result, this is now posing as a Resistance and a break above it should technically deliver rallies similar to the Bullish Legs of 2023 - 2024.
Our 4100 Target remains intact.
-------------------------------------------------------------------------------
** Please LIKE 👍, FOLLOW ✅, SHARE 🙌 and COMMENT ✍ if you enjoy this idea! Also share your ideas and charts in the comments section below! This is best way to keep it relevant, support us, keep the content here free and allow the idea to reach as many people as possible. **
-------------------------------------------------------------------------------
💸💸💸💸💸💸
👇 👇 👇 👇 👇 👇
TON/USDT on Fire: Bullish Momentum Builds Toward Major Targets!By examining the #TONCOIN chart on the 3-day timeframe, we can see that after correcting down to $3, the price has started pumping again and is showing strong bullish momentum. So far, it has gained over 15%, and I expect this uptrend to continue! The next targets are $3.64, $4.20, and $4.66. The expected return is around 20% in the short term, 40% to 55% in the medium term, and 110% in the long term. Support this analysis and stay tuned for more updates, my friends!
Please support me with your likes and comments to motivate me to share more analysis with you and share your opinion about the possible trend of this chart with me !
Best Regards , Arman Shaban

Ethereum - Expecting Bullish Continuation In The Short TermH1 - We have a clean bullish trend with the price creating a series of higher highs, higher lows structure.
This strong bullish momentum is followed by a pullback.
No opposite signs.
Until the two Fibonacci support zones hold I expect the price to move higher further.
If you enjoy this idea, don’t forget to LIKE 👍, FOLLOW ✅, SHARE 🙌, and COMMENT ✍! Drop your thoughts and charts below to keep the discussion going. Your support helps keep this content free and reach more people! 🚀
--------------------------------------------------------------------------------------------------------------------
Disclosure: I am part of Trade Nation's Influencer program and receive a monthly fee for using their TradingView charts in my analysis.

ETHBTC AnalysisETHEREUM chart against BITCOIN is still playing inside wave B of this ABC pattern and still needs to cool off before it make the final big move.
We have highlighted two possible scenarios . Let's see how it goes.

Ethereum Tests Triangle Resistance Amid Positive NewsflowEthereum is attempting to break out of an ascending triangle, supported by the recent U.S. tariff court ruling that came just hours ago. The 2740–2756 zone remains key, and despite a brief spike above, resistance is still holding. If a breakout is confirmed, the next major target lies at 3075. To reach that level, a new trend channel may form, potentially running parallel to the triangle’s lower line.
While Ethereum is benefiting from both the court decision and Nvidia’s strong earnings, the bullish momentum from the ruling may not last long. Therefore, Ether bulls should be cautious with leveraged long positions despite the favorable technical setup.

ETHUSDTEither from the current price or from the price of 2653.06, the areas worth buying are at $2852, in either case the price will reach 2852. BINANCE:ETHUSDT

Potential ETH IH&S Continuation (4H)BINANCE:ETHUSDT might be forming an Inverse Head & Shoulders on the 4H chart.
• A right shoulder around ~$2400 would complete the pattern
• Confirmation comes with a breakout above the $2730 neckline
• Measured move target: ~$3130
Keep an eye on ~$2800 – it's a key daily/weekly S/R that could provide strong resistance and possibly stall the breakout.
In a No-Trade Zone until either a bounce from $2400 or a break above $2730.

#ETH/USDT#ETH
The price is moving within a descending channel on the 1-hour frame, adhering well to it, and is heading for a strong breakout and retest.
We are seeing a bounce from the lower boundary of the descending channel, which is support at 2465.
We have a downtrend on the RSI indicator that is about to break and retest, supporting the upward trend.
We are looking for stability above the 100 moving average.
Entry price: 2558
First target: 2640
Second target: 2702
Third target: 2768

ETH NEW UPDATE (12H)This analysis is an update of the analysis you see in the "Related publications" section
This analysis is still valid.
Ethereum has a liquidity pool above the chart, and just behind that pool, there is a fresh order block.
After sweeping the liquidity pool and hitting this order block, the price is expected to drop toward the flip zone.
For risk management, please don't forget stop loss and capital management
When we reach the first target, save some profit and then change the stop to entry
Comment if you have any questions
Thank You

ETH/USDT Trade Setup: Bullish Trend, Entry Zone & More🚀 ETH/USDT Trade Setup 💸📊
Keeping a close eye on Ethereum paired with USDT right now. 🔍📈
ETH has been holding a solid bullish trend, with healthy pullbacks into value zones that have repeatedly offered discounted long entries. 🛒⚡
I’m bullish overall, looking to trade with the trend. Looking for ETH to dip into my preferred entry zone. 🎯
🛡️ Stop-loss to go just beneath the most recent swing low to keep risk tight and controlled.
In this video, I cover:
🔹 How I apply Fibonacci tools to dial in my entry points and targets
🔹 My full ETH game plan, including the zones I'm watching and how I’m managing this setup
⚠️ Not financial advice. Always do your own due diligence and risk management.
💬 Are you trading ETH right now? What are your thoughts? Let me know in the comments below! 👇🔥

Ethereum Ethereum has rebounded significantly and needs a short respite. We are currently trading at a strong resistance level and experiencing strong selling pressure at the 2700 area. The correction will end at 2435/2335.

Ethereum 8X Leveraged Trade OpportunityIf you want to make it big really fast, there is still one last chance to get ETHUSDT with a great entry price and high lev.
The chart setup is good. The market is good and everything is great.
Market conditions are only improving and the Altcoins are starting to heat up.
Right now, you see $1,600 but tomorrow the price can be $1,800 or more, that's how the Altcoins work. One day everything is quiet, the next day everything blows up. By the time the action is in, it is too late to buy, but not now, there is still one final chance to get bottom prices before the 2025 bull market shows up in full force.
Here is Ethereum, ETHUSDT, a great chart setup. Once the breakout happens, it will never trade at this price ever again. This is the last chance. It is yours to take.
Thanks a lot for your continued support.
I am wishing you profits, health, wealth and success.
You are appreciated, always, and you deserve the best.
Namaste.

Ethereum 6X Lev. Full PREMIUM Trade-Numbers —2nd Entry—PP: 1806%This is a second entry for a long-term leveraged chart setup for ETHUSDT (Ether).
This is truly the last chance to get Ethereum at low prices before a major bullish impulse, the biggest one in a long time.
The chart structure is perfect. The low conditions look very similar to June 2022, very similar.
We have long-term higher lows blah blah blah... By now, you already know all these things as I read this chart a million times.
I don't have much to say other than remain calm, whatever happens. Sleep easy because Crypto is going up. It is as simple as that. It will grow, soon.
Full trade-numbers below:
_____
LONG ETHUSDT
Leverage: 6X
Entry levels:
1) $1,900
2) $1,825
3) $1,630
Targets:
1) $2,125
2) $2,405
3) $3,347
4) $4,017
5) $4,871
6) $6,000
7) $7,337
Stop-loss:
Close weekly below $1,600
Potential profits: 1806%
Capital allocation: 3%
_____
I would like to thank you again for reading. Your support is appreciated.
I know it is a lot of content but this is meant for many different people all across the world.
If you like what you see make sure to follow.
If you want to see more, leave a comment and boost to show your support.
This is the big one.
Namaste.

ETHUSD - Consolidation Zone Analysis | Watch $2700 Breakout📊 Ethereum (ETHUSD) is currently trading within a consolidation zone between key support at $2458 and resistance near $2720 on the 1H timeframe.
🔹 Breakout above $2700 could indicate potential bullish momentum continuation.
🔻 Breakdown below $2450 may suggest bearish sentiment gaining control.
The price has been moving sideways, showing indecision and reduced volatility. Traders often monitor such range-bound phases for potential breakout opportunities in either direction.
⚠ This chart is for educational and analytical purposes only. It is not financial advice. Always do your own research and risk management.
---
🔖 Key Levels:
• Resistance: $2720
• Support: $2458
• Bearish zone under: $2500
#ETHUSD #Ethereum #CryptoAnalysis #TechnicalAnalysis #TradingView #PriceAction

Your are not Bullish enough on ETHExperts foresee Ethereum’s future mirroring that of early Amazon and Microsoft, predicting significant growth.
Analysts draw parallels between Ethereum (ETH) and major tech companies such as Amazon and Tesla, indicating that it could be a high-growth asset moving forward.
Even though ETH has experienced a recent decline, several analysts point out the increasing interest from institutional investors, with substantial holders actively accumulating.
The long-term prospects of Ethereum are linked to its innovative capabilities and established reputation, with its security-oriented strategy echoing Amazon’s approach to growth.
The analyst pointed out that this is a pivotal moment to "front-run" Ethereum's potential supremacy in the blockchain arena. He emphasized that Ethereum is set apart by its ongoing innovation; however, instead of focusing on immediate user expansion, the network has prioritized security. This dedication to dependability has established Ethereum as the most reliable settlement layer in the sector.
Please refrain from analyzing ETH as if it were Procter & Gamble. Acquiring ETH is more akin to investing in a high-growth stock like AMZN, MSFT, or TSLA from decades past.
Ethereum's approach to enhancing the dominance of the EVM could be compared to Amazon.
This chart comparing ETH prices to Tesla's stock price indicates a parallel trend of growth and dominance.
Make no mistake, I am quite optimistic about Tesla's prospects through 2030.
But this ongoing head and shoulders pattern implies that as we move into the Crypto Banana zone, ETH will accelerate and potentially surpass Tesla's market cap.
