ETH - Consolidating before a major breakout!About a week ago, Ethereum (ETH) saw a strong upward move, pushing the price up with notable momentum. Since then, it has entered a period of consolidation, trading within a tight range as the market awaits the next decisive move.
-------------------------------
Which Direction Will ETH Break?
After such a strong rally, this kind of consolidation is normal. It could signal a continuation to the upside, especially if this is part of a broader relief rally. However, it's important to note that during the rapid move up, ETH left behind a 4h Fair Value Gap (FVG), which may attract price back down for a potential fill in the event of a breakdown.
-------------------------------
Stochastic RSI insight
On the daily chart, the Stochastic RSI remains in the overbought zone. Historically, when this indicator lingers in such territory, ETH has seen notable pullbacks. This could be an early sign that a downward move is more likely unless momentum changes soon.
-------------------------------
ETH vs. the 50-Day Moving Average
ETH is currently struggling with the 50-day Moving Average (MA), trading just below this key resistance level. As long as ETH remains under the 50-day MA, bearish pressure could continue. However, a reclaim and sustained hold above this level would likely indicate a shift toward bullish momentum.
-------------------------------
My Outlook
This range is tricky to trade, and a breakout in either direction is possible. Personally, I think there's a chance ETH could sweep the recent highs before a larger move down. The overbought Stochastic RSI and resistance at the 50-day MA both suggest that the rally might be losing steam in the short term.
-------------------------------
Thanks for your support.
- Make sure to follow me so you don't miss out on the next analysis!
- Drop a like and leave a comment!
Ethereum (Cryptocurrency)
ALERT: ALT SEASON INCOMING? 🚨 ALERT: ALT SEASON INCOMING? 🚨
Take a close look at the BTC/ETH chart — we’re seeing early signs of a major rotation out of Bitcoin and into Ethereum and altcoins. Historically, when the BTC/ETH ratio starts to fall, it's a clear signal that capital is flowing into altcoins, marking the beginning of alt season.
🔍 The ratio is showing bearish divergence and approaching a key support zone. If this level breaks, ETH is likely to outperform BTC significantly — and we all know what follows: altcoins explode.
📉 BTC dominance is stalling, ETH gaining strength, and altcoins are waking up. The market is shifting. Don't get caught late.
🚀 Get ready. The alt season might just be starting now.
#AltSeason #Crypto #BTC #ETH #TradingView #CryptoTrends

Alt season is here ! I have done an analysis on ETHBTC vs BTCUSD which has consistently predicted the phases when altcoins do well. This is only when there's liquidity in the system and thus, even the broader stock market does very well.

Ethereum's $2k Crossroads: Squeeze Up or Crash Down?Ethereum at a Crossroads: Eyeing $2,000 Amidst Short Squeeze Hopes, Crash Warnings, and Existential Questions
Ethereum (ETH), the bedrock of decentralized finance (DeFi) and the engine behind countless non-fungible tokens (NFTs), finds itself ensnared in a complex web of conflicting market signals and divergent analyst opinions. On one hand, recent price action shows resilience, with ETH powering through previous resistance levels and setting its sights on the psychologically significant $2,000 mark. This move is potentially bolstered by intriguing on-chain data, such as declining supply on major exchanges like Binance, sparking whispers of an impending short squeeze. Yet, casting a long shadow over this optimism are stark warnings: technical analysts point to rare, potentially bearish patterns forming, prominent trading firms question its fundamental value proposition compared to Bitcoin (BTC), highlighting its staggering year-to-date losses, and some even provocatively label it more akin to a "memecoin."
This cacophony of bullish hopes and bearish alerts places Ethereum at a critical juncture. Is the recent surge the beginning of a sustained recovery, fueled by tightening supply and renewed developer activity? Or is it merely a deceptive bounce within a larger downtrend, vulnerable to a potential crash as underlying weaknesses and unfavorable comparisons to Bitcoin take hold? Dissecting these opposing narratives is crucial for understanding the intense battleground Ethereum's price chart has become.
The Bullish Ascent: Powering Through Resistance, Eyeing $2,000
The immediate catalyst for renewed optimism stems from Ethereum's recent price performance. After a period of consolidation and, at times, significant downward pressure, ETH has demonstrated notable strength. Headlines proclaiming "Ethereum Price Powers Through Resistance — Eyes on $2,000?" capture this sentiment. Breaking through previously established resistance levels (potentially building on support found around the $1,800 mark) is a technically significant event. It suggests buyers are stepping in with enough conviction to overcome selling pressure that had previously capped advances.
Successfully reclaiming and holding levels above former resistance transforms these zones into potential new support floors, providing a base for further upward movement. The $2,000 level looms large, not just as a round number, but often as a key area of historical price interaction – a zone where significant buying or selling interest has previously materialized. A decisive break above $2,000 could inject further confidence into the market, potentially attracting momentum traders and reinforcing the bullish narrative.
The Binance Supply Drop and Short Squeeze Speculation
Adding intrigue to the bullish case is the observation of declining Ether supply on major exchanges, specifically Binance. Exchange supply is a closely watched metric. When the amount of ETH held on exchanges decreases, it generally implies that investors are withdrawing their coins to private wallets, often for longer-term holding ("HODLing") or for use within the DeFi ecosystem (staking, lending, etc.). This reduction in readily available supply on exchanges can, in theory, create a tighter market.
This dynamic fuels speculation about a potential "short squeeze." A short squeeze occurs when the price of an asset starts to rise rapidly, forcing traders who had bet against it (short sellers) to buy back the asset to close their positions and cut their losses. This forced buying adds further upward pressure on the price, creating a rapid, cascading effect. If a significant number of traders have shorted ETH, anticipating further price declines, a sustained move upwards coupled with shrinking exchange supply could create the conditions for such a squeeze, dramatically accelerating the price towards and potentially beyond the $2,000 target. While short squeezes are relatively rare and difficult to predict accurately, the declining supply on a major platform like Binance certainly adds a compelling element to the bullish thesis.
Underlying Strengths: The Long-Term Vision
Beyond short-term price action and supply dynamics, Ethereum's bulls point to its fundamental strengths. The successful transition to Proof-of-Stake (PoS) via "The Merge" was a monumental technical achievement, drastically reducing the network's energy consumption and changing its tokenomics by potentially making ETH a deflationary asset under certain conditions (where more ETH is "burned" via transaction fees than is issued as staking rewards). Ongoing scalability upgrades, often referred to under the umbrella of Ethereum 2.0 developments (like proto-danksharding via EIP-4844), aim to reduce transaction fees and increase throughput, making the network more efficient and attractive for developers and users.
Ethereum remains the dominant platform for smart contracts, DeFi applications, and NFT marketplaces. Its vast developer community, established network effects, and continuous innovation pipeline are often cited as core long-term value drivers that short-term price volatility cannot erase. For believers in Ethereum's vision, the current price levels, even after the recent bounce, might represent an opportunity to accumulate an asset with significant future potential.
The Bearish Counter-Narrative: Red Alerts and Worrying Comparisons
However, the optimism is heavily tempered by significant bearish signals and critiques. This serves as a stark warning. Technical analysis involves studying chart patterns and indicators to forecast future price movements. While the specific "rare pattern" isn't detailed, the emergence of such signals often causes significant concern among traders. Patterns like head-and-shoulders tops, descending triangles, or bearish divergences on key indicators can suggest that upward momentum is waning and a significant price decline could be imminent. Such technical warnings cannot be easily dismissed, especially when they align with other concerning factors.
The Stark Reality: Underperformance and the "Memecoin" Jab
Perhaps the most damaging critique comes from the direct comparison with Bitcoin and the assessment of Ethereum's recent performance. A large year-to-date drop is a brutal statistic, especially when Bitcoin, while also volatile, may have fared comparatively better during the same period (depending on the exact timeframe and BTC's own fluctuations).
Why the "memecoin" comparison? Memecoins are typically characterized by extreme volatility, price movements driven largely by social media hype and sentiment rather than clear fundamental value, and a lack of a distinct, widely accepted use case beyond speculation. While some calling Ethereum a memecoin is hyperbolic – given its vast ecosystem and utility – the critique likely stems from its recent high volatility and its struggle to maintain value relative to Bitcoin. The trading firm's assertion that Ether's "risk-reward is now unjustifiable compared to Bitcoin" encapsulates this view. They likely argue that Bitcoin's clearer narrative as a potential store of value or "digital gold," potentially bolstered by institutional adoption via ETFs, offers a more compelling investment case with potentially less downside risk compared to Ethereum, which faces ongoing scalability challenges, competition from other Layer 1 blockchains, and perhaps greater regulatory uncertainty regarding its status (security vs. commodity).
This underperformance raises difficult questions. If Ethereum is the backbone of Web3, why has its price struggled so much relative to its peers or even its own potential? Possible contributing factors include:
1. Capital Rotation: The excitement and capital inflows surrounding spot Bitcoin ETFs may have drawn investment away from Ethereum and other altcoins.
2. Regulatory Uncertainty: Ongoing debates, particularly in the US, about whether ETH should be classified as a security could be creating hesitancy among institutional investors.
3. Competition: Numerous alternative Layer 1 blockchains (Solana, Avalanche, etc.) are competing fiercely for developers and users, potentially fragmenting the market share Ethereum once dominated.
4. Post-Merge Narrative Shift: While technically successful, the immediate post-Merge price action was underwhelming for many, and the narrative focus may have shifted elsewhere.
Synthesizing the Dichotomy: A Market Divided
Ethereum's current situation is a textbook example of a market grappling with deeply conflicting data points and narratives.
• Bullish Signals: Price breaking resistance, targeting $2k, falling exchange supply, potential short squeeze, ongoing network development, strong ecosystem.
• Bearish Signals: Severe YTD underperformance, concerning technical patterns ("red alert"), critical comparisons to Bitcoin's risk/reward, being labeled "memecoin-like" by traders, regulatory overhang, Layer 1 competition.
This dichotomy creates significant uncertainty. Is the falling supply on Binance a sign of HODLer conviction paving the way for a short squeeze, or simply users moving assets to DeFi protocols, with little bearing on immediate price direction? Is the push towards $2,000 the start of a real trend reversal, or a bull trap set by bearish technical patterns? Is Ethereum's fundamental value being overlooked amidst short-term noise, or are the critiques about its risk/reward profile relative to Bitcoin valid warnings?
Investor Sentiment and Key Factors to Watch
This environment fosters polarized investor sentiment. Optimists see a buying opportunity, focusing on the recent strength and long-term potential. Pessimists see confirmation of underlying weakness and prepare for further declines. The path forward will likely be determined by several key factors:
1. Bitcoin's Trajectory: As the market leader, Bitcoin's price action heavily influences the broader crypto market, including Ethereum. Continued strength in BTC could provide a tailwind for ETH.
2. Technical Levels: Whether ETH can decisively breach and hold $2,000, or if it gets rejected, will be a critical short-term indicator. Equally important is whether current support levels hold during any pullbacks.
3. Exchange Flows & On-Chain Data: Continued monitoring of exchange supply, staking activity, and transaction volumes will provide clues about investor behavior.
4. Regulatory Developments: Any clarification on Ethereum's regulatory status, particularly in the US, could significantly impact sentiment.
5. Macroeconomic Environment: Broader market risk appetite, influenced by inflation, interest rates, and economic growth prospects, will continue to play a role.
Conclusion: Navigating Ethereum's Uncertain Path
Ethereum stands at a precarious crossroads. The recent climb towards $2,000, supported by encouraging signs like falling exchange supply, offers a glimmer of hope for bulls anticipating a recovery and perhaps even a short squeeze. However, this optimism is aggressively challenged by alarming technical warnings, significant underperformance compared to market expectations and Bitcoin, and pointed critiques questioning its current investment viability.
The "memecoin" comparison, while harsh, reflects a genuine frustration and concern among some market observers about ETH's volatility and perceived lack of decisive direction relative to the "digital gold" narrative solidifying around Bitcoin. The formation of rare bearish patterns adds a layer of technical urgency to these concerns.
Ultimately, the market remains deeply divided on Ethereum's immediate future. The battle between the potential for a supply-driven squeeze towards $2,000 and the risk of a pattern-induced crash is palpable. Investors must weigh the platform's undeniable long-term technological significance and ecosystem strength against the immediate headwinds of poor recent performance, regulatory ambiguity, and concerning technical signals. The coming weeks are likely to be crucial in determining whether Ethereum can overcome the prevailing skepticism and validate the recent bullish momentum, or if the bears will regain control, confirming the warnings of a continued downturn. The price action around the $2,000 level will be a key battleground in this ongoing struggle.
Disclaimer: The information presented in this article is for informational and educational purposes only. It is based on the analysis of the provided headlines and general market knowledge. It does not constitute financial advice. Investing in cryptocurrencies involves significant risk, including the potential loss of principal. Readers should conduct their own thorough research and consult with a qualified financial advisor before making any investment decisions.

Ethereum Bulls Poised: $1875 Resistance Key to Next Leg UpETHUSD forms double top around $1875 and showed a minor sell-off. It hits an intraday low of $1816 and is currently trading around $1834.
Overall trend remains bullish as long as support of $1500 remains intact. The key near-term resistance is at $1875 (trend line joining $4109 and $3746) any breach above targets $2000/$2300/ $2500/$2770/$3000/$3400/$3600/$3800/$4000. A robust bullish trend will only materialize above $4100.
Immediate support is around $1675. Any violation below will drag the price down to $1620/$1500/$1200/$1000. A breach below $1000 could see Ethereum plummet to $800/$500.
It is good to buy above $1875 with SL around $1500 for a TP of $2770/$3000.

ETHBTC - it's readyhi traders,
Let's have a look at ETHBTC chart on the weekly time frame
ETHBTC has been in a downtrend for almost 3 years.
The price came back into the support area that hasn't been tested since 2019.
Last time when RSI was at 24, ETHBTC bottomed out.
I can't see the price going much lower.
In my opinion, it's a great spot to buy ETH and just hold it for the next few months.
Do you agree? Feel free to share your thoughts in the comment section.

ETHUSD INTRADAY supported at 1,726ETH/USD maintains a bullish sentiment, supported by an ongoing upward trend. However, recent intraday price action shows signs of sideways consolidation, suggesting a pause or potential setup before the next significant move.
Key Levels:
Support: 1,726 (primary), followed by 1,680 and 1,620
Resistance: 1,910, with extended targets at 1,960 and 2,020
The 1,726 level serves as a critical pivot point, marking a previous consolidation zone. A pullback toward this level followed by a bullish rebound could reaffirm the uptrend and set the stage for a move toward the 1,910 resistance. A breakout above 1,910 would likely open the path to higher targets at 1,960 and 2,020 over the medium to long term.
On the other hand, a daily close below 1,726 would weaken the bullish structure and could trigger a deeper retracement toward 1,680 and potentially 1,620.
Conclusion:
ETH/USD remains in a bullish trend, but short-term consolidation may precede the next leg up. Traders should monitor the 1,726 support level closely—its defense could signal trend continuation, while a breakdown would increase downside risk.
This communication is for informational purposes only and should not be viewed as any form of recommendation as to a particular course of action or as investment advice. It is not intended as an offer or solicitation for the purchase or sale of any financial instrument or as an official confirmation of any transaction. Opinions, estimates and assumptions expressed herein are made as of the date of this communication and are subject to change without notice. This communication has been prepared based upon information, including market prices, data and other information, believed to be reliable; however, Trade Nation does not warrant its completeness or accuracy. All market prices and market data contained in or attached to this communication are indicative and subject to change without notice.

Solana vs Ethereum – A Meme War or Market Shift?🔥⚔️ Solana vs Ethereum – A Meme War or Market Shift? 🧠📉
It’s getting spicy out here in the crypto arena... and the memes are hitting just as hard as the market caps! 💥
Over the weekend, Solana briefly flipped Ethereum in total staking value — triggering a fiery debate on whether that’s bullish or bearish for SOL. Some celebrated the milestone 🥂, while others, especially from the ETH camp, argued it reveals a deeper problem: Solana’s staking isn't really staking (as slashing isn’t automatic, and network restarts are still a thing). 🛑🔧
📸 Bonus Meme: Apparently Ethereum’s new logo is now Internet Explorer 😂 — can’t say the UX didn’t earn it.
🧠 The FXProfessor’s Technical Take: Let’s cut through the noise.
📉 SOLETH (Solana vs Ethereum Ratio)
Rejected at grand resistance: 0.088
Projected drop: -28% to 0.063
Structure: Bearish inside an ascending channel (highlighted in orange)
📊 ETHUSD
Support: $1,530
Rebound potential: $1,650 and beyond
Long-term structure still forming — this could be a spring.
📈 SOLUSD
Key support: $114
If that breaks higher, next test is $179, then $215
But failure at this level opens room for downside re-test near $80
💬 So where do we stand? On chart structure alone, Solana might still outperform ETH short-term — but technically, SOLETH suggests a correction is due.
🧑🏫 Yes, I’m emotionally attached to Ethereum — I have build on it, invested in it, got smashed on it for months..pain, at least for now. But I trade what I see (or at least i try damn it!)
Let the memes roll, but let the charts speak. Drop your thoughts — SOL or ETH? 👇
One Love,
The FXPROFESSOR 💙

HolderStat | Insane Profits in 9 Deals🚀 Wallet turned $5.9K into 25.78 ETH CRYPTOCAP:ETH (~$47.4k) with just 9 trades, netting a massive 2567% profit in 58 months! With avg buy at $705 & avg sell at $4,647, it’s proof that smart timing and patience pay off big in crypto! 🔥

ETHUSD Ready for PUMP or what ?Currently, ETH is forming an ascending triangle, indicating a potential price increase. It is anticipated that the price could rise, aligning with the projected price movement (AB=CD).
Give me some energy !!
✨We spend hours finding potential opportunities and writing useful ideas, we would be happy if you support us.
Best regards CobraVanguard.💚
_ _ _ _ __ _ _ _ _ _ _ _ _ _ _ _ _ _ _ _ _ _ _ _ _ _ _ _ _ _ _ _
✅Thank you, and for more ideas, hit ❤️Like❤️ and 🌟Follow🌟!
⚠️Things can change...
The markets are always changing and even with all these signals, the market changes tend to be strong and fast!!

Ethereum H4 | Falling toward a multi-swing-low supportEthereum (ETH/USD) is falling towards a multi-swing-low support and could potentially bounce off this level to climb higher.
Buy entry is at 1,732.25 which is a multi-swing-low support that aligns close to the 23.6% Fibonacci retracement.
Stop loss is at 1,650.00 which is a level that lies underneath a pullback support and the 38.2% Fibonacci retracement.
Take profit is at 1,938.37 which is an overlap resistance that aligns with the 78.6% Fibonacci retracement.
High Risk Investment Warning
Trading Forex/CFDs on margin carries a high level of risk and may not be suitable for all investors. Leverage can work against you.
Stratos Markets Limited (tradu.com):
CFDs are complex instruments and come with a high risk of losing money rapidly due to leverage. 63% of retail investor accounts lose money when trading CFDs with this provider. You should consider whether you understand how CFDs work and whether you can afford to take the high risk of losing your money.
Stratos Europe Ltd (tradu.com):
CFDs are complex instruments and come with a high risk of losing money rapidly due to leverage. 63% of retail investor accounts lose money when trading CFDs with this provider. You should consider whether you understand how CFDs work and whether you can afford to take the high risk of losing your money.
Stratos Global LLC (tradu.com):
Losses can exceed deposits.
Please be advised that the information presented on TradingView is provided to Tradu (‘Company’, ‘we’) by a third-party provider (‘TFA Global Pte Ltd’). Please be reminded that you are solely responsible for the trading decisions on your account. There is a very high degree of risk involved in trading. Any information and/or content is intended entirely for research, educational and informational purposes only and does not constitute investment or consultation advice or investment strategy. The information is not tailored to the investment needs of any specific person and therefore does not involve a consideration of any of the investment objectives, financial situation or needs of any viewer that may receive it. Kindly also note that past performance is not a reliable indicator of future results. Actual results may differ materially from those anticipated in forward-looking or past performance statements. We assume no liability as to the accuracy or completeness of any of the information and/or content provided herein and the Company cannot be held responsible for any omission, mistake nor for any loss or damage including without limitation to any loss of profit which may arise from reliance on any information supplied by TFA Global Pte Ltd.
The speaker(s) is neither an employee, agent nor representative of Tradu and is therefore acting independently. The opinions given are their own, constitute general market commentary, and do not constitute the opinion or advice of Tradu or any form of personal or investment advice. Tradu neither endorses nor guarantees offerings of third-party speakers, nor is Tradu responsible for the content, veracity or opinions of third-party speakers, presenters or participants.

Bullish momentum to extend?Ethereum (ETH/USD) is reacting off the pivot and could bounce to the overlap resistance that aligns with the 78.6% Fibonacci retracement.
Pivot:1,833.07
1st Support: 1,738.55
1st Resistance: 1,949.39
Risk Warning:
Trading Forex and CFDs carries a high level of risk to your capital and you should only trade with money you can afford to lose. Trading Forex and CFDs may not be suitable for all investors, so please ensure that you fully understand the risks involved and seek independent advice if necessary.
Disclaimer:
The above opinions given constitute general market commentary, and do not constitute the opinion or advice of IC Markets or any form of personal or investment advice.
Any opinions, news, research, analyses, prices, other information, or links to third-party sites contained on this website are provided on an "as-is" basis, are intended only to be informative, is not an advice nor a recommendation, nor research, or a record of our trading prices, or an offer of, or solicitation for a transaction in any financial instrument and thus should not be treated as such. The information provided does not involve any specific investment objectives, financial situation and needs of any specific person who may receive it. Please be aware, that past performance is not a reliable indicator of future performance and/or results. Past Performance or Forward-looking scenarios based upon the reasonable beliefs of the third-party provider are not a guarantee of future performance. Actual results may differ materially from those anticipated in forward-looking or past performance statements. IC Markets makes no representation or warranty and assumes no liability as to the accuracy or completeness of the information provided, nor any loss arising from any investment based on a recommendation, forecast or any information supplied by any third-party.

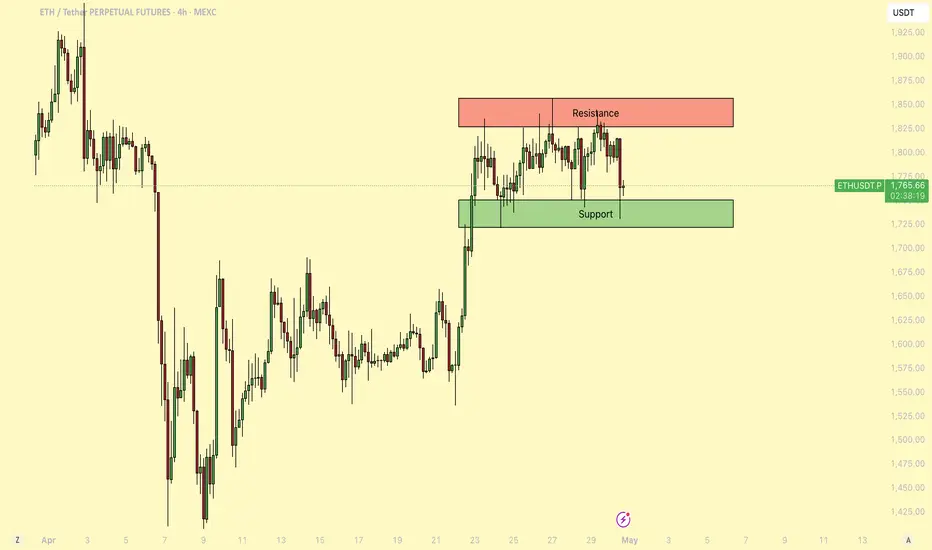
BTC - Inversion Play at Resistance With IFVG Breakdown PotentialPrice has tapped into a previously established resistance zone and is now showing signs of exhaustion. A reactive short setup is in play, contingent on further bearish confirmation.
---
1. Resistance Zone — Key Supply Area
The marked red zone above highlights:
- Repeated Rejections: Price has failed multiple times to break and hold above this level.
- Order Block & Liquidity: Likely an area where institutional selling interest remains.
This zone offers a prime location for short setups, especially if price fails to hold above it and begins to roll over.
---
2. IFVG Inversion — Breaker-Type Setup
We are watching for:
- Inversion of a Bullish IFVG: A common signal of shifting order flow.
- Breaker Behavior: A previously supportive zone now acting as resistance — a hallmark of smart money reversals.
This structure suggests an intent to trap late longs and transition into lower pricing.
---
3. Internal Liquidity Sweep — Fuel for the Drop
The local high served to:
- Clear Short-Term Liquidity: Wick just above resistance suggests engineered breakout bait.
- Trigger Buyer Commitment: Which could now get trapped if momentum fails.
This liquidity event sets up the conditions for a more sustained push downward.
---
4. Downside Targeting the Discount Zone
Price is projected to revisit the blue discount zone:
- 0.618–0.65 Retracement Levels: Classic Fibonacci discount area often targeted after a premium rejection.
- Reaccumulation Potential: Watch for signs of buyer interest returning here.
This forms the logical destination for price following a confirmed rejection.
---
5. Summary:
- Price Rejecting Resistance & IFVG Inversion Signals Reversal Bias
- Liquidity Sweep Confirms Trap Setup
- Discount Zone Below Offers High-Probability Reaction Area
A strong short scenario may unfold if bearish order flow confirms beneath the resistance region.

B wave short incoming!if eth breaks its local top before making a double bottom this trade idea is invalid.

ETHEREUM is getting ready for a major breakout (12H)This analysis is an update of the analysis you see in the "Related publications" section
The red zone represents a supply area based on the Philip strategy. It’s possible that the price might not be able to break through this zone on the first attempt. If the price gets rejected, the lower green box will be a re-entry opportunity for those who missed the move.
Let’s closely monitor this chart and see how it plays out.
A daily candle closing below the invalidation level will invalidate this analysis. invalidation level : 1198$
For risk management, please don't forget stop loss and capital management
When we reach the first target, save some profit and then change the stop to entry
Comment if you have any questions
Thank You

HolderStat | Tracking a long-term strategistThis trader turned $127 into $4,626 — that’s +3623% with just 3 trades over 5+ years.
He didn't chase hype.
He bought at $671 and sold at $4,741.
Minimal action. Maximum gain.
Wallet still holds 0.74 ETH CRYPTOCAP:ETH ($1.3K).
Proof that sometimes… doing nothing is the best strategy 🧘♂️

#CRYPTO #BTC #ETH #WARNING #DUMP #COMING #WYCKOFF #SHORT#CRYPTO #BTC #ETH #WARNING #DUMP #COMING #WYCKOFF #SHORT
50% DUMP is coming for #Bitcoin & #Ethereum
This analysis is based on the analytical style of the Wyckoff Distribution Structure of Schematic #1.
I have outlined for you the important parts of the Wyckoff style on the one-hour timeframe on Bitcoin & Ethereum.
Currently, we are in Phase C of the Wyckoff Distribution Structure on Bitcoin & Ethereum.
We have to wait for the completion of this phase and the start of Phase D of the Wyckoff Distribution Structure.
See my analysis on Bitcoin & Ethereum now and read the full description section.
My Wyckoff Analysis of Bitcoin:
My Wyckoff Analysis of Ethereum:
The responsibility for the trade is yours and I have no responsibility for your failure to comply with the risk and capital management.
Good luck and be profitable.

#ETH #ETHUSD #ETHUSDT #ETHEREUM #Wyckoff #Analysis #Eddy#ETH #ETHUSD #ETHUSDT #ETHEREUM #Wyckoff #Analysis #Eddy
This analysis is based on the analytical style of the Wyckoff Distribution Structure of Schematic #1.
I have outlined for you the important parts of the Wyckoff style on the one-hour timeframe.
Currently, we are in Phase C of the Wyckoff Distribution Structure.
We have to wait for the completion of this phase and the start of Phase D of the Wyckoff Distribution Structure.
When will this structure be fully confirmed? When the Ethereum price falls to the 1750 support and gathers the final spring when this support is broken for the fall, we will enter a short position by getting the necessary confirmations based on our style and strategy.
💬 Note: The best entry point for short positions will be the 1720_1750 support break. if the Ethereum price UTAD and test formed, high-risk traders who are willing to trade in the opposite direction can enter a short position by getting confirmation in the time frames below 15 minutes.
Where will the targets be? The first target is 1500 and the second target can be 1000 dollars. Maybe next targets is : 800_500 dollars.
When can you safely close the position and enter a reverse trade, that is, long or buy? When a Wyckoff accumulation structure is formed at one of the targets.
The responsibility for the trade is yours and I have no responsibility for your failure to comply with the risk and capital management.
Good luck and be profitable.
I also invite you to review and view my latest analysis on Bitcoin & TOTAL3 on my page.

ETH/BTC Looking Juicy ...Well... not a bad time to scoop some ETH at these low levels for some long term hold...
As always, DYOR!
Peace,
Subawu

ETHUSD Will Go Up! Long!
Here is our detailed technical review for ETHUSD.
Time Frame: 12h
Current Trend: Bullish
Sentiment: Oversold (based on 7-period RSI)
Forecast: Bullish
The market is trading around a solid horizontal structure 1,848.90.
The above observations make me that the market will inevitably achieve 2,055.37 level.
P.S
We determine oversold/overbought condition with RSI indicator.
When it drops below 30 - the market is considered to be oversold.
When it bounces above 70 - the market is considered to be overbought.
Disclosure: I am part of Trade Nation's Influencer program and receive a monthly fee for using their TradingView charts in my analysis.
Like and subscribe and comment my ideas if you enjoy them!

Geospatial Technology: A Catalyst for Modern InnovationBeyond Earth-based uses, geospatial tools are now integral to advancements in autonomous vehicles, drone technology, and even space exploration. As data becomes increasingly abundant, the ability to tie that data to a physical location adds powerful context that static information cannot provide.
Geospatial technology enhances safety, efficiency, and scalability. It enables vehicles and systems to operate with spatial awareness, supports AI-driven decision-making, and ultimately helps automate logistics in a reliable and responsive way.
FedEx has recently emphasized its commitment to integrating autonomous technologies to enhance logistics efficiency and resilience. These initiatives aim to streamline operations and reduce costs, contributing to a $6 billion reduction in the company's cost base over three years. XYO happens to be a partner at the FedEx institute of tech.
XYO is also rumored to be integrated with Tesla vehicles -- just like with Bitcoin mining. The hope is to use the XYO blockchain to address location spoofing issues where validity of data and safety is paramount. This goes in hand with Tesla's goals to make your care work for you. In fact, the goal for XYO is to pay users for creating and validating data.
Key Developments in the Past 12 Months:
1. Launch of XYO Layer One and Dual-Token Economy
2. Expansion to Solana
3. Introduction of the XYO Platform Node
4. Gamification and User Engagement
5. Developer Resources and Community Building
XYO launched the "Build the Future" initiative, aimed at fostering a robust developer community. This program provides resources, documentation, and incentives for developers to build applications and tools on the XYO network.
Looking ahead, XYO plans to continue enhancing its Layer-1 blockchain capabilities, expanding interoperability with other blockchain networks, and introducing more user-centric applications. The focus remains on building a decentralized, user-owned geospatial data network that empowers individuals and developers alike. A network-effect-like-potential for this technology is worth paying attention to.
From a military standpoint, geospatial technology is critical because it provides the foundation for situational awareness, precision, and operational dominance in modern warfare:
GPS and satellite imagery
Real-time geospatial intelligence (GEOINT) ensures that moving or hidden targets can be tracked and re-verified before engagement.
Terrain analysis
Topographic and environmental data
Autonomous surveillance drones need GPS and HD geospatial mapping to patrol borders or conflict zones.
Logistics bots and unmanned vehicles rely on route optimization for resupply missions under fire or in denied environments.
Geospatial analytics can identify unusual patterns (e.g., IED placements, enemy camps) from satellite data.
Geofencing can alert personnel when enemies or drones breach a protected area.
Before any mission, simulations and war games based on real-world geospatial data improve planning and reduce risks.

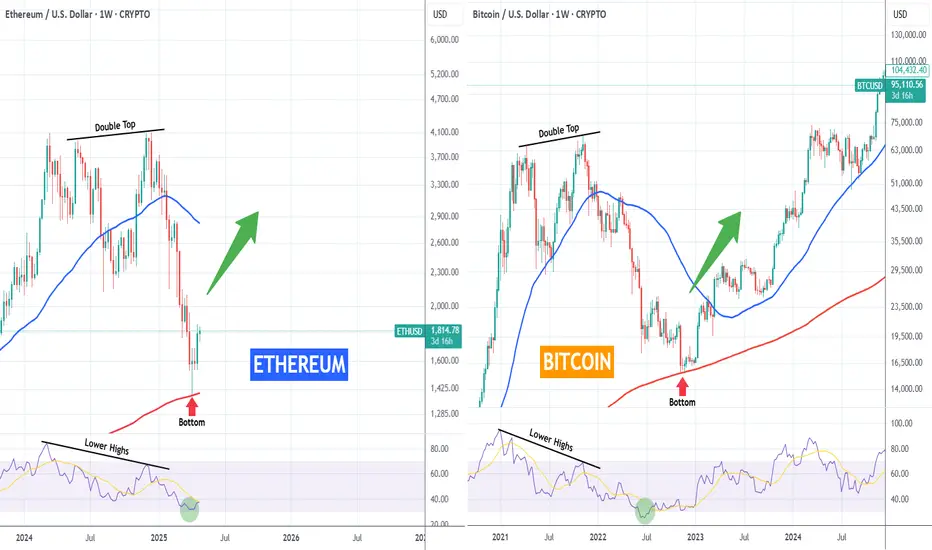
ETHEREUM vs BITCOIN fractals you'd never thought to look at!Odd comparison but you'd be lying if you say those fractals between Ethereum (ETHUSD) 2024 - 2025 and Bitcoin (BTCUSD) 2021 - 2022 don't look similar. But if you do believe it, can this mean ETH is about to see a rally to a new All Time High?
Anyway as the title says, this is fun fractal for comparison purposes only. The conclusion is yours!
-------------------------------------------------------------------------------
** Please LIKE 👍, FOLLOW ✅, SHARE 🙌 and COMMENT ✍ if you enjoy this idea! Also share your ideas and charts in the comments section below! This is best way to keep it relevant, support us, keep the content here free and allow the idea to reach as many people as possible. **
-------------------------------------------------------------------------------
💸💸💸💸💸💸
👇 👇 👇 👇 👇 👇
GOLD - FVG-Based Long & Short Setup Within Range ContextPrice action remains range-bound with well-defined FVG zones acting as both support and resistance, offering reactive trading opportunities on both sides.
---
1. Upper FVG as Resistance — Short Setup Trigger Zone
The highlighted upper green zone marks:
- Fair Value Gap (FVG): A clear inefficiency from the previous bearish impulse.
- Structural Significance: Price has struggled to break and hold above, showing signs of supply reactivation.
This zone is likely to attract sellers upon revisit, offering a clean risk-defined short opportunity.
---
2. Lower FVG as Support — Long Setup Zone
The lower blue zone serves as:
- FVG Rebalance Area: A region where price previously left inefficiency, now acting as strong support.
- Accumulation Interest: Smart money often reloads in such imbalanced areas on retests.
This zone is optimal for positioning into the next bullish leg should price dip lower.
---
3. Liquidity Sweep Mechanics — Trap Both Sides
The market structure hints at:
- Step 1: Induce buyers into breakout longs into resistance.
- Step 2: Reverse from FVG, triggering short entries and trapping longs.
- Step 3: Collect liquidity from lower range, potentially initiating new accumulation.
This movement pattern is characteristic of engineered liquidity grabs in both directions.
---
4. Mid-Range Reaction — Key Pivot Area
Price currently hovers around the mid-range zone:
- Serving as a temporary balance point before volatility expansion.
- Acting as a launchpad for the next impulsive move, depending on order flow dominance.
Patience here is key — waiting for clean confirmations near FVGs provides optimal entry quality.
---
5. Summary:
- Upper FVG Resistance → Short Bias
- Lower FVG Support → Long Bias
- Structured Reactions Around Imbalances Suggest Smart Money Activity
This is a dual-sided setup ideal for reaction-based traders awaiting price confirmation at extremes.
