Short-term correction waves.Ethereum’s RSI has been rising significantly recently and has reached the overbought region. Therefore, it would not be surprising if it drops to the RSI mid-band from here. Then I expect Ethereum to continue its bullish waves.
* The purpose of my graphic drawings is purely educational.
* What i write here is not an investment advice. Please do your own research before investing in any asset.
* Never take my personal opinions as investment advice, you may lose your money.
Ethereum (Cryptocurrency)

ETHEREUM New Update (1D)Ethereum has reclaimed the flip zone, but it hasn't tested this area or made a proper pullback yet.
It's expected that this zone will be tested before the price moves toward higher targets.
If we see a strong reaction around the green zone, we can look for potential buy/long positions.
A daily candle closing below the invalidation level would invalidate this analysis.
For risk management, please don't forget stop loss and capital management
When we reach the first target, save some profit and then change the stop to entry
Comment if you have any questions
Thank You

ethereum local peak + $10k or nothingethereum local peak + $10k or nothing
In the current cycle we are in, ethereum, which has not yet appreciated and has not made a real run, will close the correlation difference with bitcoin in the coming period and I think it will accompany a major run.

ETHEREUM Massive rejection on the 1W MA50. Will it break?Ethereum (ETHUSD) has seen its strongest 1-month rise in recent times since the April 07 rebound and last week that stopped and got rejected exactly on the 1W MA50 (blue trend-line). This rebound is technically the new Bullish Leg of the multi-year Rising Wedge.
The 1W MA50 turned into a Resistance when it last broke on the week of January 27 2025, so almost 4 months ago. Once it breaks and closes a 1W candle above it, we can continue to expect the bullish trend to continue by at least as much as the rise below it (that happened in late 2024).
Technically for now, if it breaks, the upside is limited by the 4100 Resistance, so that will be our Target in that event.
-------------------------------------------------------------------------------
** Please LIKE 👍, FOLLOW ✅, SHARE 🙌 and COMMENT ✍ if you enjoy this idea! Also share your ideas and charts in the comments section below! This is best way to keep it relevant, support us, keep the content here free and allow the idea to reach as many people as possible. **
-------------------------------------------------------------------------------
💸💸💸💸💸💸
👇 👇 👇 👇 👇 👇

ETH's situation+ Target PredictionThe COINBASE:ETHUSD is in a Bullish phase by a Falling Wedge Pattern.
A falling wedge indicates the potential for price to reach to $2750.
Note if the Wedge Pattern is broken downwards with the strength of Bearish candles , this analysis of ours will be failed.
Give me some energy !!
✨We spend hours finding potential opportunities and writing useful ideas, we would be happy if you support us.
Best regards CobraVanguard.💚
_ _ _ _ __ _ _ _ _ _ _ _ _ _ _ _ _ _ _ _ _ _ _ _ _ _ _ _ _ _ _ _
✅Thank you, and for more ideas, hit ❤️Like❤️ and 🌟Follow🌟!
⚠️Things can change...
The markets are always changing and even with all these signals, the market changes tend to be strong and fast!!

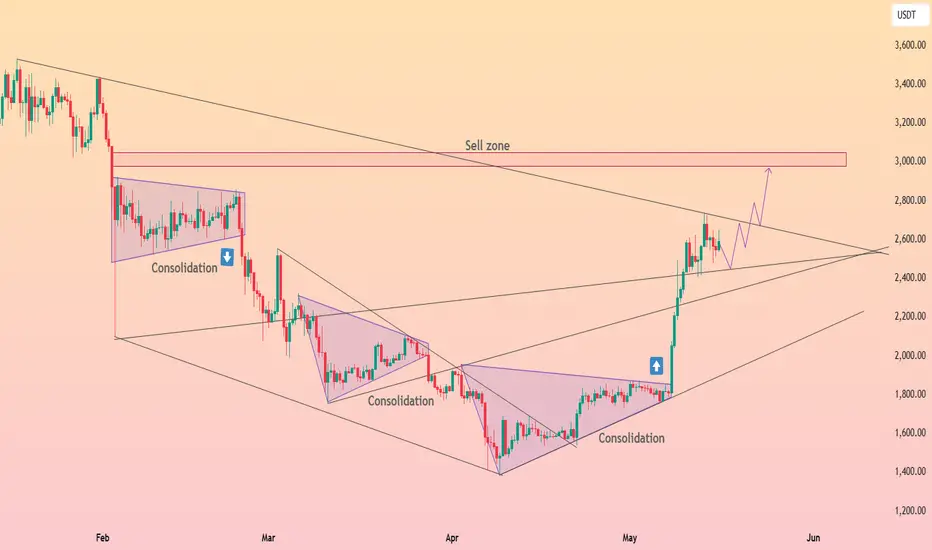
HolderStat┆ETHUSD wedge liftoff eyes 3 k sell zoneCRYPTOCAP:ETH blasted out of a multi-month falling wedge, erupting from 1.8 k to 2.7 k in one vertical burst. Price is now hovering above the broken wedge roof and an intersecting long-term trend line at roughly 2.55-2.60 k. If this freshly minted support holds, the pattern’s measured move directs attention to the 2.9-3.1 k sell zone in red. A dip under 2.45 k would simply delay, not negate, the bullish structure while the broader trend stays up-sloping.
ETH/USD Technical AnalysisFenzoFx—Ethereum is retesting last week's low at 2,330 in today's session. A bullish candlestick pattern formed on Sunday after the price touched this support.
Ethereum is now trading around 2,400, showing strength in the London session. The outlook remains bullish above 2,330, with a potential target of 2,588, possibly during the New York session.
Bearish Scenario : A drop below 2,330 would invalidate the bullish view, likely resuming the downtrend toward 2,200.

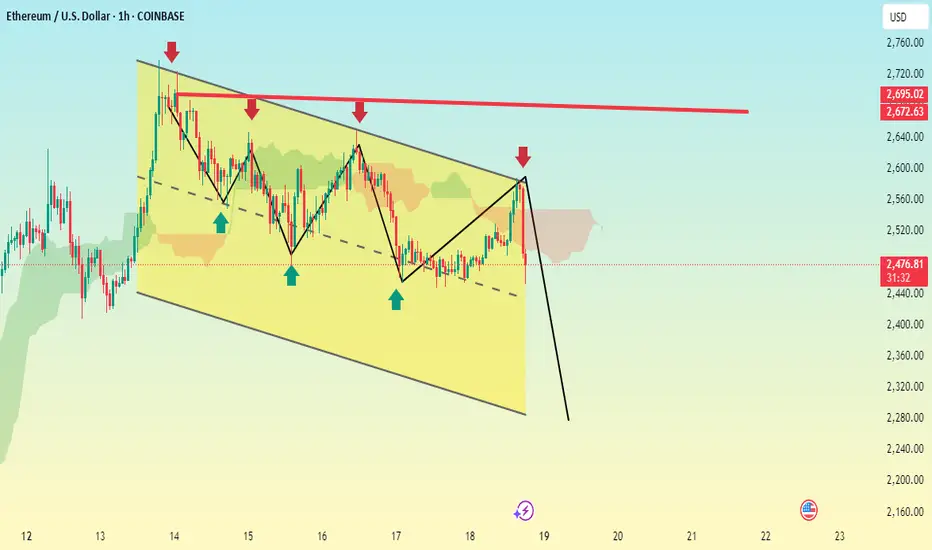
ETHEREUM BEARISH ZONEBased on the chart we provided, which shows a descending channel and a bearish pattern on Ethereum (ETH/USD) on the 1-hour timeframe, it seems like you're anticipating a breakdown from the channel support. The chart also shows a projected drop with a strong bearish move marked by a thick black arrow.
Here are some potential Take Profit (TP) levels based on technical support zones and the chart structure:
Suggested Sell TPs (short position):
1. TP1: $2,420 — Just above the recent swing low, potential initial support.
2. TP2: $2,360 — Mid-range of the previous low and psychological level.
3. TP3: $2,300 — Near the bottom of the descending channel and a likely target if breakdown confirms.
4. TP4: $2,240–$2,200 — Extended TP if momentum is strong and the broader market supports the move.
Always remember:
Use proper risk management.
Monitor volume and market sentiment around the breakout.
Consider setting a stop loss just above the recent swing high (around $2,565–$2,580).
EthUsd is in bearish trend and key levelsEthUsd is in bearish zone and its key levels are 2366, 2259, 2150, 1995 and 1797.

Ethereum: The Bullish Cycle Starts Now!The minimum new 2025 All-Time High for Ethereum is $5,794. The next target sits at ~$8,500.
Ethereum took some time out and used this week to challenge resistance. Resistance was found at 0.5 Fib extension with exactitude, that is, $2,746.
Two supports mainly: 1) $2,424 and 2) $2,026.
The bottom is in and it is really far away. The $2,026 is the 0.236 Fib extension and also the baseline of the rounded bottom pattern.
The correction low sits at $1,383 and Ethereum (ETHUSD) will never ever in its entire history trade at this price ever again. It is gone forever. Right now it is still relatively early but this will be more obvious as the month reaches its end.
Good evening my fellow Cryptocurrency trader, I hope you are having a nice Sunday and the week is about to close.
Ethereum is still early, early in its trading session based on the long-term bullish cycle, and I say this based on market data and the chart. Not my speculative opinion.
This is the biggest exchange in the list, it comes up first.
Exchanges are listed by volume when you look up a pair here on TradingView.
It turns out that trading volume is still low but prices are going up. This is what tells me that it is still early, wave 1. When the action gets going and bullish momentum grows, volume will reach its highest; wave 3. Then the action will continue and will go crazy but volume won't keep up; wave 5.
I say the minimum is $5,794 and this is an easy target. Can go higher, much higher but 5.8K is an easy bet.
Go LONG hold spot trade options do what it takes.
Buy the funds, the ETFs, the actual coins holding or staking it doesn't matter as long as you participate. Even with stablecoins through DYDX or whatever way you prefer. As long as you participate in this awesome market the market will reward you.
Thank you for reading.
Namaste.

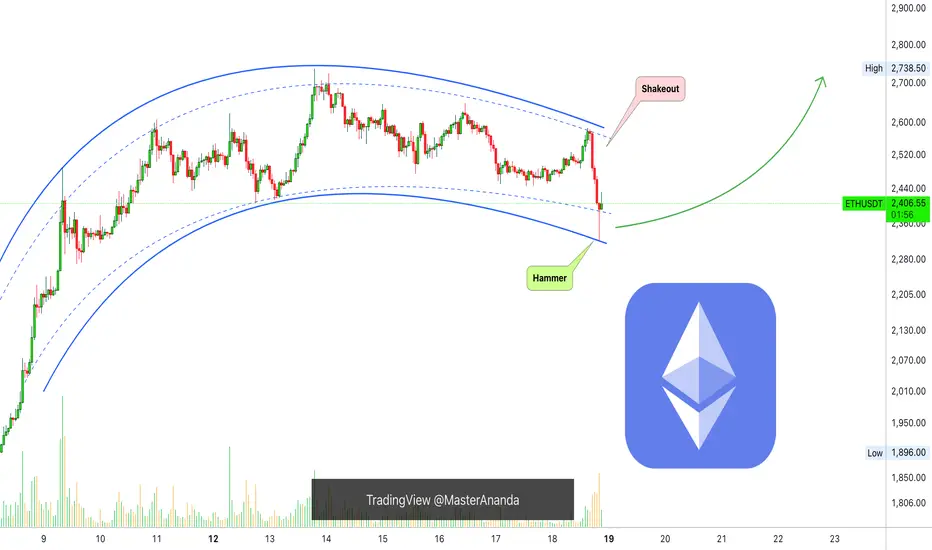
Ethereum Short-Term, Bullish Or Bearish?Notice this recent shakeout on the chart, this is a major move and surely removes lots of over leveraged positions. It also traps the bears, a bear-trap.
If this move continued lower it would be bad news but the 1H candle ended with a long lower wick, producing a hammer which is a reversal signal. This candle produced the lowest price since 9-May, 9 days ago, and the current candle is green, this tells us that a shakeout is confirmed.
The bearish move is a failed signal so the next move is up. With a very small bullish continuation, the current candle closing at current price or higher, it is confirmed ETHUSDT to continue rising.
(If the current candle were to close red and lower this would be a bearish confirmation.)
Short-term bullish structure intact. It is normal to see the market shaking before a major move. Remember, Bitcoin is about to close its 6th consecutive week green, the most bullish development of the decade. This affects Ethereum of course and the entire Cryptocurrency market.
Namaste.
BTCUSD 1H TIMEFRAME BULISH ZONEThe chart you've shared for BTC/USD (1H timeframe) indicates a bullish outlook based on the following elements:
Ascending Channels: Price moved within two rising channels, suggesting a bullish momentum.
Support Zone: Marked by arrows, previous bounces suggest strong support near 102,200–102,300.
Breakout and Pullback: Price appears to be forming a higher low, potentially preparing for the next upward leg.
Target Area: Marked around 105,630 (TP target).
Summary:
Entry (Buy Zone): Around 103,200–103,300.
Stop Loss (SL): Below 102,200 (conservative stop).
Take Profit (TP): 105,630 (as marked on chart).
Risk-to-Reward Ratio: Approximately 1:2 or better.

ETHUSD: Strong Growth Ahead! Long!
My dear friends,
Today we will analyse ETHUSD together☺️
The price is near a wide key level
and the pair is approaching a significant decision level of 2,566.3 Therefore, a strong bullish reaction here could determine the next move up.We will watch for a confirmation candle, and then target the next key level of 2,601.4.Recommend Stop-loss is beyond the current level.
❤️Sending you lots of Love and Hugs❤️

SEI breaks the downtrend targets 30cThe SEI network is currently displaying positive price movement after recently breaking out of a downward trend channel that had been in place since the peak on December 5th. On the daily chart, it has been trading sideways within the upper channel, indicating a potential retest of that breakout. However, the momentum isn't particularly strong, especially since Ethereum, the frontrunner in the altcoin resurgence, isn't exhibiting explosive upward movement either.
Should the situation shift and Ethereum regain its leading position, I believe that many struggling smart contract platforms, which have seen their prices plummet by over 80%, could also experience a robust recovery.
If Ethereum manages to climb back into the $2,000+ range, I anticipate that SEI will reach its target on the chart, which is approximately 30 cents.

Ethereum Approaching Key Resistance – Breakout or Rejection?Ethereum ( CRYPTOCAP:ETH ) has been on a strong upward trend since bouncing from the $1500 zone, and it’s currently trading around $2372. All eyes are now on the next major resistance area between $2600 and $2900.
So what’s next—breakout or pullback?
If ETH can push through this resistance with strong momentum and volume, we could see a continuation toward $3000 and beyond.
A rejection from this level could lead to a dip back toward the $1900–$1700 support range.
My Take: The trend is bullish, but this resistance zone is a key test. A strong close above $2900 would confirm a breakout. Until then, caution and close observation are crucial.
What do you think? Will ETH break through or bounce down from here?
Share your thoughts below!
Kindly support this idea with a LIKE👍 if you find it useful🥳
Happy Trading💰🥳🤗

ETHUSD Is Bullish! Long!
Here is our detailed technical review for ETHUSD.
Time Frame: 9h
Current Trend: Bullish
Sentiment: Oversold (based on 7-period RSI)
Forecast: Bullish
The market is approaching a significant support area 2,593.04.
The underlined horizontal cluster clearly indicates a highly probable bullish movement with target 2,920.18 level.
P.S
The term oversold refers to a condition where an asset has traded lower in price and has the potential for a price bounce.
Overbought refers to market scenarios where the instrument is traded considerably higher than its fair value. Overvaluation is caused by market sentiments when there is positive news.
Disclosure: I am part of Trade Nation's Influencer program and receive a monthly fee for using their TradingView charts in my analysis.
Like and subscribe and comment my ideas if you enjoy them!

ETHUSD - Support Line Reestablished A major support line has been recovered on this ETH daily chart
One that previously led to a strong breakout
From here price will find support on this line and then pop off again
Good time to buy ETHUSD
Daily chart

ETH/USDT – First Support in the Blue BoxETH has been slowing down after its latest push, and the first real area to watch is that blue box below price. It’s where buyers will likely step back in, and a clean reaction there could spark a bigger move—especially if ETH/BTC starts to turn higher at the same time.
What you need before pulling the trigger
• A volume surge that outstrips the prior pullback and aligns with a bullish CDV divergence
• A quick break under the blue box on your one- or five-minute chart followed by a fast reclaim, showing order flow flipped to the buy side
• Genuine buying pressure, not just a wick into the zone
“If the levels suddenly break upwards and do not give a downward break in the low time frame, I will not evaluate it. If they break upwards with volume and give a retest, I will look long.”
Jumping in without those confirmations is the easiest way to get shaken out. But if ETH dips into that box, lights up on volume and CDV, and then retests cleanly on the low timeframe, that’s your signal. With ETH/BTC potentially gearing up to rise too, a solid bounce here could turn into something you don’t want to miss.
📌I keep my charts clean and simple because I believe clarity leads to better decisions.
📌My approach is built on years of experience and a solid track record. I don’t claim to know it all but I’m confident in my ability to spot high-probability setups.
📌If you would like to learn how to use the heatmap, cumulative volume delta and volume footprint techniques that I use below to determine very accurate demand regions, you can send me a private message. I help anyone who wants it completely free of charge.
🔑I have a long list of my proven technique below:
🎯 ZENUSDT.P: Patience & Profitability | %230 Reaction from the Sniper Entry
🐶 DOGEUSDT.P: Next Move
🎨 RENDERUSDT.P: Opportunity of the Month
💎 ETHUSDT.P: Where to Retrace
🟢 BNBUSDT.P: Potential Surge
📊 BTC Dominance: Reaction Zone
🌊 WAVESUSDT.P: Demand Zone Potential
🟣 UNIUSDT.P: Long-Term Trade
🔵 XRPUSDT.P: Entry Zones
🔗 LINKUSDT.P: Follow The River
📈 BTCUSDT.P: Two Key Demand Zones
🟩 POLUSDT: Bullish Momentum
🌟 PENDLEUSDT.P: Where Opportunity Meets Precision
🔥 BTCUSDT.P: Liquidation of Highly Leveraged Longs
🌊 SOLUSDT.P: SOL's Dip - Your Opportunity
🐸 1000PEPEUSDT.P: Prime Bounce Zone Unlocked
🚀 ETHUSDT.P: Set to Explode - Don't Miss This Game Changer
🤖 IQUSDT: Smart Plan
⚡️ PONDUSDT: A Trade Not Taken Is Better Than a Losing One
💼 STMXUSDT: 2 Buying Areas
🐢 TURBOUSDT: Buy Zones and Buyer Presence
🌍 ICPUSDT.P: Massive Upside Potential | Check the Trade Update For Seeing Results
🟠 IDEXUSDT: Spot Buy Area | %26 Profit if You Trade with MSB
📌 USUALUSDT: Buyers Are Active + %70 Profit in Total
🌟 FORTHUSDT: Sniper Entry +%26 Reaction
🐳 QKCUSDT: Sniper Entry +%57 Reaction
📊 BTC.D: Retest of Key Area Highly Likely
📊 XNOUSDT %80 Reaction with a Simple Blue Box!
📊 BELUSDT Amazing %120 Reaction!
📊 Simple Red Box, Extraordinary Results
I stopped adding to the list because it's kinda tiring to add 5-10 charts in every move but you can check my profile and see that it goes on..

ETHBTC Is it repeating its first Cycle?I know that the timeframes are not the same but don't tell me that the structure between then and now isn't similar.
The biggest difference is that in 2016 ETHBTC made a deeper low than now, but the current rebound is showing signs that we might have a similar parabolic rise.
Now will that be enough to give a new All Time High?
We will see, but don't tell me that this can't target 0.0900 byu the end of the year.
Follow us, like the idea and leave a comment below!!

Ethereum is Approaching an Important Support Zone!!Hey Traders, in today's trading session we are monitoring ETH/USDT for a buying opportunity around 2,520 zone, Ethereum is trading in an uptrend and currently is in a correction phase in which it is approaching the trend at 2,520 support and resistance area.
Trade safe, Joe.

Why Echelon Prime will hit $200 and potentially $400 in 2025Echelon Prime (PRIME) is at the forefront of a transformative movement in Web3 gaming and AI-driven virtual economies. With its innovative ecosystem and upcoming flagship game, Parallel Colony, Echelon Prime is poised for significant growth.
The Echelon Ecosystem: Merging AI and Gaming
Echelon Prime is a blockchain-focused organization supporting a decentralized gaming ecosystem. It provides the PRIME token and Web3 tools for game developers, facilitating resource allocation and governance within a community-led environment.
The ecosystem's cornerstone is the PRIME token, which serves as the native currency across its platforms. PRIME enables players to access exclusive content, participate in governance, and engage in various in-game activities.
Parallel Colony: A Revolutionary AI-Driven Game
Parallel Colony is an upcoming simulation game where players partner with AI avatars to navigate a mining colony. Each avatar controls a wallet, allowing them to own digital possessions and interact with other semi-autonomous agents.
This "1.5 player" game design introduces a new paradigm in gaming, where AI agents operate alongside human players, creating a dynamic and immersive experience. The game's integration of AI and blockchain technology exemplifies the innovative direction of the Echelon ecosystem.
Market Potential and Price Outlook
As of now, Echelon Prime (PRIME) is trading at approximately $4.24, with a market capitalization of around $151 million. Given the ecosystem's innovative approach and the anticipated release of Parallel Colony, there is substantial growth potential.
A projected market cap of $15 billion would correspond to a PRIME token price of approximately $204, representing a 50x increase from current levels. This projection is based on the expected adoption of the Echelon ecosystem and the success of its flagship game. This could very well be a $30 billion market cap by end of 2025 as well, depending on other game title releases and new updates to other ambitious projects.
Conclusion: A Promising Investment in Web3 Gaming
Echelon Prime stands at the intersection of gaming and AI, offering a unique and forward-thinking ecosystem. With the upcoming release of Parallel Colony and the continued development of its platforms, Echelon Prime presents a compelling opportunity for investors interested in the future of Web3 gaming.

ETH 2025 Bull Run Price Targets: PT1 $5,800 PT2 $8,725Pectra: Ethereum’s Most Ambitious Upgrade Yet
On May 7, 2025, Ethereum activated the Pectra upgrade, marking its most comprehensive enhancement since the 2022 Merge. This dual-layer upgrade, combining the Prague execution layer and Electra consensus layer, introduced 11 Ethereum Improvement Proposals (EIPs) aimed at boosting scalability, usability, and staking efficiency .
Key features include:
EIP-7702: Introduces account abstraction, enabling wallets to function like smart contracts. This allows for batch transactions, gasless operations, and improved user experiences.
EIP-7251: Raises the staking cap per validator from 32 ETH to 2,048 ETH, streamlining staking operations and catering to institutional participants.
Enhanced Layer-2 Integration: Improves data handling and reduces costs for Layer-2 solutions, fostering greater scalability and efficiency across the Ethereum ecosystem.
These advancements position Ethereum to handle increased demand and support a broader range of decentralized applications, setting the stage for substantial growth.
Institutional and Governmental Embrace of Ethereum
Ethereum's adoption is accelerating among institutional investors and government entities:
Spot Ether ETFs: In May 2024, the U.S. Securities and Exchange Commission approved the first spot Ethereum exchange-traded funds (ETFs), launched by major firms like BlackRock and Fidelity. This milestone has facilitated greater institutional investment and integration of Ethereum into traditional financial markets.
Tokenization of Assets: Financial institutions are leveraging Ethereum's blockchain to tokenize assets, including U.S. Treasury bonds, enhancing transparency and efficiency in asset management.
Federal Initiatives: The U.S. government is exploring the creation of a national digital asset reserve, potentially incorporating Ethereum, signaling a significant shift toward embracing blockchain technologies at the federal level.
These developments underscore Ethereum's growing role as foundational infrastructure in the evolving digital financial landscape.
Price Targets for 2025
Considering the technological advancements and increasing institutional adoption, Ethereum's price is projected to reach:
Price Target 1: $5,800 (1.618 Fib Line)
Price Target 2: $8,725 (Bull Flag PT and near the 2.618 confluence)
These targets reflect a bullish outlook based on Ethereum's enhanced capabilities and its expanding role in global finance.

ADAUSDT IDEAI think chart looks pretty clear now. Red supply area properly laid down. Along with price properly taking buys from demand area in blue with higher lows. So obvious path will be the movement above supply till next supply (red area). Remember the supply is selling area (no retest concept) so strong selling could also originates. so trades are only after breaking out with clear price marching above supply zones.
