Ethereum (Cryptocurrency)

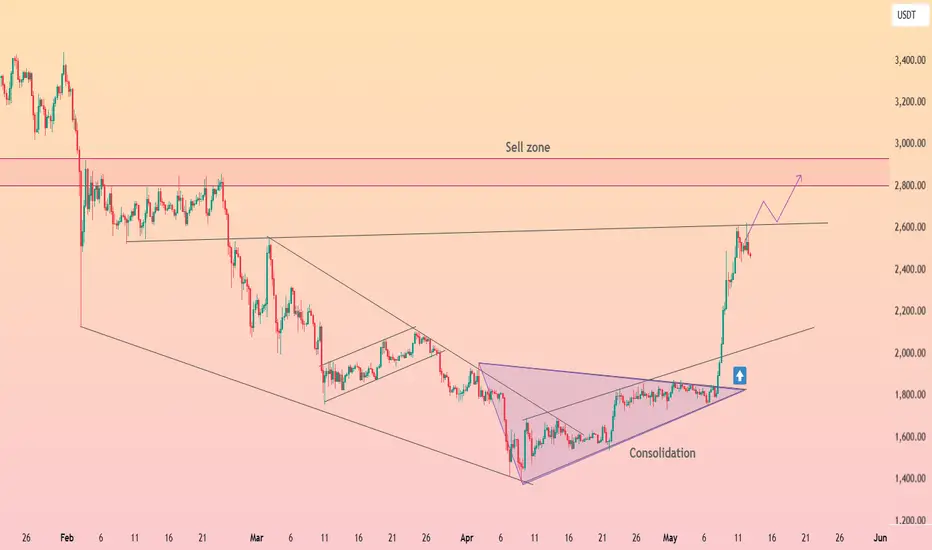
HolderStat┆ETHUSD retest $2500 After months locked inside a broad falling wedge, ETH erupted in early May, blasting through both the wedge roof and an internal consolidation triangle. The vertical thrust carried price from 1.8 k straight to 2.6 k, where a key horizontal lid now tests bulls’ resolve. Short‑term dips back toward the broken trendline or 2.2 k support would look constructive while momentum targets the well‑flagged 2.8‑3 k sell zone overhead. 🎯
ADAUSDT IDEALooking for the level breaks to the upside. This indicator has higher accuracy telling in short to medium term trades rather than long term anticipation.

ETHBTC – Bottom Likely In!Finally stepping in to say it—ETHBTC has likely bottomed.
April marked the final month of its bearish phase, and it just tapped the impulse zone from the last major move, which also lines up with a key range low we haven’t seen since December 2019.
The weekly is starting to show early signs of strength, adding weight to this being a pivotal area.
From a risk/reward standpoint, this is arguably the best BINANCE:ETHBTC setup in a long time.
Time to act accordingly—this could be the moment many have been waiting for. I expect BTC dominance to give alts some room over the next couple of weeks. The real test comes in July.
MARKETSCOM:ETHEREUM BINANCE:ETHUSDT

BTCUSDT IDEAAt the highs on the one side and on the contrary formations seems to be a chance for breakout to capturing more upside might put a limited move but with momentum (on the upside).
Only hurdle seems to be supplies on daily TF at this price.


ethereum towards + $10kETH towards + $10K
Ethereum’s Journey to + $10k Successfully Completes Major Milestone with PECTRA Update

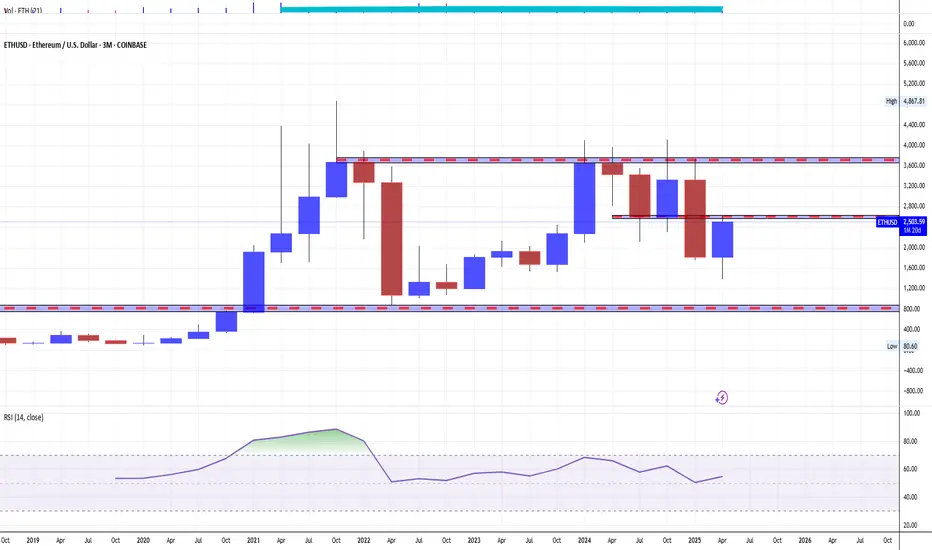
$5,792 Is The Easy Target, Ethereum At $8,519-$11,246 In 2025Ethereum's All-Time High happened November 2021 and sits around $4,868. While Bitcoin went to produce several new All-Time Highs in 2024 and 2025, Ethereum peaked with a triple-top around $4,100. Everything is about to change.
Ethereum (ETHUSDT) is now on its four consecutive green week with rising—high—volume. The next main target within the current bullish wave sits at $5,792, this is an easy target.
Ethereum did not hit a new ATH in 2024 but it is about to make a comeback with a vengeance. Ethereum will grow so strongly that many people will just not be able to understand what is actually happening, the signals are in.
Between March and May we have a classic stop-loss hunt event. It all started in February 2025 when ETHUSDT tested its August 2024 low and support. This level was tested twice and finally broke. The breakdown produced a classic rounded bottom and now the action is back in the bullish zone.
It is as if nothing really happened, a strong market shakeout. A long-term trader could have easily be on vacation while this event took place. When coming back, he would notice on 12-May the prices being in the same buy zone as in August-November 2024. Knowing that this buy zone led to a bullish impulse, which ended with a rejection and triple-top, he would know that the market was gathering strength before another challenge of resistance. This resistance around $4,100 will break easily this time on the way up.
Since ~$5,800 is an easy target, we can expect even higher prices in the coming months, specially the later part of 2025 when the bull market bull run will be in full force. $8,500 is possible and even higher with a blow-off top reaching $11,000 or $13,000 to end the bull market phase.
This is how things are looking now. We will adapt accordingly if market conditions change.
How far up Ethereum can go is anybody's guess, what cannot be doubted is the fact that it is going up; Crypto is going up; Bitcoin is going up more than 100%.
Thank you for reading.
Namaste.

BTC - Bulls vs Bears! Who will win?current market context
the chart displays btcusdt on the 1-hour timeframe, currently in a consolidation phase following a strong impulsive move to the upside. this phase is characterized by a range-bound price action forming a horizontal channel, with clear resistance near the top of the range and support near the bottom. the price is fluctuating between these two levels, indicating temporary equilibrium in the market where neither buyers nor sellers have established dominance.
consolidation structure
this range is acting as a reaccumulation zone, typically formed after a significant move when the market pauses to either absorb liquidity or distribute orders before the next impulsive leg. within this range, traders are positioning themselves for a potential breakout, and institutional players may be accumulating or offloading large positions depending on market intent. the balance within the range suggests that market participants are awaiting a catalyst before committing in size to a direction.
bullish breakout scenario
if price breaks above the range high, it would signal bullish continuation. such a breakout would likely occur with increased volume and a strong momentum candle, confirming buyer interest and initiating an expansion move. this move could target new highs, potentially opening the path toward all-time highs as the breakout clears short-term liquidity and invalidates local bearish structures. the green projection on the chart visually outlines this potential path, where the breakout leads to higher prices with minimal resistance above.
bearish breakout scenario
alternatively, a breakdown below the range low would indicate a shift in short-term market sentiment and a break in bullish structure. this scenario would likely trigger sell-side liquidity and initiate a quick move toward lower fair value gaps. these gaps, left unmitigated during the previous bullish rally, now serve as potential targets for price to fill. the red arrow illustrates a scenario where price pierces below support, accelerates lower, and seeks inefficiencies and demand zones around the \$98,000–\$95,500 levels. this breakdown would likely be sharp, driven by stop-loss triggers and sell-side imbalances.
range as a decision zone
the current structure represents a critical decision zone. the upper and lower boundaries are pivotal breakout levels, and the outcome of this consolidation will determine the short- to medium-term market direction. traders should exercise caution while price remains within the range, as fakeouts or liquidity sweeps are common near such levels. confirmed structure breaks and volume surges should serve as validation tools before entering directional trades.
liquidity and volume considerations
liquidity resting above and below the range acts as fuel for the eventual move. the longer the range holds, the more liquidity builds on either side, increasing the probability of a strong expansion when price finally breaks out. volume analysis will be key in validating the breakout’s legitimacy—without accompanying volume, the breakout could fail and result in a false move or whipsaw.
summary
this setup provides a high-probability environment for breakout traders and those waiting to trade the trend continuation or reversal. the market is compressing within a well-defined range, and a decisive breakout is likely imminent. preparation, not prediction, is the priority—wait for confirmation of structure shift and volume expansion before committing to either side.

BTC - Accumulation, Manipulation & Distributioncurrent market structure
this btcusdt 1-hour chart illustrates a classic three-phase market structure: accumulation, manipulation, and potential distribution. the price action follows a strong bullish impulse, after which the market enters a sideways range suggesting absorption of previous selling pressure. this kind of behavior is often observed before a continuation of the prevailing trend, but not without intermediate structural games, as seen in the projected manipulation phase.
accumulation phase
the blue highlighted zone marks a consolidation range that serves as an accumulation phase. during this stage, large market participants likely accumulate positions quietly while maintaining the price within a defined range. the tight price action within this zone and relatively small candles are consistent with market absorption, where supply is being matched or outpaced by demand. the repeated rejections of lower prices in this range imply growing buyer interest and strength building beneath the surface.
unfilled fair value gap
beneath the accumulation range lies an unfilled fair value gap (fvg), shown in grey. this price imbalance was left behind during the prior bullish leg and remains a magnet for price action. such gaps often attract price as the market seeks efficiency by mitigating unbalanced areas. the presence of this fvg makes it a likely candidate for a liquidity grab or retest before further bullish continuation.
manipulation setup
the red path outlines a possible short-term manipulation event. this move involves a quick sweep of liquidity beneath the accumulation zone, triggering stop-losses from late long entries and drawing price into the fvg. this is a classic “spring” or “shakeout” scenario designed to trap sellers and create panic, thereby enabling larger players to enter at discounted prices. the manipulation tag here signals a deliberate attempt to create false downside conviction before reversing upward.
re-accumulation and breakout
following the manipulation phase, the green projection shows a sharp reversal and aggressive push upward, initiating a new bullish leg. this move represents re-accumulation, where price quickly exits the range and enters an expansion phase. momentum will likely increase after price breaks back above the original range high, signaling confidence in the trend continuation and drawing in breakout traders. the large green area indicates the expected path toward a new distribution zone.
distribution projection
at the top of the chart, the green box represents a possible future distribution zone. after an extended bullish run, price often enters distribution, where buying interest begins to wane, and larger participants start offloading positions into retail strength. although speculative at this point, its placement reflects the natural progression of a market cycle if the projected bullish move plays out.
market psychology
this chart reflects a clear sequence in market psychology: stealth accumulation, a manufactured dip to create fear (manipulation), followed by a surge fueled by both institutional entries and retail breakout traders. understanding this dynamic helps traders anticipate rather than react, positioning themselves in alignment with likely intent rather than emotional impulses.
summary
the chart outlines a structured bullish scenario with a potential manipulation wick into an unfilled fvg, setting the stage for a continuation higher. if price reacts strongly off the fvg and regains the range, confirmation of bullish intent would be established. this setup emphasizes the importance of understanding liquidity dynamics and price inefficiencies, favoring patient and strategic entries over reactive ones.

Total market capTotal market cap is heading towards $10T
The handle cup neckline area was broken and a retest was performed.

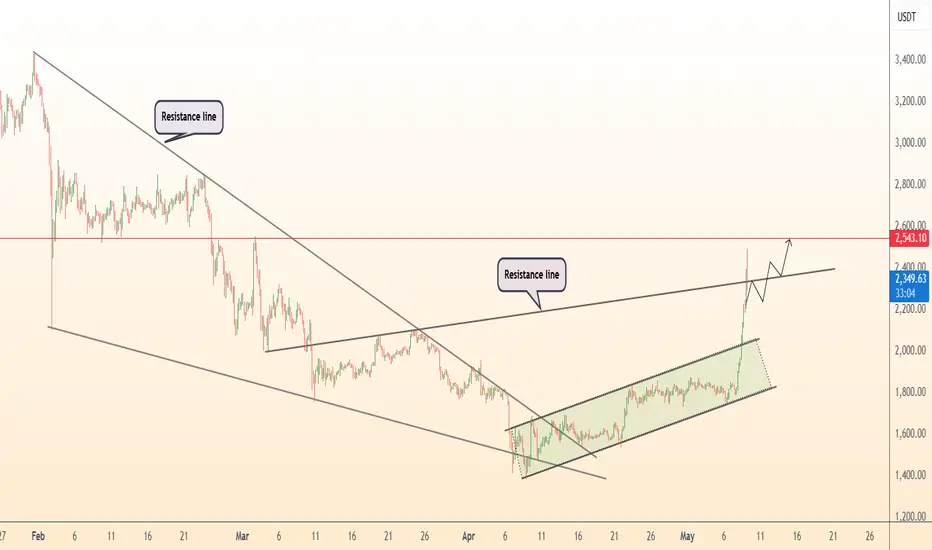
DeGRAM | ETHUSD the best score among the tops📊 Technical Analysis
● ETH blasted above the long‑term resistance line of the descending wedge, flipping it to support and signalling trend reversal.
● Price is riding a new rising channel; holding the mid‑channel support level (~$2 300) sets sights on the marked resistance level at $2 540 – 2 600.
✨ Summary
Wedge breakout + renewed ETF optimism favour a short‑term long: objectives $2 540 → $2 600+; strategy invalidated on a sustained drop below $2 200.
-------------------
Share your opinion in the comments and support the idea with like. Thanks for your support!
ETHUSDT 1D AnalysisETH ~ 1D Analysis
#ETH Buy gradually after retesting this support block with a short term target of at least 10%+ from here.

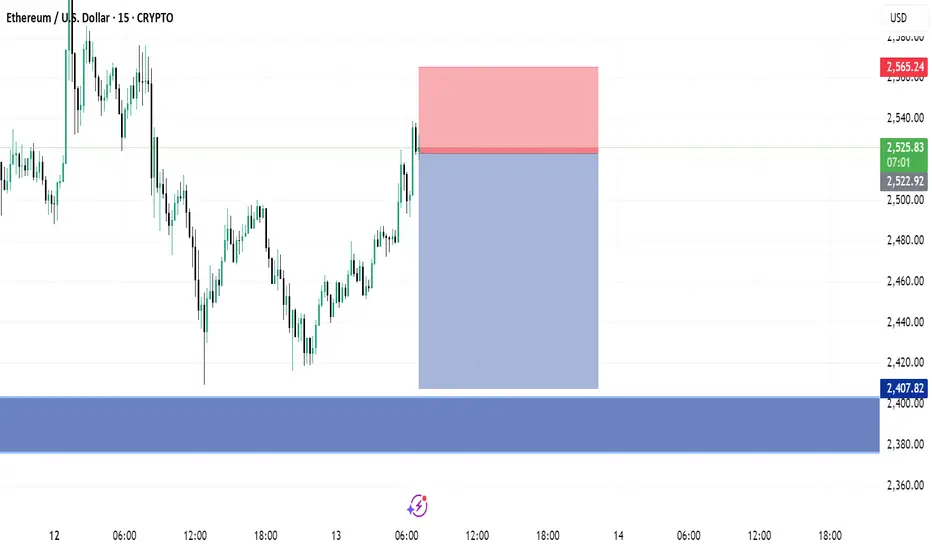
ETH Overextended: Eyeing a Retracement from Key Liquidity ZoneTechnical Analysis: ETH/USDT Daily/4H and 30m Chart 🚨
Ethereum (ETH) has experienced a powerful rally, surging from the $1,900 region to above $2,500 in just a few sessions. This explosive move has pushed price into a previous area of significant resistance, where a large liquidity pool is likely sitting. The current daily candle structure shows signs of hesitation, with smaller bodies and wicks indicating potential exhaustion at these highs.
Given the overextended nature of this move 📈 and the fact that ETH is now trading at a premium relative to its recent range, a retracement back toward equilibrium is probable. If price action breaks below the current range low (the most recent swing low on the daily), this could confirm a distribution phase 🏦 and open up a short opportunity.
I'm watching for a clear break and close below the range low to trigger a potential short setup. My expectation is for price to revisit the mid-range or even the origin of the recent rally, where demand may step in again. Until then, patience is key—let the market show its hand before entering.
Key Points:
ETH is overextended and trading into previous highs with heavy liquidity 💧
Signs of exhaustion are emerging at the top of the move
A break below the current range low could confirm distribution and offer a short setup 🔻
Targeting a retracement toward equilibrium, possibly the $2,000–$2,200 zone 🚨

Welcome to ALT SEASON (Real) | BTC.D & ETH/BTCCRYPTOCAP:BTC.D is rejecting off 2021 POI and deviating this cycle's high having just closed the weekly under 64%. Coupled with CRYPTOCAP:ETH strength showing signs of a trend reversal after downtrending for 4-year against $BTC. Likely see CRYPTOCAP:ETH trade upwards of US$5000 this year as ETH outperforms BTC.

ETH USDT Umbrella patternPrediction: an umbrella. Markets sometimes are symmetric, this time it might print an umbrella.

Ethereum ... Don't miss this train!The Ethereum season has arrived, and in the coming days, we'll be focusing on Ethereum and the tokens built on its network.
The chart shows a descending broadening wedge pattern, which has been broken on the daily timeframe.
Don’t wait for a retest or any major corrections—this train won’t wait for you.
The target for this pattern is $6,600.
Best regards Ceciliones🎯

Ethereum Daily AnalysisEthereum is trying to reach its important resistance levels. We are monitoring its reaction in these areas(2749-3105). After reaching important support levels, it should be checked whether Ichimoku is showing an upward trend or not, then the analysis will be updated.

ETH Targeting the HighsEthereum (ETHUSD) Trading Setup
Direction: CALL 🟢
Entry Price: $2,484.60 (most recent price from chart as of June 27, 2025)
Profit Target: $3,445.32 💰 (targeting previous highs as shown in the chart)
Stop Loss: $2,004.24 (below recent consolidation low for a 2:1 risk-reward ratio)
Risk-Reward Ratio: 2:1
Position Size: Risk 1-2% of your portfolio
Entry Timing: Enter immediately at market price
Confidence Level: 75% 🚀
Why This Signal?
Price Action: ETHUSD broke out of consolidation ($2,484.15-$2,679.34) with strong momentum, targeting previous highs at $3,445.32.
Technical Indicators:
Bullish breakout above 50-day and 200-day moving averages.
RSI at 78.32 (slightly overbought but supports momentum).
MACD showing bullish crossover (Bull signals on chart).
VIX/Bond Yields: VIX at 21.90 (low volatility, good for risk assets); 10-year Treasury yield at 4.375% (moderate, not a headwind).
News Sentiment: Mixed economic news with US-China trade tensions, but crypto markets remain resilient (per Forex Factory news).
Follow for the best AI generated Signals

Crypto Markets: “Sell in May, and Go Away” — What Does It MeanThe historical pattern known as the “Sell in May, and Go Away” seasonal divergence was popularized by the Stock Trader’s Almanac, which stated that investing in stocks represented by the Dow Jones Industrial Average from November to April and switching to fixed income for the other six months “has delivered reliable returns with reduced risk since 1950.”
What is “Sell in May, and Go Away”?
“Sell in May, and Go Away” is a well-known saying in finance. It is based on the historical underperformance of stocks over the six-month period from May to October.
According to Fidelity Investments, the divergence has been most pronounced in recent years, with the S&P 500 (SPX) gaining an average of about 2% from May to October from 1990 onwards over the next 30 years, compared with an average of about 7% from November to April.
The Halloween Indicator, 'Sell in May and Go Away': Everywhere and All the Time*, a research paper examining stock markets outside the US, found the same pattern, calling the seasonal divergence trend "surprisingly resilient."
Key Takeaways
👉 "Sell in May and go away" is a saying that refers to the historically weaker performance of financial markets from May to October compared to the other half of the year.
👉 Investors can try to capitalize on this pattern by switching to less risky assets from May to October, based on historical data.
Seasonality in investment flows may persist as a result of year-end bonuses from the financial industry and businesses, perhaps helped by the mid-April deadline for filing U.S. income tax returns.
Whatever the underlying fundamentals, the historical pattern was made more pronounced by the October stock market crashes of 1987 and 2008.
Final Points
👉 The problem with historical patterns is that they do not reliably predict the future. This is especially true for well-known historical patterns. If enough people became convinced that the “Sell in May and Walk Away” pattern would persist, it would essentially begin to disappear immediately. All the early sellers would try to sell in April and bid against each other to buy back the assets before everyone else in October.
👉 At the same time, certain considerations regarding the development of geopolitical events in the period from May to October 2025 reasonably give reason to think about the prospects of such a scenario for the next 6 months.
* The Halloween Indicator, 'Sell in May and Go Away': Everywhere and All the Time
>> Ben Jacobsen Tilburg University - TIAS School for Business and Society; Massey University
>> Cherry Yi Zhang. Nottingham University Business School China; Massey University - School of Economics and Finance.
--
Best wishes,
@PandorraResearch Team 😎
TOTAL market cap chart: turning bullish this monthGM gents, it seems the TOTAL crypto market cap chart is resuming the bullish trend that started in October 2023, after the bear market that started in late 2021 ended.
Sentiment is pessimistic, has shifted from capitulation to fading rallies to generalized wall of worry despite very positive technical developments.
Most people on CT expect the 'cycles' they now believe in to play out in the same predictable manner, all correlations and timing for moves and rotations to match, that obviously won't happen and hasn't happened since the market bottomed, and I expect it to continue to make people end up getting wrong footed (like selling too early cause now they say this is the last leg up due to alt szn).
People think we are in a late 2021 redux when in reality we had a COVID crash grade capitulation which can't really precede a top, but rather indicate we saw a bear market bottom long term. Trade is getting resolved, risks from mon pol as well, rate cuts coming soon and no on is positioned.
Don't miss out my friends.
Best of luck!
Cheers,
Ivan Labrie.

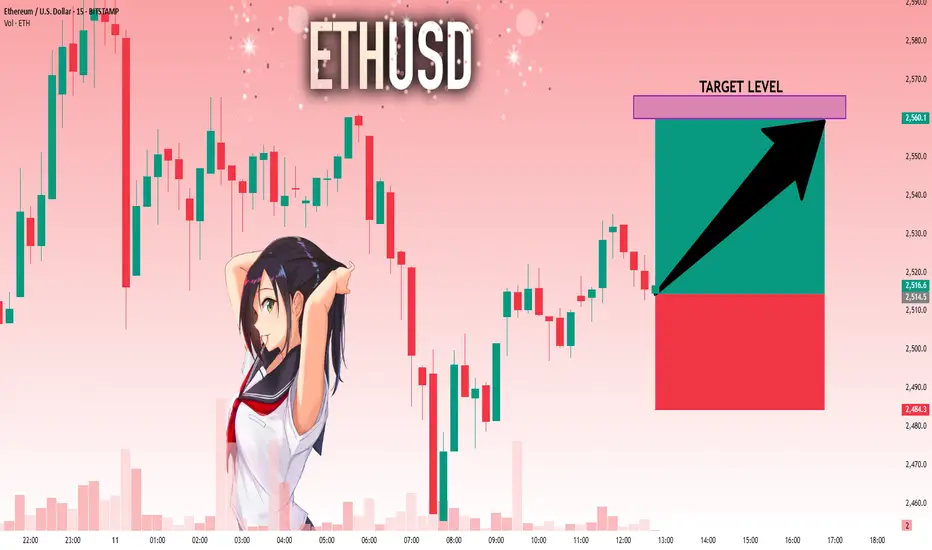
ETHUSD: Bulls Are Winning! Long!
My dear friends,
Today we will analyse ETHUSD together☺️
The price is near a wide key level
and the pair is approaching a significant decision level of 2,514.5 Therefore, a strong bullish reaction here could determine the next move up.We will watch for a confirmation candle, and then target the next key level of 2,560.1.Recommend Stop-loss is beyond the current level.
❤️Sending you lots of Love and Hugs❤️